Open Access
Proceedings
Association mapping through heuristic evolutionary history
reconstruction-application to GAW15 Problem 3
Alexander Platt
Address: Department of Molecular and Computational Biology, University of Southern California, 1050 Childs Way, Los Angeles, California 90089-2910, USA
Email: Alexander Platt - [email protected]
Abstract
This paper presents a novel method of identifying phenotypically important regions of the genome. It involves a form of association mapping that works by summarizing properties of the ancestral recombination graph (ARG) of a sample of unrelated phenotyped and genotyped individuals. By breaking the sample into many small sub-samples and averaging the results, it becomes computationally tractable to measure the degree to which the evolutionary history of any locus is consistent with the distribution of the phenotypes in the sample. Analysis of simulated rheumatoid arthritis data demonstrates the efficiency and effectiveness of this method in identifying loci of large phenotypic effect.
Background
Explicit reconstruction of the evolutionary history of a sample can provide a powerful tool for detecting genetic contributions to phenotypic variation in a population. This new method exploits the fact that an allele shared among individuals in a sample that contributes to similar-ities of those individuals' phenotypes must have origi-nated in an ancestral lineage shared only by those individuals. Therefore, regions of the genome containing genes that contribute to the differences among individuals in the sample will tend to have evolutionary histories that reflect the phenotypic distributions of those individuals. Other regions not contributing to the phenotype in ques-tion, will, due to recombinaques-tion, have histories that are uncorrelated with the distribution of phenotypes.
Cladistic analyses in association studies are a concept that date back to the late 1980s [1], and have been imple-mented several times since then [2-7]. Due to the com-plexities of within-population evolutionary histories, they have tended to employ clustering algorithms which result in decidedly non-evolutionary cladograms of individuals.
This paper considers the case of phased haplotype data drawn from a population of binary phenotypes. Given infinite computing power, the process would involve using the genetic data to infer the entire ancestral recom-bination graph (ARG) of the sample. This would give the entire set of evolutionary relationships of every piece of every haplotype with every other piece of every haplotype. From there it would be a simple matter to pick the
from Genetic Analysis Workshop 15
St. Pete Beach, Florida, USA. 11–15 November 2006
Published: 18 December 2007
BMC Proceedings 2007, 1(Suppl 1):S131
<supplement> <title> <p>Genetic Analysis Workshop 15: Gene Expression Analysis and Approaches to Detecting Multiple Functional Loci</p> </title> <editor>Heather J Cordell, Mariza de Andrade, Marie-Claude Babron, Christopher W Bartlett, Joseph Beyene, Heike Bickeböller, Robert Culverhouse, Adrienne Cupples, E Warwick Daw, Josée Dupuis, Catherine T Falk, Saurabh Ghosh, Katrina A Goddard, Ellen L Goode, Elizabeth R Hauser, Lisa J Martin, Maria Martinez, Kari E North, Nancy L Saccone, Silke Schmidt, William Tapper, Duncan Thomas, David Tritchler, Veronica J Vieland, Ellen M Wijsman, Marsha A Wilcox, John S Witte, Qiong Yang, Andreas Ziegler, Laura Almasy and Jean W MacCluer</editor> <note>Proceedings</note> <url>http://www.biomedcentral.com/content/pdf/1753-6561-1-S1-info.pdf</url> </supplement>
This article is available from: http://www.biomedcentral.com/1753-6561/1/S1/S131
© 2007 Platt; licensee BioMed Central Ltd.
branches of the graph that most consistently divide the sample into groups of cases and controls, and then to infer which segments of the haplotypes those branches describe. This is not a feasible approach with current or developing technology, so it is necessary to describe a heu-ristic method for capturing the most important signal from this graph without reconstructing it in its entirety.
What makes ARGs so difficult to reconstruct is that the number of possible ARGs for a sample increases exponen-tially with the number of haplotypes in the sample. While it is not difficult to infer an optimal ARG for a sample of extremely small size, it quickly becomes intractable for sample sizes even in the tens of haplotypes. This method capitalizes on the relative ease of estimating ARGs for small sample sizes by successively computing ARGs for many small sub-samples from within the set of haplo-types. For each site in each sub-sample, it is easy to deter-mine whether that ARG correctly divides the sub-sample cases from the sub-sample controls. The frequency across sub-samples is then the test statistic for determining the general trend in the topology of the overall ARG at each site. This statistic is a measure of the degree to which the history of a locus is consistent with the resulting pheno-typic distribution of the haplotypes and will be referred to as the consistency of the sample.
Methods
Algorithm
This algorithm is an iterative process of selecting and ana-lyzing subsets of the data. Each iteration starts with ran-domly selecting quartets of haplotypes composed of two control haplotypes and two unrelated case haplotypes. The program beagle [8] is used to infer the minimum number and location of recombinations necessary for each quartet to conform to an infinite sites model of evo-lution. Beagle scans the haplotypes for pairs of markers at which all four possible gametes are present. Without invoking recurrent mutation, this pattern indicates the presence of a recombination event somewhere between such marker pairs. Beagle assigns a minimum set of loca-tions of recombination events that satisfies all such pairs. These are used to divide the haplotypes in the quartet into a set of genomic segments each consistent with a single tree for an evolutionary history.
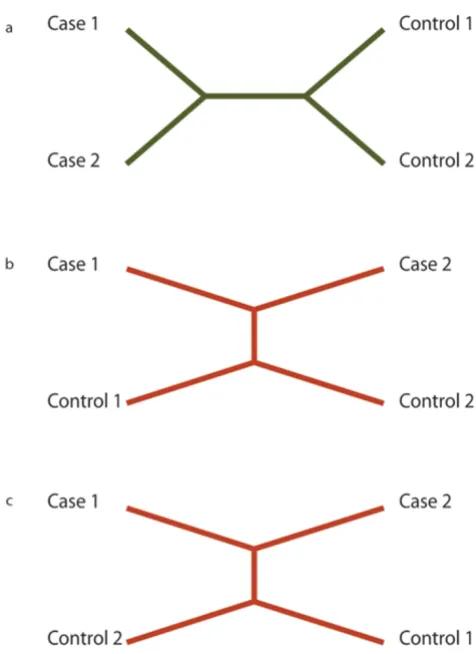
Next, each of these segments is passed to the pars program in the package PHYLIP [9] to generate a single most parsi-monious tree reflecting the history of that segment. This is the inferred evolutionary tree that minimizes the number of mutation events to describe all of the differences between the sequences. Of the three possible topologies for an unrooted tree with four taxa and no ambiguities (Fig. 1), only one will contain a branch that separates the two cases from the two controls. Segments generating a
tree with this topology are considered "consistent". Either of the other two topologies is considered "inconsistent". Segments that do not unambiguously generate a maxi-mum parsimony tree that is either consistent or inconsist-ent are thrown out.
After each segment is analyzed, the frequency across quar-tets in which each site finds itself in a consistent segment is calculated. This frequency, the consistency of the sam-ple, is used as the test statistic. Elevated levels of consist-ency correspond to sites better able to explain the differences between case and control phenotypes. The amount of information learned from the data increases with each iteration but does so with asymptotically diminishing returns once every possible quartet has been picked.
Assessing significance
The significance of results is addressed through classical hypothesis testing. The data are modeled as being drawn at random from two populations, one of case haplotypes
Possible tree topologies
Figure 1
and one of control haplotypes. Every mutation in the his-tory of the sample distinguishes between two alleles and creates two types of haplotypes, one with the ancestral allele at that site and one with the derived allele. If a par-ticular mutation contributes to the probability of disease, then haplotypes containing that allele will be over-repre-sented in the case population. The null hypothesis is that the two types are represented with equal frequency in both the case and control populations.
A given data set can be summarized as having K1 case hap-lotypes with a1 copies of one type of haplotype and (K1
-a1) of the other, and K2 control haplotypes with a2 and (K2
- a2) copies of the two types of haplotypes respectively. As all the trees are unrooted, it is not necessary to identify which type is ancestral and which is derived. Therefore, which type is labeled (a) is an arbitrary designation.
The probability of a randomly drawn quartet being counted as consistent, p(a1, a2, K1, K2), can be calculated
as
This is the probability of selecting a quartet composed of two haplotypes of one type from the control set and two haplotypes of the other type from the case set (which are the quartets that contribute to the signal in the data) plus 1/3 times the probability of selecting a quartet that con-tains three or four haplotypes of the same type and one or zero of the other (these quartets are uninformative and contribute only random noise).
The probability of a site being counted as consistent x
times after N quartets have been analyzed should be cal-culated as
This is essentially a binomial sampling probability with
p(a1, a2, K1, K2) being the chance of success on a particular
trial, summed over all the possible values of the random variables a1 and a2 times their probability densities, g(a1,
K1, α) and g(a2, K2, α), which are the binomial sampling probabilities of drawing a of the arbitrarily labeled haplo-types in K samples from a total population where the labeled type of haplotype is at frequency α.
Because the probability densities of a1 and a2 depend on the random variable α, the whole statement has to be inte-grated over all possible values of αtimes its probability density, f(α). Unfortunately, f(α) is unknown, so exact marginal probabilities cannot be calculated directly. However, for values of consistency above 1/3, which are the only ones of interest, the likelihood of the null hypothesis is at a maximum when α= 0.5, so assuming α = 0.5 and calculating p-values by summing the probabili-ties of finding the observed or higher number of consist-ent quartets is conservative.
Results
Applied to the high-density simulated SNPs of Replicate 1 of the Genome Analysis Workshop 15 Problem 3 data set, the algorithm correctly identifies Locus D as a site of great importance in determining simulated disease status. Fig-ure 2 shows calculated consistency values along the chro-mosome after analyzing 1000 quartets. Using the entire data set of 3000 case haplotypes and 2000 control haplo-types gives an estimated p-value of less than 10-308 at the
correct locus. This is the lowest p-value for the chromo-some, and in fact, the p-value may be considerably lower than this because smaller values are difficult to compute accurately. The actual numerical value has little meaning beyond demonstrating the vanishingly small probability of getting such a signal by chance. Figures 2b and 2c rep-resent the same analysis carried out on smaller random subsets of the data. In Figure 2b only a random subset of 10% of the haplotypes are used. The algorithm still cor-rectly identifies the simulated locus and estimates a p -value less than 10-65. In comparison, a simple chi-squared
test yields a p-value of 10-52 at the correct locus. Figure 2c
uses a random subset of 1% of the haplotypes, still cor-rectly identifies the proper locus, and gives a p-value of less than 10-11. The chi-squared test on these data gives a
p-value of 10-5.
Discussion
There are several practical matters to consider in applying this method. The first is that while the simulated data ana-lyzed in this paper were given as fully phased haplotypes, most real data are only known as unphased genotypes. Therefore, an additional step of estimating phase is neces-sary. There are several widely used algorithms for accom-plishing this, such as fastPHASE [10] or HAPLOTYPER [11]. These algorithms use the population genotype quencies in the samples to estimate the haplotype fre-quencies contributing to the sample. They are generally very accurate over short ranges but can introduce errors, essentially artificial recombination events between haplo-types, between markers with very little linkage disequilib-rium. These types of errors do not influence consistency estimates much at all, because all of the information used in estimating consistency comes from closely linked
markers. Furthermore, introducing artificial recombina-tions into the data set can only increase the type II error rate, not the type I error rate.
Similarly, this method is conservative to errors introduced by violations of the infinite sites model of evolution. Bea-gle invokes the infinite sites model to infer the existence of a recombination event. Recurrent mutation could cause
beagle to include extra recombination points. The only
detriment to this is that pars must now estimate two trees from the information that it would otherwise use to esti-mate just a single tree. This would cause a very local reduc-tion in power but cannot create false positives. A massive departure from the infinite sites model could mean that the trees produced by pars are poor reconstructions of the
true historical events. However, this too should only reduce the sensitivity of the test, not inflate the type I error rate.
The consistency estimate is unbiased for all values of N. As
N increases, the p-value of any consistency estimate above 1/3 decreases. There are diminishing returns as N
becomes a sizeable fraction of all the possible quartets. As the number of possible quartets is generally far larger than is reasonable (or worthwhile) to examine, a practical guideline would be to continue running the algorithm until effects of a minimally interesting consistency value are significant.
Conclusion
Population genetic data arise through a well understood and well modeled process of evolution. In association mapping studies, treating each locus and each haplotype as independent, unrelated trials, as in the chi-squared test and other simple regression analyses, robs an investigator of much useful information in her or his data and opens the door to spurious results. Making use of our under-standing of the process through which these data are cre-ated allows us to fashion more powerful and more reliable methods. The method of consistency shows that even a simple algorithm using piecewise approximations of evolutionary histories can offer a great increase in sta-tistical power. Additionally, statistics built on biological models can represent easily intuited biological properties. Unlike a chi-squared statistic, consistency is itself a meas-urement that relates directly to the biological phenome-non that it tests.
List of Abbreviations
ARG: ancestral recombination graph
Competing interests
The author(s) declare that they have no competing inter-ests.
Acknowledgements
AP appreciates discussions with Paul Marjoram, Magnus Nordborg, Simon Tavaré, and John Molitor.
This article has been published as part of BMC Proceedings Volume 1 Sup-plement 1, 2007: Genetic Analysis Workshop 15: Gene Expression Analysis and Approaches to Detecting Multiple Functional Loci. The full contents of the supplement are available online at http://www.biomedcentral.com/ 1753-6561/1?issue=S1.
References
1. Templeton A, Boerwinkle E, Sing C: A cladistic analysis of pheno-typic associations with haplotypes inferred from restriction endonuclease mapping. I. Basic theory and an analysis of alcohol dehydrogenase activity in Drosophila. Genetics 1987,
117:343-351.
2. Templeton A: A cladistic analysis of phenotypic associations with haplotypes inferred from restriction endonuclease
Consistency analyses on simulated data
Figure 2
mapping or DNA sequencing. V. Analysis of case/control sampling designs: Alzheimer's disease and the apoprotein E locus. Genetics 1995, 140:403-409.
3. Molitor J, Marjoram P, Thomas D: Fine-scale mapping of diseases with multiple mutations via spatial clustering techniques. Am J Hum Genet 2003, 73:1368-1384.
4. Durrant C, Zondervan K, Cardon L, Hunt S, Deloukas P, Morris A:
Linkage disequilibrium mapping via cladistic analysis of sin-gle-nucleotide polymorphism haplotypes. Am J Hum Genet 2004, 75:35-43.
5. Sillanpaa M, Bhattacharjee M: Bayesian association-based fine mapping in small chromosomal segments. Genetics 2005,
169:427-439.
6. Templeton A, Maxwell T, Posada D, Stengård J, Boerwinkle E, Sing C:
Tree scanning: a method for using haplotype trees in pheno-type/genotype association studies. Genetics 2005, 169:441-453. 7. Tzeng J: Evolutionary-based grouping of haplotypes in
associ-ation analysis. Genet Epidemiol 2005, 28:220-231.
8. Lyngsø R, Song Y, Hein J: Minimum recombination histories by branch and bound, proceedings of workshop on algorithms in bioinformatics. Lect Notes Comput Sci 2005, 3692:239-250. 9. Felsenstein J: PHYLIP (Phylogeny Inference Package) Version 3.6 Seattle:
Department of Genome Sciences, University of Washington; 2005. 10. Scheet P, Stephens M: A fast and flexible statistical model for
large-scale population genotype data: applications to infer-ring missing genotypes and haplotypic phase. Am J Hum Genet 2006, 78:629-644.