1
Influence of insert geometry and cutting parameters on
surface roughness of 080M40 Steel in turning process
K.G.Nikam
1, S.S.Kadam
21 Assistant Professor, Mechanical Engineering Department, Gharda Institute of Technology, Lavel, District :
Ratnagiri , Maharashtra, India.
2 Assistant Professor, Mechanical Engineering Department, K.I.T.’s College of Engineering, Kolhapur,
Maharashtra, India.
[email protected],[email protected]
Abstract
In this study effect of insert geometry and cutting parameters on surface roughness of 080M40 steel in turning process were investigated.CVD coated carbide inserts with two different shapes such as ‘C’ and ‘T’ were used. 080M40 steel bars were used for experimental study. Taguchi’s L9 orthogonal array were used for design of experiments. Experiments were conducted on both CNMG and TNMG type inserts separately. Three factors (cutting speed, feed and depth of cut) and three levels (low, medium and high) experiments were conducted and statistical analysis of variance was performed. The experiments have been conducted using L9 orthogonal array in a SPEED LX 200 MAJOR CNC lathe machine. Turning process carried out on the 080M40 steel. The optimum cutting condition was determined surface roughness were evaluated by the analysis of variance (ANOVA).
Key Words: Turning, insert geometry, Taguchi Method, ANOVA, Surface roughness.
1. INTRODUCTION
The output surface quality is very important in the study of metal cutting. A significant improvement in output quality may be obtained by proper tool and work piece combination, optimizing the cutting parameters. Tool insert is not only improves output quality, but also ensures low cost manufacturing. Tool insert include tool insert geometry such as nose radius, approach angle, rake angle, angle of inclination, clearance angle etc. Cutting parameters include feed rate, cutting speed, depth of cut, cutting fluids and so on.In machining of parts, surface quality is one of the most specific customer requirements where major indication of surface quality on machined parts is surface roughness value [1]. Taha et al. [2] were compared the experimental surface roughness value with theoretical surface roughness of two types of insert, ‘C’ type and ‘T’ type. The feed rate varied within the recommended feed rate range. It observed that there are large deviations between measured and theoretical surface roughness at low feed rates (0.05mm/rev) for both inserts. Patel et al. [3] have considered a novel approach for optimum cutting tool insert selection strategy. In this approach, Simple Additive Weighting (SAW) and Weighted Product Method (WPM) are used as Multiple Attribute Decision Making (MADM) methods for a case study of selection of tool insert for better surface finish in CNC
2 Prediction models are developed with the help of
regression analysis method using Minitab-16 software and finally the optimal and predicted results are also verified with the help of confirmation experiments.Ilhan Asilturk and Harun Akkus [8] obtained the effect of cutting parameters on surface roughness in hard turning using the Taguchi method. In this study, dry turning test carried out on hardened AISI 4140 (51 HRC) with coated carbide cutting tools. The statistical methods of signal-to-noise (S/N) ratio and analysis of variance (ANOVA) are applied to obtained effect of cutting parameters on surface roughness. Kumar et al. [13] obtained the effect of spindle speed and feed rate on surface roughness of Carbon Alloy Steel in CNC turning. In this study, five different carbon steel used for turning are SAE 8620, EN8, EN19, EN24 and EN47. As a result, it was concluded that the surface roughness increased with increased feed rate and it higher at lower speeds and vice versa.
The objective of this study is to observe the influence of two different insert geometry (‘C’ and ‘T’) and cutting parameters such as cutting speed, feed rate and depth of cut on surface roughness in turning .Also to obtain optimum conditions and to select the best insert. These cutting inserts are selected by MADM (Multiple Attribute Decision Making) method. Taguchi’s L9 Orthogonal Array was used in the design of experiment. Furthermore, analysis of variance (ANOVA) is performed to see which process parameters are statistically significant.
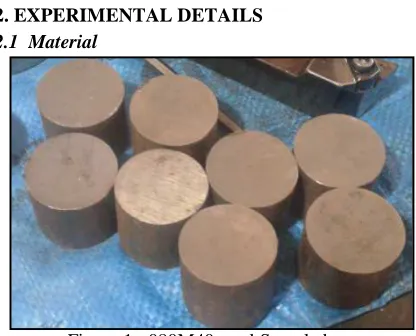
[image:2.595.311.523.347.475.2]2. EXPERIMENTAL DETAILS 2.1 Material
Figure 1: 080M40 steel Sample bars
For this study, 080M40 steel bars were used. The samples were selected as 40 mm diameter and 50 mm cutting length. Total 18 samples were used in present work. Nine samples were used for both ‘C’ type insert and ‘T’ type insert. This steel is used in various applications such as shafts, studs, keys, general
purpose axles; camshafts etc.It has 28 HRC hardness[7].
Table 1: Chemical composition of 080M40 steel
C % Si % Mn % S % P %
0.4 0.3 0.5 0.06 0.06
2.2 Cutting inserts
Chemical Vapour Deposition (TiN) coated carbide inserts were used as the cutting tool material. Selection of tool insert from number of alternative is so difficult so the cutting tool inserts were selected by MADM (Multiple Attribute Decision Making) method.
The Taegu Tec inserts with the ISO designation of CNMG 120408 FG (800 Rhombic insert) and TNMG 160408 SF were used. For TNMG insert MTJNR 2525 M16 tool holder were used. For CNMG insert PCLNL 2525 M12 tool holder were used.
Figure 2: ‘CNMG’ & ‘TNMG’ Cutting tool insert
2.3 Cutting condition
[image:2.595.73.281.492.660.2]The cutting tests were carried out under wet environment using JYOTI DX 200 CNC lathe which have maximum spindle speed of 4000 rpm and a maximum spindle power of 12 kW.
Table 2: Cutting parameters
Factor Cutting
parameters Level 1 Level 2 Level 3
Vc Cutting speed
(m/min) 160 200 240
F Feed
(mm/rev) 0.2 0.25 0.30
DOC Depth of cut
(mm) 0.5 1 1.5
[image:2.595.309.541.565.665.2]3 tool inserts. The cutting parameters are given in Table
number 2.
2.4 Surface roughness measurements
[image:3.595.307.527.133.349.2]The surface roughness was measured by Mitutoyo’s SJ-201 Surftest surface roughness tester within sampling length 2.5 mm. It is the skid type instrument. It detects -200µm to +160µm measurement range. It has diamond type stylus tip. Average surface (Ra) was measured by this instrument.
Figure 4: Mitutoyo’s SJ-201 Surftest surface roughness tester
3. DESIGN OF EXPERIMENTS
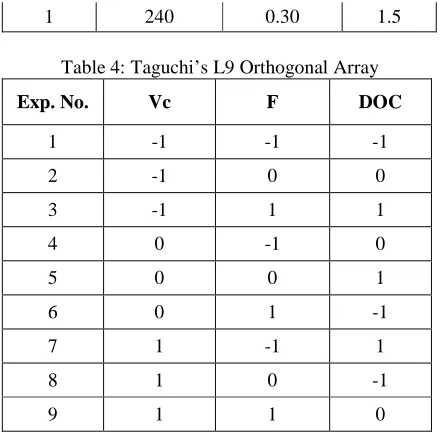
Taguchi’s L9 Orthogonal Array was used in the design of experiment. The main objective of Taguchi method is to ensure quality in the design phase. Taguchi technique also allows controlling the variations caused by the uncontrollable factors which are not taken into consideration at traditional design of experiment[9,12]. Taguchi technique converts the objective function values to signal-to-noise (S/N) ratio for measure the performance characteristics of the levels of control factors against these factors. Signal-to-noise (S/N) ratio is defined as the desired signal ratio for the undesired random noise value and shows the quality characteristics of the experimental data [10, 11]. The experimental design has been shown in Table 4 (all factors are in coded form).
Table 3: Process variables and their limits Process variables
Values in coded
form
(Vc) (mm/min)
(F) (mm/rev)
(DOC) (mm)
-1 160 0.2 0.5
0 200 0.25 1
1 240 0.30 1.5
[image:3.595.78.280.254.423.2]
Table 4: Taguchi’s L9 Orthogonal Array
Exp. No. Vc F DOC
1 -1 -1 -1
2 -1 0 0
3 -1 1 1
4 0 -1 0
5 0 0 1
6 0 1 -1
7 1 -1 1
8 1 0 -1
9 1 1 0
Table 5: The results of experiments and S/N ratios values for insert CNMG 120408 FG
Exp.No. Vc F DOC Ra1
S/N Ratio
1 160 0.2 0.5 2.83 -9.4309
2 160 0.25 1 4.06 -12.3819
3 160 0.30 1.5 4.43 -13.1793
4 200 0.2 1 3.51 -11.1981
5 200 0.25 1.5 4.01 -12.2132
6 200 0.30 0.5 4.14 -12.5882
7 240 0.2 1.5 2.87 -9.45513
8 240 0.25 0.5 3.91 -11.8657
9 240 0.30 1 4.38 -12.9281
[image:3.595.307.529.384.596.2] [image:3.595.69.290.630.729.2]4 optimization technique and thereby validation of the
optimization is tested.
Table 6: The results of experiments and S/N ratios values for insert TNMG 160408 SF
Exp.No. Vc F DOC Ra2 S/N Ratio
1 160 0.2 0.5 1.56 -4.34968
2 160 0.25 1 2.31 -7.60422
3 160 0.30 1.5 3.02 -9.60014
4 200 0.2 1 1.65 -4.86076
5 200 0.25 1.5 2.44 -8.06241
6 200 0.30 0.5 2.54 -8.39911
7 240 0.2 1.5 1.72 -5.15357
8 240 0.25 0.5 2.16 -7.04365
9 240 0.30 1 2.75 -9.06637
4. RESULTS AND DISCUSSIONS
The most essential criterion in the Taguchi technique for analyzing experimental data is signal-to-noise ratio. In this experimental study, the S/N ratio should have a maximum value to obtain optimum cutting conditions, according to the Taguchi method. Thus, the optimum cutting condition was found as -9.4309 and - 4.34968 S/N ratios for Ra1 and Ra2 respectively in L9 orthogonal array in Table 5 and Table 6. The optimum cutting conditions, which were the cutting speed of 160 m/min, the feed rate of 0.2 mm/rev and the depth of cut of 0.5 mm (1 1 1 orthogonal array) were obtained for the best Ra1 and Ra2 values. Out of three cutting inserts CNMG 120408 FG gives lower Ra values and more maximum values of S/N ratios so it indicates that TNMG 160408 FG insert gives best surface finish. Level values of the factors obtained for Ra1 and Ra2 according to the Taguchi design, are given in Table 7 and Table 8. Figure 4 and 5 shows the graphic of the level values given in Table 7 and Table 8.Therefore, interpretations may be made according to the level values of Vc, F, and DOC factors given in Table (7 and 8) and Figure (4 and 5) in determining optimum cutting conditions of experiments to be conducted under the same conditions.
Table 7: S/N response table for Ra1 factor.
Level Vc F DOC
1 -11.81 -10.18 -11.45 2 -12 -12.15 -12.17 3 -11.42 -12.9 -11.62 Delta 0.58 2.72 0.72
Rank 3 1 2
The average S/N ratio for every level of experiment is calculated based on the recorded value as shown in Table (7 and 8).
Table 8: S/N response table for Ra2 factor.
Level Vc F DOC
1 -7.185 -4.788 -6.597 2 -7.107 -7.57 -7.177 3 -7.088 -9.022 -7.605 Delta 0.097 4.234 1.008
Rank 3 1 2
[image:4.595.336.498.190.273.2]The different values of S/N ratio between maximum and minimum are (main effect) also shown in Table (7 and 8). The feed is one factors that have the highest difference between values, (for Ra1 = 2.72) and (for Ra2 = 4.234) respectively.
[image:4.595.311.533.343.506.2]Figure 4: The graphic of mean of S/N ratios versus factor levels (Ra1).
Figure 5: The graphic of mean of S/N ratios versus factor levels (Ra2).
250 225 200 -10.0
-10.5
-11.0
-11.5
-12.0
-12.5
-13.0
0.25 0.23
0.20 0.5 1.0 1.5
Vc
M
e
a
n
o
f
S
N
r
a
ti
o
s
F DOC
Main Effects Plot for SN ratios Data Means
Signal-to-noise: Smaller is better
250 225 200 -5
-6
-7
-8
-9
0.25 0.23
0.20 0.5 1.0 1.5
Vc
M
e
a
n
o
f
S
N
r
a
ti
o
s
F DOC
Main Effects Plot for SN ratios Data Means
[image:4.595.309.532.543.711.2] [image:4.595.101.261.658.737.2]5 The other two factors such as cutting speed and depth
of cut has very low difference values compared to feed. According to the Taguchi prediction that the larger difference between values of S/N ratio will have a more significant effect on surface roughness (Ra). Thus, it can be concluded that increasing the feed will increase the Ra significantly.
[image:5.595.71.290.326.453.2]MINITAB is Statistical Analysis software that allows to easily conducting analysis of data. The MINITAB 17 program studies the experimental data and then provides the calculated results of signal-to-noise ratio. In this experimental work, the software has given the signal-to noise ratio for surface roughness. The effect of different process parameters on surface roughness are calculated and plotted as the process parameters changes from one level to another. The use of both ANOVA and S/N ratio statistical method
Figure 6: Performance comparison of CNMG and TNMG type inserts
makes it easy to analyze the results and hence, make it fast to reach on the conclusion. From figure (3 and 4) it can be seen that with increase of feed rate surface roughness value would increase. If compare two figures it can be seen that feed rate affects the surface finish than other cutting parameters. Best surface roughness value is obtained at low value of feed rate. In addition, the graph shows that TNMG 160408 SF insert type gives better surface finish as feed rate increase as compare to other type of insert.
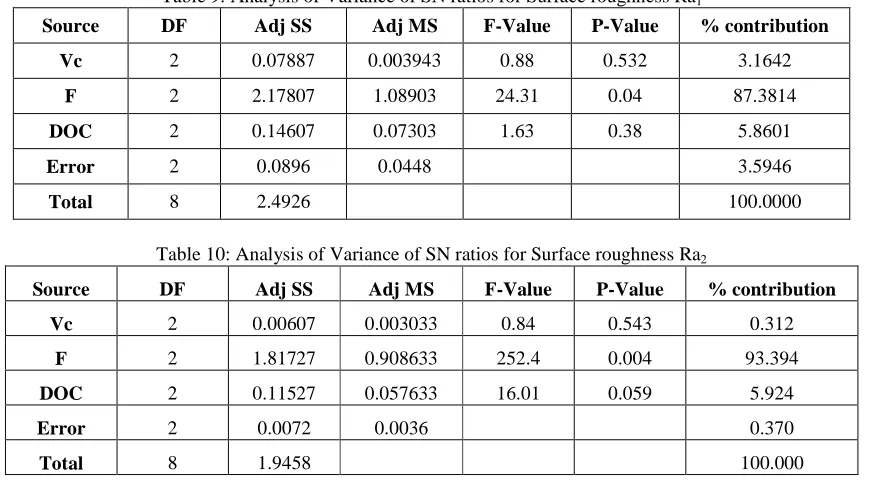
[image:5.595.82.518.491.733.2]The significant parameters influencing the surface roughness Ra1 and Ra2 are determined using analysis of variance (ANOVA). It helps in formally testing the significance of all main factors and their interactions by comparing the mean square against an estimate of the experimental errors at specific confidence levels. In ANOVA if the P value of factor is less than 0.05 then that factor is significant and if P value is more than 0.05 then that factor is insignificant. Table (9 and 10) shows the analysis of variance for surface roughness Ra1 and Ra2. It is clear from the table (9 and 10) that feed rate is the most significant factor for surface roughness Ra1 and Ra2.Effect of cutting speed and depth of cut is insignificant in the present study as compared with other cutting parameters for surface roughness Ra1 and Ra2.Figure 6 shows that TNMG 160408 SF gives better surface finish than CNMG 120408 FG insert.
Table 9: Analysis of Variance of SN ratios for Surface roughness Ra1
Source DF Adj SS Adj MS F-Value P-Value % contribution
Vc 2 0.07887 0.003943 0.88 0.532 3.1642
F 2 2.17807 1.08903 24.31 0.04 87.3814
DOC 2 0.14607 0.07303 1.63 0.38 5.8601
Error 2 0.0896 0.0448 3.5946
Total 8 2.4926 100.0000
Table 10: Analysis of Variance of SN ratios for Surface roughness Ra2
Source DF Adj SS Adj MS F-Value P-Value % contribution
Vc 2 0.00607 0.003033 0.84 0.543 0.312
F 2 1.81727 0.908633 252.4 0.004 93.394
DOC 2 0.11527 0.057633 16.01 0.059 5.924
Error 2 0.0072 0.0036 0.370
6
5. CONCLUSION
From the analysis of the results in the turning process using the signal-to-noise (S/N) ratio approach, analysis of variance (ANOVA) and Taguchi’s optimization method, the following can be concluded from the present study.
• The parameters such as cutting speed of 160 m/min, feed rate of 0.2 mm/revolutions and a depth of cut of 0.5mm give highest surface finish (lowest Ra).
• TNMG 160408 SF insert gives best surface roughness at high cutting speed (i.e. 240 m/min). • The results of Taguchi method shows that feed rate
is most significant parameter which affects the surface finish than the other cutting
parameters. The cutting speed and depth of cut are least significant parameters.
• TNMG 160408 SF insert gives better surface finish than CNMG 120408 FG insert.
• The results of ANOVA for surface roughness show that feed rate is most significant parameter than other cutting parameters. P value of cutting speed and depth of cut is greater than 0.05 so the cutting speed and depth of cut are not significant parameters.
6. SCOPE FOR FUTURE WORK
• One can also use response surface methodology for obtaining better result. • One can go for 3k full factorial design or L27
orthogonal array Taguchi design or for obtaining greater result than the L9 orthogonal array.
• One can also use cutting force, cutting fluid and cutting temperature as an additional factor with addition to cutting speed, feed and depth of cut.
REFERENCES
[1] M. Anthony Xavior, M. Adithan, Determining the influence of cutting fluids on tool wear and surface roughness during turning of AISI 304 austenic stainless steel, Journal of Materials Processing Technology 209, 2009, 900-909. [2] Zahari Taha, H.K.Lelana, Hideki Aoyama, “Effect
of insert geometry on surface roughness in the turning process of AISI D2”, The 11th Asia Pacific Industrial Engineering and Management System Conference,7-10 December,2010. [3] Nikunj V. Patel, R. K. Patel, U. J. Patel, B. P. Patel,
“A novel approach for selection of tool insert in
CNC turning process using MADM methods”, International Journal of Engineering and Advanced Technology (IJEAT) ISSN: 2249 – 8958, Volume-1, Issue-5, June 2012.
[4] A.Bhattacharya,S.Das, P.Majumdar and A. Batish, “Estimating the effect of cutting parameters on surface finish and power consumption during high speed machining of AISI 1045 steel using Taguchi design and ANOVA”, Prod. Eng.Res.Devel, Volume 3, pages 31-40, 2009. [5] V. S. Thangarasu, G. Devaraj, R. Sivasubramanian,
“High speed CNC machining Optimization of process parameters”, International Journal of Engineering, Science and Technology Vol. 4, No. 3, pp. 66-77, 2012.
[6] Ashish Kabra, Amit Agarwal, Vikas Agarwal, Sanjay Goyal, Ajay Bangar “Parametric Optimization & Modeling for Surface Roughness, Feed and Radial Force of EN-19/ANSI-4140 Steel in CNC Turning Using Taguchi and Regression Analysis Method”, International Journal of Engineering Research and Applications (IJERA) ISSN: 2248-9622 Vol. 3, Issue 1, pp.1537-1544,2013.
[7]http://www.steelexpress.co.uk/engineeringsteel/EN8 .html .
[8] Ilhan Asilturk , Harun Akkus, “Determining the effect of cutting parameters on surface roughness in hard turning using the Taguchi method” Measurement 44 (2011) 1697–1704.
[9] R. Shetty, R.B. Pai, S.S. Rao, R. Nayak, Taguchi’s technique inmachining of metal matrix composites, J. Braz. Soc. Mech. Sci. Eng.31 (1) (2009) 12–20.
[10] M. Kurt, E. Bagci, Y. Kaynak, Application of Taguchi methods in the optimization of cutting parameters for surface finish and hole diameter accuracy in dry drilling progress, Int. J. Adv. Manuf. Technol. 40 (2009) 458– 469.
[11] M. Gunay, A. Kacal, Y. Turgut, Optimization of machining parameters in milling of Ti–6Al–4V alloy using Taguchi method, e-J. New World Sci. Acad. Eng. Sci. 6 (1) (2011) 428–440.
[12] N. Satheesh Kumar, Ajay Shettyb, Ashay Shetty,Ananth Kb , Harsha Shetty, “Effect of spindle speed and feed rate on surface roughness of Carbon Steels in CNC turning” International Conference on Modeling,Optimization and Computing (ICMOC 2012).