International Journal of Research in Advent Technology, Vol.4, No.6, June 2016
E-ISSN: 2321-9637
Available online at www.ijrat.org
93
Distance Based Outlier Detection using Anti-hubs
Miss.Gavale Swati S.
1, Prof. Sandip Kahate
2Department of Computer Engineering1,2,M.E.Student1,Assistant professor2
Email:[email protected]1, [email protected]2
Abstract-Due to increase of dimensionality of data the distance based outlier detection method not working properly. This is happen due to irrelevant and redundant feature. Reverse nearest neighbors (RNN) of Point P is the points for which P is in their k nearest neighbor list. Points are frequently comes in k-nearest neighbor list of another points and some points are infrequently comes in k nearest neighbor list of different points are called as Anti-hubs. Earlier implemented outlier detection using antihubs but it has disadvantages are high computation cost. In the case of data that fulfill the requirement like which has outstanding dimensionality, computation cost and time requirement to find anti-hubs is high. For better results there is need to remove redundant feature. Using feature selection this paper extends anti-hub based outlier detection method for high dimensional data to improve the better and efficient system.
Index Terms-Data outlier detection; reverse nearest neighbors; high dimensional data.
1. INTRODUCTION
Need of outlier or anomaly detection is required for better performance of applications. Unsupervised, semi-supervised and supervised are main three types of outlier detection methods. By using labels outliers are identified. Need of availability of correct labels of the instances for supervised and semi-supervised outlier detection. For outlier detection availability of labels is not possible therefore unsupervised technique is used widely which does not need label to the instances.
Distance base outlier detection is most useful and popular method. Distance based outlier detection consider that normal instances have small amount distance among them and outliers have large amount distance from normal instances. As the dimensions of the data increases, distances turn useless to find outliers because each point seems as outlier. Regardless of the common notion that all points in a high-dimensional data-set seem to turn outliers, unsupervised methods can detect outliers under the assumption that all data attributes are purposeful, i.e. not noisy. The relation between the high dimensionality and outlier nature of the instances invented.
K-nearest neighbor of the point P is K points whose distance to point P is less than all other points. Reverse nearest neighbors (RNN) of Point P is the points for which P is in their k nearest neighbor list. Some points are frequently comes in k-nearest neighbor list of other points referred as hubs and some points are infrequently comes in k nearest neighbor list of some other points are referred as Anti-hubs.
For outlier detection RNN concept is used but there is no theoretical proof which explores the relation between the outlier natures of the points and reverses nearest neighbors. Reverse nearest count is get affected as the dimensionality of the data increases, so there is
need to investigate how outlier detection methods bases on RNN get affected by the dimensionality of the data.
In high dimensionality the problems is outlier detection and shows that how unsupervised methods can be used for outlier detection. How Anti-hubs are related to outlier nature of the point is investigates. For outlier detection based on the relation anti-hubs and outlier two methods are proposed for high and low dimensional data for showing the outlier-ness of points, beginning with the method ODIN (Outlier Detection using in-degree Number).
Large computation cost, time to calculate the reverse nearest neighbors of the all points discussed in existing system. Use of antihubs for outlier detection is of high computational task. Computation complexity increases with the data dimensionality. For this there is scope to removal of irrelevant features before application of Reverse Nearest Neighbor. So to solve this problem, feature selection is applied on the data. In that all features are rank according to their importance and required features are selected for finding reverse nearest neighbors. To find reverse nearest neighbor using euclidean distance and outlier score is calculated by using technique from existing system. According to studies, if system does not know about the distribution of the data then euclidean distance is the best choice. Proposed scheme deals with curse of dimensionality efficiently. We will discussed literature survey, system module, system application and also the experimental result of these modules.
2. LITERATURE SURVEY
94 scope todevelop an operational data quality checking
tool based on this algorithm is discussed.
HancongLiu et al[2] describe that outliers do not follow the distributed data, and may leads bad results with respect to statistical analysis. Many outlier detection tools are based on the assumption that the data is identically and independently distributed. In this paper, an outlier-resistant data filter-cleaner is proposed. The proposed data filter-cleaner includes an on-line outlier-resistant estimate of the process model and combines it with a modified Kalman filter to detect and “clean” outliers. The advantage over existing methods is that the proposed method has the following features: (a) a priori knowledge of the process model is not required; (b) it is applicable to auto correlated data; (c) it can be implemented on-line; and (d) it tries to only clean (i.e., detects and replaces) outliers and preserves all other information in the data.
Milos Radovanovi et al[3] presented various methods of the curse of dimensionality are known to present serious challenges to various machine-learning methods and tasks. They also discussed a new method of the dimensionality curse, referred to as hubness that affects the distribution of k-occurrences: the number of times a point appears among the k nearest neighbors of other points in a data set. Through theoretical and empirical analysis involving synthetic and real data sets we show that under commonly used assumptions this distribution becomes considerably skewed as dimensionality increases, causing the emergence of hubs, that is, points with very high k-occurrences which effectively represent “popular” nearest neighbors. They also examine the origins of this phenomenon, showing that it is an inherent property of data distributions in high-dimensional vector space, discuss its interaction with dimensionality reduction, and explore its influence on a wide range of machine-learning tasks directly or indirectly based on measuring distances, belonging to supervised, semi-supervised, and unsupervised learning families
Hans-Peter Kriegel et al[4] show that outlier scores provided by different outlier models differ widely in their meaning, range, and contrast between different outlier models and, hence, are not easily comparable or interpretable. They propose a unification of outlier scores provided by various outlier models and a translation of the arbitrary “outlier factors” to values in the range [0, 1] interpretable as values describing the probability of a data object of being an outlier. As an application, paper show that this unification facilitates enhanced ensembles for outlier detection.
Emmanuel Muller et al[5] describe outlier mining. Outlier mining is very useful task to distinguish exceptional outliers from regular objects. Outlier mining in the full data space, there are well established methods which are successful in measuring the degree of deviation for outlier ranking. In recent applications traditional outlier mining approaches miss outliers as they are hidden in subspace projections. Outlier ranking approaches measuring deviation on all available attributes miss outliers deviating from their
local neighborhood only in subsets of the attributes. They proposed a novel outlier ranking based on the objects deviation in a selected set of relevant subspace projections. In through experiments on real and synthetic data they show that our approach outperforms competing outlier ranking approaches by detecting outliers in arbitrary subspace projections.
Hermine N. Akouemo et al [6] proposed the combination of two statistical techniques for the detection and imputation of outliers in time series data. An autoregressive integrated moving average with exogenous inputs (ARIMAX) model is used to extract the characteristics of the time series and to find the residuals. The outliers are detected by performing hypothesis testing on the residuals and the anomalous data are imputed using another ARIMAX model. They tests the algorithm using both synthetic and real data sets and present the analysis and comments on those results.
Discoursed issues in outlier detection in the case of eminent data dimensionality and showed the way outlier detection in high dimensional data can be made using unsupervised methods described by Milos Radovanovic et al.[7]. It also enquires how Anti-hubs are associated to the point’s outlier nature.
3. SYSTEM MODULES
The proposed system consists of different modules. These modules are as follows:-
1] Feature selection 2] Reverse nearest neighbor 3] Outlier score
4] Training phase of outlier detection based on outlier score
International Journal of Research in Advent Technology, Vol.4, No.6, June 2016
E-ISSN: 2321-9637
Available online at www.ijrat.org
95 1.2 Feature Selection
To deal with the Curse of dimensionality proposed system is designed. It takes high computation cost, time to calculate the reverse nearest neighbors of the all points in existing system. Feature selection is applied on the data to overcome this problem. In this step, all features are rank according to their importance and required features are selected for finding reverse nearest neighbors. Importance of the feature is calculated using the Mutual Information (MI) measure. Mutual Information is one most important feature which calculates the mutual dependence between two features.
joint probability distribution. To calculate the MI of A, sum of MI of A with all other features is taken,
MI (A) = ∑ considered for finding the reverse nearest neighbor. To determine the reverse nearest neighbor, first k-nearest neighbors of each point is evaluated. Existing system used Euclidian measure for calculating the distance between two instances. Euclidian distance measure works fine for two and three dimensional data but is gets negatively affected with high dimensionality. According to studies, if system doesn’t know about the distribution of the data then Euclidean distance is the best choice. Number of occurrences of point P in the k nearest neighbor list of the all other points is called as k-occurrence. Points in the dataset for which point’s P is k-nearest neighbor are reverse nearest neighbor for point P. From the k-nearest neighbor list of each point, reverse nearest neighbor list of each point is calculated.
3. Outlier Score
Previous methods than existing system considered occurrence of the point as an outlier score. Less k-occurrence indicates more outlier score of the point. Proposed system will follow existing system to calculate the outlier score of the point. Sum of k-occurrence score of k-nearest neighbors of the point P is outlier score of the point P.
Outlier Score (P) = (k_occurence (pi))
Where pi is the nearest point of point P. If
Outlier scores (P) is larger than the threshold then Point P is considered as outlier.
4. Training Phase of Outlier Detection based on Outlier Score
After getting outlier score using a specific threshold number of records detected. Which are outlier or not is decided on the basis of outlier score? The first antihub algorithm implemented in which all the reverse nearest neighbor is input to the antihub. Here outlier sore is calculated. Then the sum of all outlier sore occurrences is calculated. The outlier score threshold is use to find out the outlier feature. Then outlier detection is normalizing using outlier score. Outlier score in the range of 0 to 1 to normalize the outlier detection.
5. Testing Phase of Outlier Detection based on Outlier Score
At the Testing phase records which having 0 at the end of the feature consider as normal feature. Outlier score is greater than outlier score which are anomaly or outlier. By using above results Accuracy of the system is calculated. Also value of true positive, true negative, false positive, false negative are evaluated. Outlier detection by using feature selection is more efficient and gives better performance than normal outlier detection process.
4. SYSTEM APPLICATION
There are various applications are available for finding the outlier detection like a Fraud Detection, Mobile Fraud Detection, Insurance Claim Fraud Detection,Image Processing ,Health Care Domainetc. Among these applications we will explain one in detail as per our system work
Actual Working in health care domain as per our system
In medical health care domain the dataset contain patient information. Dataset contain information about patient name, blood group, weight. From the given dataset we know that the normal and abnormal patient. There is availability of more number of normal patient and less numbers of abnormal patient. So our aim is to find out the abnormal patient from the large dataset. Here in this situation our system works better.
Here very first remove the record of patient whose information is redundant or not matching for the patient’s information. Selected patient are taken for the outlier detection purpose. Find nearest neighbor for the reverse nearest neighbor purpose. Once reverse nearest neighbor of the patients records are calculated then it sends to antihubs algorithm for calculation of outlier score.
So in this way in medical health care domain our system can be used for detection of normal and abnormal patients.
5. EXPERIMENTAL RESULTS
The reason of the conducting experiment the effect of feature selection before an
outlier detection on high dimensional data. To see the effectiveness accuracy, memory and time requirement of antihub based outlier detection i.e. Antihub2 [ Proposed method is compared. For experiment purpose, we used KDD dataset. Dataset contains instances, 42 attributes and 1.456% outliers. Minor class category considered as outlier class.
Fig. 1. Feature selection process
Select File forPreprocessing, Removal of red and unwanted feature to make a new dataset for the processing.
Fig. 2. Outlier detection with all feature
Calculate of outliers and accuracy of normal indexes by selecting the parameter of outlier detection .This process executed by without feature
So in this way in medical health care domain our system can be used for detection of normal and
EXPERIMENTAL RESULTS
experiments is to check of feature selection before anti-hub based outlier detection on high dimensional data. To see the memory and time requirement ntihub based outlier detection i.e. Antihub2 [7] and ethod is compared. For experiment dataset. Dataset contains 1050 attributes and 1.456% outliers. Minor
tlier class.
process
Select File forPreprocessing, Removal of redundant and unwanted feature to make a new dataset for the
Outlier detection with all feature
Calculate of outliers and accuracy of normal indexes by selecting the parameter of outlier detection .This process executed by without feature selection tab.
Fig. 3. Outlier detection with feature selection
Calculate of outliers score and accuracy of normal indexes by selecting the given parameter. This process executed by with feature selection tab.
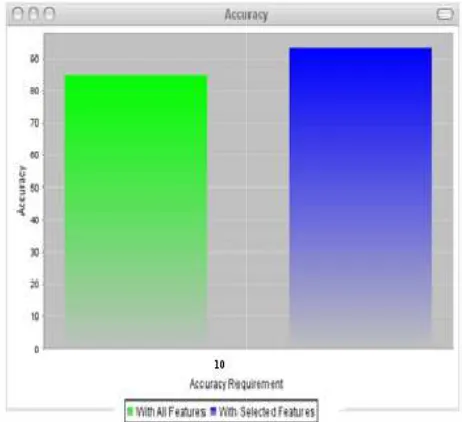
Fig. 4. Accuracy Comparison graph
6. CONCLUSION
Need to find anomaly or outlier detection in various real time applications. In this we stu
detection using antihubs by reversed nearest neighbor Due to high computational task and
complexity increases with the data dimensionality to avoid this removal of irrelevant features before application of reverse nearest neighbor is introduced. This improves efficiency of finding anti
enhances the anti-hub based unsupervised outlier detection.Actual results show that the
increases the accuracy while reducing memory requirement for outlier detection.
96
Outlier detection with feature selection
Calculate of outliers score and accuracy of normal indexes by selecting the given parameter. This process executed by with feature selection tab.
Accuracy Comparison graph
International Journal of Research in Advent Technology, Vol.4, No.6, June 2016
E-ISSN: 2321-9637
Available online at www.ijrat.org
97 REFERENCES
[1] Hawkins, D.: “Identification of Outliers”, Chapman and Hall, London, 1980.
[2] P. J. Rousseeuw and A. M. Leroy, Robust Regression and Outlier Detection. Hoboken, NJ, USA: Wiley, 1987.
[3] M. Radovanovi_c, A. Nanopoulos, and M. Ivanovi_c, “Hubs in space: Popular nearest neighbors in high-dimensional data,”J. Mach. Learn. Res., vol. 11, pp. 2487–2531, 2010.
[4] H.-P. Kriegel, P. Kr€oger, E. Schubert, and A. Zimek, “Interpreting and unifying outlier scores,” in Proc 11th SIAM Int. Conf. DataMining, 2011, pp. 13–24.
[5] E. M€uller, M. Schiffer, and T. Seidl, “Statistical selection of relevant subspace projections for outlier ranking,” in Proc. 27th IEEEInt. Conf. Data Eng., 2011, pp. 434–445.
[6] Hermine N. Akouemo and Richard J. Povinelli “Time series outlier detection and imputation” Milwaukee, Wisconsin 53233,july 2014