1689
Understanding the Intention to adopt 4G Mobile
Services in India using DTPB: A PLS-SEM approach
Dr.S.Sundar1, S.Kanimozhi2
Associate Professor1, Ph.D Research scholar2, Bharathidasan Institute of Management, Trichy1,2 Email: [email protected] ,[email protected]
Abstract- The purpose of the study was to understand the intention to adopt 4G mobile services in Indian context using the intention-based model, namely Decomposed theory of planned behaviour (DTPB). Data was obtained from 218 respondents who use 4G mobile services. Structural equation modeling (SEM) using Partial least squares (PLS) method was employed to examine the overall fit, explanatory power and path significance. The results have indicated that the DTPB theory provides a good explanation for the behavioural intention to use 4G mobile services by mobile users.
Index terms: 4G mobile services; technology adoption; Decomposed theory of planned behaviour; structural equation modeling
1. INTRODUCTION
Mobile technology has become the basic necessity for almost everyone in their daily chores to ensure speedy, convenient, advanced and effective communication. 4G mobile services offer high speed data transmission, making easy internet surfing, doing e-commerce transactions, and allowing location based marketing and much more. 4G mobile subscriber base has witnessed a steep rise from 35-40 million to 182 million within a year by the end of December 2017 (teleanalysis.com, 2018).
The number of information technology (IT) adoption studies that have been carried out in Indian context are limited, particularly about 4G mobile services. This study highlights the application of the Decomposed theory of planned behaviour (DTPB) in the mobile adoption context. This study has focused on investigating if DTPB explains the intention to adopt 4G mobile services by Indian mobile users. It has attempted to find the overall model fit, explanatory power and path coefficient significance upon applying DTPB in 4G mobile services context. The main objective of this study is to understand if DTPB can provide a more comprehensive explanation of the determinants of the behavioural intention to use 4G mobile services by mobile users in India.
2. REVIEW OF LITERATURE
The model under investigation in this study is DTPB (Figure 1). Davis (1993) proposed
Technology Acceptance Model (TAM) in 1986 which was adopted from the Theory of Reasoned Action (TRA) by Ajzen and Fishbein (1980) and attempted to predict and explain an individual’s IT acceptance. The model proposed that Attitude towards use and perceived usefulness of Information Technology (IT) together influence Behavioural intention to use IT. Perceived ease of use directly influences both attitude towards use and perceived usefulness of IT. The Theory of Planned Behaviour (TPB) extended the Theory of Reasoned Action (TRA) further into behavioural conditions which are not entirely under volitional control. TRA aimed to predict and understand human behaviour. TPB depicted that attitude towards use, subjective norms and perceived behavioural control influence behavioural intention to use.
1690 important people’s opinions on 4G mobile usage and
have the requisite skill, knowledge, resource and experience. The underlying causal relationships among attitude towards use, subjective norms, perceived behavioural control and behavioural intention are as specified by the Theory of Planned Behaviour.
[image:2.612.76.538.200.511.2]Non-availability of researches pertaining to 4G mobile services using DTPB is the key factor behind this study on understanding the behavioural intention towards 4G mobile services usage. 4G mobile services mandate everyday human’s lives and exploring more in this area would offer sufficient validation for marketing practitioners (Kanimozhi & Sundar, 2017).
Fig.1: Conceptual Framework- Decomposed Theory of Planned Behaviour
Source: Taylor, S. and Todd, P.A. (1995b)
3. METHODOLOGY
Validated scale items adapted from prior studies were used to measure the constructs of the DTPB. All scale items were measured using a 5-point Likert-type scale (from 1 = “strongly disagree” to 5 =
“Strongly agree”). Convenience sampling method
was selected for choosing the respondents. A well-established questionnaire was used for the study. The constructs used in the study are based on the extensive literature review on technology adoption.
The socio-demographic profile of the respondents is depicted in Table 1.
Table 1. Socio-Demographic profile of the respondents
Gender % Duration %
[image:2.612.320.565.641.705.2]1691
Total 100% 6 months – 1 year 52%
> 1 year 22%
Total 100%
Age group % Usage %
<= 25 years 34% < 30 min 6% 26–35 years 19% 30 min to 1 hour 10% 36–45 years 26% 1 – 2 hours 20% 46–55 years 16% 2 – 3 hours 31% > 55 years 5% > 3 hours 33%
Total 100% Total 100%
4. ANALYSIS AND RESULTS
4.1. Measurement Model
To empirically evaluate the proposed conceptual model (Figure1), a quantitative method is followed to measure the research constructs. A questionnaire was designed in two segments, the first captured information pertaining to the demographic profile of the respondents, and the second section was designed to capture the information on the intention to adopt
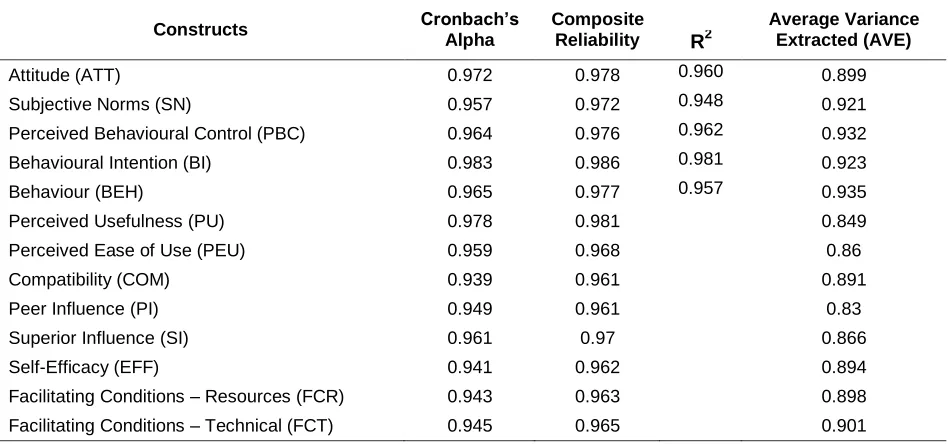
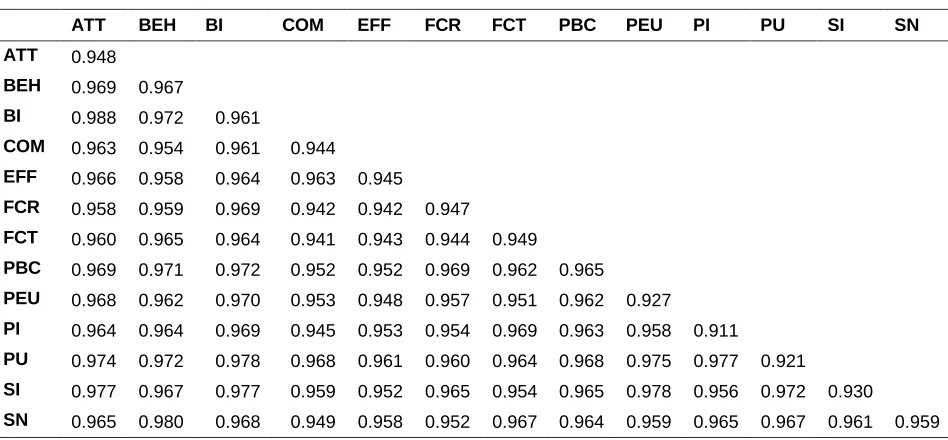
[image:3.612.70.544.470.692.2]4G mobile services to ensure that all respondents had an experience with 4G mobile services usage. Prior to the final data collection of the research study, assessment of validity and reliability was performed. A pre-test was conducted with 20 respondents who belong to various professions in India. A pilot study was conducted with a data of (N = 75) before final data collection. Exploratory factor analysis was performed to test whether the factors were appropriately measured, and it is found that all factors loadings are good. The KMO (Kaiser-Meyer-Olkin) value was 0.987, which is very well above the threshold value of 0.5 (Chen, Yeh & Huan, 2014), indicating that factor analysis is an appropriate method for data analysis. A total of 56 items were finalized for the study. The data were further analysed in terms of internal consistency/reliability using Cronbach’s alpha (Peterson, 1994). The composite reliability statistic met the criteria which are above the threshold value > 0.70 (Hair et al., 1998). The convergent validity statistics reveal that average variance extracted and the Fornell-Larker criterion are above 0.5 (Hair, Hult, Ringle, Sastedt & Thiele, 2017) as in Table 2 and Table 3. The data were analysed using partial least square (SMART PLS3) path modelling approach, and the results seemed satisfactory. Therefore, the main data collection process (N = 218).
Table 2. Reliability and Validity
Constructs Cronbach’s
Alpha
Composite Reliability
Average Variance Extracted (AVE) R2
Attitude (ATT) 0.972 0.978 0.960 0.899
Subjective Norms (SN) 0.957 0.972 0.948 0.921
Perceived Behavioural Control (PBC) 0.964 0.976 0.962 0.932
Behavioural Intention (BI) 0.983 0.986 0.981 0.923
Behaviour (BEH) 0.965 0.977 0.957 0.935
Perceived Usefulness (PU) 0.978 0.981 0.849
Perceived Ease of Use (PEU) 0.959 0.968 0.86
Compatibility (COM) 0.939 0.961 0.891
Peer Influence (PI) 0.949 0.961 0.83
Superior Influence (SI) 0.961 0.97 0.866
Self-Efficacy (EFF) 0.941 0.962 0.894
Facilitating Conditions – Resources (FCR) 0.943 0.963 0.898
Facilitating Conditions – Technical (FCT) 0.945 0.965 0.901
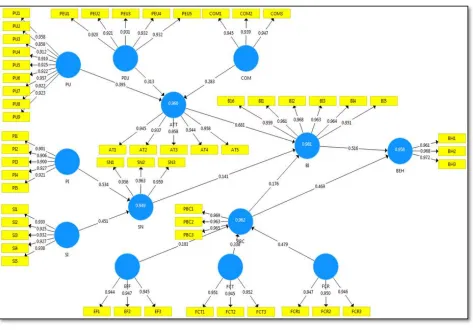
4.2 Structural Model A step by step analysis of the structural
1692 results and to test the hypotheses H1:H13. The
PLS-SEM analysis shows the results of the structural model estimating the relationship between the decomposed constructs and the mediators leading to Behavioural intention and further to Behaviour. The central criterion for the structural model assessment (Hair et al., 2017) namely, the coefficient of determination (R2) has a high value of 0.981 for Behavioural intention and 0.962 for Perceived Behavioural Control. The high R2 values substantiate
[image:4.612.75.549.235.455.2]the model’s predictive validity. The F2 effect size is 0.345 for Behaviour, 0.479 for Subjective norms and 0.506 for Perceived behavioural control, and these values are considered to be large based on Cohen’s threshold value. The model fit indices indicate that the SRMR value is 0.021, which is less than 0.10 or 0.08 (Hu & Bentler, 1999) and is considered to be a good fit, and the NFI (normed fit index) value of 0.822 represents an acceptable fit.
Table 3. Fornell & Larcker’s Criterion
ATT BEH BI COM EFF FCR FCT PBC PEU PI PU SI SN
ATT 0.948
BEH 0.969 0.967
BI 0.988 0.972 0.961
COM 0.963 0.954 0.961 0.944
EFF 0.966 0.958 0.964 0.963 0.945
FCR 0.958 0.959 0.969 0.942 0.942 0.947
FCT 0.960 0.965 0.964 0.941 0.943 0.944 0.949
PBC 0.969 0.971 0.972 0.952 0.952 0.969 0.962 0.965
PEU 0.968 0.962 0.970 0.953 0.948 0.957 0.951 0.962 0.927
PI 0.964 0.964 0.969 0.945 0.953 0.954 0.969 0.963 0.958 0.911
PU 0.974 0.972 0.978 0.968 0.961 0.960 0.964 0.968 0.975 0.977 0.921
SI 0.977 0.967 0.977 0.959 0.952 0.965 0.954 0.965 0.978 0.956 0.972 0.930
SN 0.965 0.980 0.968 0.949 0.958 0.952 0.967 0.964 0.959 0.965 0.967 0.961 0.959
1693 5. DISCUSSION
The present study performed a model testing to find out the behavioural intention to adopt 4G mobile services by working professionals. Based on the theory and model used, this study adopted reasonable model fit and explanatory power to evaluate the DTPB. Empirical results of this study showed the model achieving comparable fit to the data. According to the total effect, the result reveals that Attitude has a direct relationship with Behavioural intention (β:0.681, p<0.01), it implies that the DTPB model predicted attitude towards use of 4G mobile services. Moreover, findings of this study shows that the mobile users’ behavioural intention to use 4G mobile services could be well
[image:5.612.77.550.99.429.2]explained by attitude towards use. Also, Perceived Behavioural Control (β:0.469, p<0.01) and Behavioural Intention (β:0.516, p<0.01)are significant predictors of 4G mobile services usage. The results show that the mobile users, who perceived 4G mobile services to be useful in their daily chores are compatible with all aspects of their work, fit well with the way they work, and express a high willingness to use 4G mobile services voluntarily. To consider the approach that affects employees’ attitude towards use of 4G mobile services, the DTPB provides more usefulness and easily understood and managerially relevant information to guide user-friendly and easy adoption of 4G mobile services (Sundar & Kanimozhi (2018).
Table 4. Hypotheses testing
Hypothesis Constructs Path t-value F-square
Coefficient
1694 H4 Perceived Usefulness -> Attitude 0.395 0.158 0.129 H5 Perceived Ease of Use -> Attitude 0.313 0.02 0.118
H6 Compatibility -> Attitude 0.283 0.014 0.123
H7 Peer Influence -> Subjective Norms 0.534 0.083 0.479 H8 Superior Influence -> Subjective Norms 0.451 0.099 0.341 H9 Self-efficacy -> Perceived Behavioural Control 0.181 0.967 0.074 H10 Facilitating Conditions-Resources -> Perceived Behavioural
Control 0.479 1.712 0.506
H11 Facilitating Conditions-Technology -> Perceived Behavioural
Control 0.338 2.898 0.248
H12 Behavioural Intention -> Behaviour 0.516 0.082 0.345 H13 Perceived Behavioural Control -> Behaviour 0.469 0.007 0.285
The path coefficient between Subjective norms and Behavioural intention to use 4G mobile services (β:0.141, p<0.01) is significant which denotes that Subjective norms are associated with the respondents’ behavioural intention to use 4G mobile services. Though the causal relationship was significant, the effect size was the weakest among the causal relationships from Perceived usefulness, Perceived ease of use and Compatibility to Attitude towards use of 4G mobile services. The components of peer influence and superior influence are positively associated with subjective norms and that 4G mobile services acceptance in personal and official lives of working professionals is mandatory. Therefore, this result might be caused by the fact that the respondents may be affected from social pressure from the referent group in normal routine use of 4G mobile services. This referent group might include immediate superiors, subordinates and colleagues. Consequently, this study may infer those who are important to the 4G mobile users can influence their behavioural intention to use 4G mobile services.
To consider the role of perceived behavioural control in the mobile users’ acceptance of 4G mobile services, significant and positive relationship was found between perceived behavioural control and usage behaviour of 4G mobile services. Also, self-efficacy is associated with perceived behavioural control and thus perceived behavioural control could explain its association with behavioural intention to use 4G mobile services. This implies that the respondents have confidence in using 4G mobile services and thus there is an availability of providing support to be more willing to use 4G mobile services voluntarily. More specifically, technology and resource facilitating conditions support perceived behavioural control which explains
that in an involuntary environment, if technical and resource facilities are efficiently provided, the mobile users will perceive the use of 4G mobile services as easy.
The DTPB appears to be marginally explaining the intention to adopt 4G mobile services at best. In conclusion, the DTPB more fully explains the mobile users’ behavioural intention to use 4G mobile services. Thus, the results generally indicated that the DTPB provides an improved approach of explaining the behavioural intention to use 4G mobile services by mobile users.
1695 6. LIMITATION AND FURTHER RESEARCH
DIRECTIONS
A limitation of this study is the inclusion of data only from working professionals in India, rendering its inability to generalize research findings. Further research could be extended using other demographic profile of respondents to identify the applications and usage of 4G mobile services in a varied context. Continued research can be applied in other organisational settings to examine other types of Information systems (IS), since users’ attitude towards use, subjective norms and perceived behavioural control towards IS usage are context-dependent and may be related to specific task. This study has focused on the respondents who already use mobile services and adopted 4G mobile services or new users of the same. The factors affecting intended behavioural change are based on the level of experience by the users (Zain et al., 2005). Hence, further research is required to verify the research model considering the respondents with a wide variety of experiences including non-professional contexts like personal use.
REFERENCES
[1] Ajzen, I.; Fishbein, M. (1980): Understanding attitudes and predicting social behavior. Prentice-Hall.
[2] Ajzen, I. (1991): The theory of planned behavior. Organizational Behavior and Human Decision Process,50(2), pp. 179-211.
[3] Chen, H.B.; Yeh, S.S.; Huan, T.C. (2014): Nostalgic emotion, experiential value, brand image, and consumption intentions of customers of nostalgic-themed restaurants. Journal of Business Resarch, 67(3), pp. 354-360.
[4] Davis, F.D. (1993): User acceptance of information technology: system characteristics, user perceptions and behavioral impacts. International Journal of Man Machine Studies, 38(3), pp. 475–487.
[5] Fishbein, M.; Ajzen, I. (1975): Beliefs, Attitude, Intention and Behaviour: An Introduction to Theory and Research. Addison-Wesley, Reading, MA.
[6] Fornell, C.; Larcker, D. (1981): Evaluating structural equation models with unobservable and measurement error. Journal of Marketing Research, 18(1), pp. 39-50.
[7] Hair, J.F.; Anderson, R.E.; Tatham, R.L.; Black, W.C. (1998): Multivariate Data Analysis. 5th ed., Englewood Cliffs, NJ: Prentice-Hall.
[8] Hair, J.F.; Hult, G.T.M.; Ringle, C.M.; Sarstedt, M.; Thiele, K.O. (2017): Mirror, mirror on the wall: A comparative evaluation of composite-based structural equation modeling methods. Journal of Academy of Marketing Science, 45(5), pp. 616-632.
[9] Hu, L.T.; Bentler, P.M. (1999): Cutoff criteria for fit indexes in covariance structure analysis: Conventional criteria versus new alternatives. Structural equation modeling: A Multidisciplinary Journal, 6(1), pp. 1-55.
[10]Huh, H.J.; Kim, T.; Law, R. (2009): A comparison of competing theoretical models for understanding acceptance behavior of information systems in upscale hotels. International Journal of Hospitality Management, 28, pp. 121-134.
[11]Kanimozhi, S.; Sundar, S. (2017): Adoption of 4G mobile services in India: An explanation through Decomposed Theory of Planned Behaviour. Journal of Emerging Technologies and Innovative Research, 4(11), pp. 23-27. [12]Peterson, R.A. (1994); A meta-analysis of
Cronbach’s coefficient alpha. Journal of consumer research,27, pp. 381-391.
[13]Ringle, C. M.; Wende, S.; Becker, J.M. (2015): SmartPLS 3. Boenningstedt: SmartPLS GmbH, http://www.smartpls.com.
[14]Sundar, S.; Kanimozhi, S. (2018): Intention To Adopt 4G Mobile Services In India: An Investigation of The Moderating Effect of Gender Through the Decomposed Theory of Planned Behaviour. International Journal of Business and Management Invention (IJBMI) , 7(2), pp. 34-42.
[15]Taylor, S.; Todd, P. (1995): Decomposition and crossover effects in the theory of planned behaviour: A study of consumer adoption intentions. International Journal of Research in Marketing, 12, pp. 137-155.
[16]Taylor, S.; Todd, P.A. (1995a): Assessing IT usage: the role of prior experience. MIS Quarterly,19(4), pp. 561-70.