*Corresponding author:Milind Ubale ISSN: 0976-3031
Research Article
A VALIDATED STABILITY-INDICATING HPLC ASSAY METHOD FOR
S-ZOPICLONE IN BULK DRUG
Milind Ubale* and Suvarna Lawale
Department of Chemistry, Vasantrao Naik College, Aurangabad (MS) INDIA
DOI: http://dx.doi.org/10.24327/ijrsr.2017.0809.0824
ARTICLE INFO ABSTRACT
Zopiclone commonly classified in category of Z-drugs. It is well known hypnotic agent used for treatment of sleep disorder. Zopiclone is non-benzodiazepine compound and its mechanism of action based on modulating benzodiazepine receptors. An isocratic reversed phase stability-indicating high-performance liquid chromatographic (HPLC) assay method was developed and validated for quantitative determination of Zopiclone in bulk drugs. Method developed with column Zorbax C18, 250 x 4.6mm 5µm or equivalent, and the mobile phase containing 0.5% glacial acetic acid. The developed method was validated with respect to linearity, accuracy (recovery), precision, system suitability, selectivity, robustness prove the stability indicating ability of the method.
INTRODUCTION
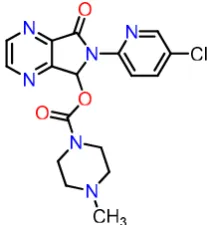
Zopiclone is chemically nonbenzodiazepine compound and hypnotic in nature, which is found effective and been used for treatment in insomnia [1]. It suppresses the brain activity and help patient to sleep. Zopiclone classified in Z-drugs like that of benzodiazepines core structure containing drugs and barbiturates but chemically unrelated with them as shown in figure 1. Zopiclone during its mechanical action interacts with gamma-aminobutyric-benzodiazepine receptor complex. Zopiclone acts on benzodiazepine binding site perticurly on α1, α2, α3 and α5 GABAA and exhibits negative action of GABA [2-4]. Molecular formula of Zopiclone is C17H17ClN6O3 structural formula depicted in figure 1 and molecular weight is 388.8g/mol.
To analysis any drug most desirable method must be simple and sensitive with cost-effective. Present attempted of analysis of Zopiclone as bulk or as tablet dosage is outcome of our continuously efforts for established reliable method of drugs by HPLC technique [5], according to the ICH guideline [6-15].
MATERIALS AND METHODS
The separation of the analyte was done by using with Zorbax C18, 250 x 4.6mm 5µm or equivalent column. The instrument was equipped with a pump (2695), injector, PDA Detector
(2996) and column oven. Data acquisition was done by using Empower software. Degassing of the mobile phase was done by using an ultrasonic bath sonicator whenever necessary.
A Mettler Toledo (XS 205 dual range) electronic balance was used for weighing the materials. Class ‘A’ Borosil glassware were employed for volumetric and general purpose in the study. The reference sample of Zopiclone was obtained from Lupin Pvt. Ltd. Aurangabad. The tablets of were obtained from the local market. Ammonium bicarbonate (AR grade, Merck), Acetonitrile (HPLC grade, Sigma Aldrich), Methanol (HPLC grade, Sigma Aldrich), water (Milli-Q / HPLC grade) were used. Chromatographic conditions were used are shown in table 1.
International Journal of
Recent Scientific
Research
International Journal of Recent Scientific Research
Vol. 8, Issue, 9, pp. 20091-20095, September, 2017
Copyright © Milind Ubale and Suvarna Lawale, 2017, this is an open-access article distributed under the terms of the Creative Commons Attribution License, which permits unrestricted use, distribution and reproduction in any medium, provided the original work is properly cited.
DOI: 10.24327/IJRSR
CODEN: IJRSFP (USA)
Article History:
Received 05th June, 2017
Received in revised form 21st
July, 2017
Accepted 06th August, 2017
Published online 28th September, 2017
Key Words:
HPLC, S-Zopiclone, Validation, Chromatographic techniques.
Chromatographic Conditions and Preparation Of Solutions
Preparation of Acetate buffer
Weigh accurately 2.5 gm of sodium acetate and transfer into 1000ml volumetric flask, dissolve and dilute up to the mark with water. Adjust the pH 5.5 with dilute acetic acid.
Preparation of mobile phase
Acetate buffer : Acetonitrile (separate lines) 75 : 25
Test is not valid unless retention time of principle peak of S-Zopiclone is between 13 to 17 minutes.
Preparation of S-Zopiclone working standard solution (500 ppm)
Weigh accurately 50mg of S-Zopiclone working standard and transfer into a 100ml volumetric flask, dissolve and dilute up to the mark with diluents.
Preparation of S-Zopiclone sample solution (500 ppm)
Weigh accurately 50mg of S-Zopiclone sample and transfer into a 100ml volumetric flask, dissolve and dilute up to the mark with diluents.
Preparation of standard solution
Weighed accurately 50.58 mg of standard and transferred it into a 100 ml volumetric flask, dissolved and diluted the volume up to the mark with diluents. Injected six replicate injections were of S-Zopiclone working standard solution.
Preparation of sample solution
Weighed accurately 50 mg of test sample and transferred it into a 100 ml volumetric flask, dissolved and diluted the volume up to the mark with diluents. Prepared six samples solutions separately in similar manner.
Calculated the Assay of each sample of S-Zopiclone by comparing against the working standard.
Calculated % RSD of assay values.
Assay = ×Ws× P
(100 − )× 100 Where,
At = Area of principal peak in sample solution,
As = Average area of principal peak in standard solution, Ws = Weight of working standard in mg,
Wt = Weight of sample in mg,
P = % Potency of working standard on as is basis.
Method Validation
The method was validated in compliance with ICH guidelines. The parameters determined for validation were specificity, precision, accuracy, robustness, linearity, Limit of Quantification and Limit of Detection, system suitability and stability of analytical solution.
Specificity
The method specificity was assess by comparing the chromatograms obtained from a saline solution containing a mixture of most commonly used excipients without the drug and another solution containing the excipients with the drug. These solutions were prepared in the mention diluents. The mixtures were filtered before injection. The saline solution and the sample solution (blank and the drug) were injected into HPLC system and the relevant chromatograms observed.
Method Precision
System precision
Six replicates of standard solution of Zopiclone were injected into HPLC system.
Method precision
The precision of the procedure was determined by repeatability. Six sample preparations were made from a single batch of Zopiclone tablets and analyzed as per the proposed method.
Intermediate precision (Ruggedness)
Ruggedness of method was verified by analyzing six sample preparations of same batch used under method precision as per proposed method by different analysts using different instrument and on different day. The amount of Zopiclone in Zopiclone tablets was determined. % RSD for % assay of Zopiclone was calculated, for six preparations.
Accuracy
The placebo was spiked with known amounts of Zopiclone (API) at about 50%, 100% and 150% of test concentration prepared in triplicate at each level. Amount of Zopiclone was quantified and % recovery was calculated from amount found and actual amount added. % Recovery at each level was calculated.
Linearity
Linearity of response was performed using the standard solution in a range of 50ppm to 300ppm [50% - 150% of the test concentration].
Stability in analytical solution
Stability of Zopiclone in analytical solution was verified by analyzing sample solution initially and also at different time intervals up to 48 hrs when the sample was stored at room temperature.
Robustness
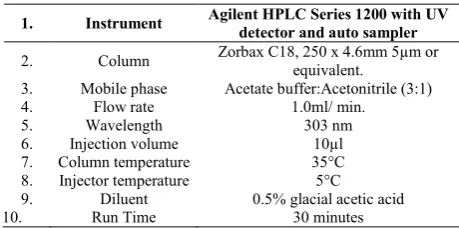
To evaluate robustness, following variations were made in the method and the samples were analyzed in triplicate. Change in Flow rate by (10%), Change in Organic content variation in mobile phase (± 2mM). System suitability was evaluated in Table 1 Optimized Chromatographic conditions
1. Instrument Agilent HPLC Series 1200 with UV detector and auto sampler
2. Column Zorbax C18, 250 x 4.6mm 5µm or
equivalent.
3. Mobile phase Acetate buffer:Acetonitrile (3:1)
4. Flow rate 1.0ml/ min.
5. Wavelength 303 nm
6. Injection volume 10µl
7. Column temperature 35°C
8. Injector temperature 5°C
9. Diluent 0.5% glacial acetic acid
each condition and results were compared with method precision results.
Limit of Detection and Limit of Quantification: Limit of
detection (LOD) is defined as the lowest concentration of analyte that gives a measurable response. LOD is determined based on signal to noise ratio (S/N) of three times typically for HPLC methods. The limit of quantification (LOQ) is defined as the lowest concentration that can be quantified reliably with a specified level of accuracy and precision.
RESULTS AND DISCUSSIONS
Mixture of acetate buffer:acetonitrile (3:1) at a flow rate 1ml/min. were found as suitable solvent system.
Result
% RSD of assay values is 0.02 %.
Acceptance criteria
% RSD of assay values should not be more than 2.0 %.
Accuracy
Accuracy of S-Zopiclone was studied by injecting sample solutions prepared at three different levels as given below.
Preparation of S-Zopiclone standard
Weighed 50.05 mg of standard and transferred into a 100 ml volumetric flask. Dissolved and diluted up to the mark with diluents.
Result
% RSD of peak area of S-Zopiclone working standard is 0.10 %.
Accuracy of each sample is between 98.5 to 100.5%.
Acceptance criteria
% RSD of peak area of S-Zopiclone standard should not be more than 2.0 %.
Accuracy of assay should be between 98.5-100.5 %.
Limit of Detection and Limit of Quantification
Limit of detection (LOD) is defined as the lowest concentration of analyte that gives a measurable response. LOD is determined based on signal to noise ratio (S/N) of three times typically for HPLC methods. The limit of quantification (LOQ) is defined as the lowest concentration that can be quantified reliably with a specified level of accuracy and precision.
Linearity
Linearity of S-Zopiclone was studied by injecting solutions prepared at five different levels from working standard stock solution as given below.
Preparation of S-Zopiclone working standard stock solution (5000 ppm)
Weighed 500 mg of S-Zopiclone working standard and transferred to 100 ml volumetric flask. Dissolved and diluted up to the mark with diluents, mixed well.
Linearity Level-1
Transferred 2.5 ml of S-Zopiclone working standard stock solution (5000 ppm) into 50 ml volumetric flask and diluted up to the mark with diluents (250 ppm).
Linearity Level-2
Transferred 4.0 ml of S-Zopiclone working standard stock solution (5000 ppm) into 50 ml volumetric flask and diluted up to the mark with diluents (400 ppm).
Table 2 Observation table for Method Precision data (sample)
Sample No.
Wt. of sample (mg) Retentio n time Area Assay (as such basis Assay (on dried basis)
1 50.65 14.96 10979.30 99.42 99.47
2 50.39 14.97 10922.00 99.41 99.46
3 50.51 14.98 10942.20 99.36 99.41
4 50.52 14.97 10945.70 99.37 99.42
5 50.42 14.98 10925.50 99.39 99.44
6 50.63 14.94 10972.90 99.40 99.45
AVG -- 14.97 99.39 99.44
SD -- 0.02 0.02 0.02
%RSD -- 0.10 0.02 0.02
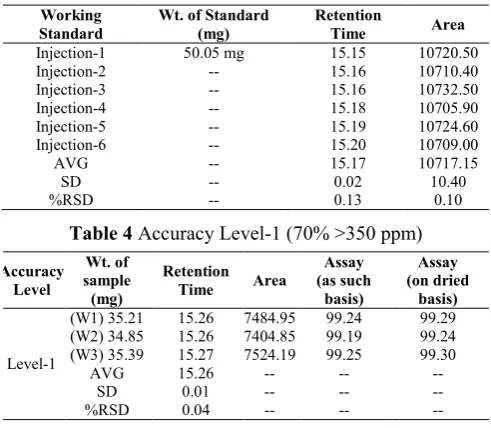
Table 3 Observation: Accuracy data – Standard
Working Standard
Wt. of Standard (mg)
Retention
Time Area
Injection-1 50.05 mg 15.15 10720.50
Injection-2 -- 15.16 10710.40
Injection-3 -- 15.16 10732.50
Injection-4 -- 15.18 10705.90
Injection-5 -- 15.19 10724.60
Injection-6 -- 15.20 10709.00
AVG -- 15.17 10717.15
SD -- 0.02 10.40
%RSD -- 0.13 0.10
Table 4 Accuracy Level-1 (70% >350 ppm)
Accuracy Level Wt. of sample (mg) Retention
Time Area
Assay (as such basis) Assay (on dried basis) Level-1
(W1) 35.21 15.26 7484.95 99.24 99.29
(W2) 34.85 15.26 7404.85 99.19 99.24
(W3) 35.39 15.27 7524.19 99.25 99.30
AVG 15.26 -- -- --
SD 0.01 -- -- --
%RSD 0.04 -- -- --
Table 5 Accuracy Level-2 (100% >500 ppm)
Accuracy Level Wt. of sample (mg) Retention
Time Area
Assay (as such basis) Assay (on dried basis) Level-2
(W1) 50.37 15.25 10711.80 99.28 99.33
(W2)50.00 15.29 10616.20 99.12 99.17
(W3) 50.45 15.29 10726.00 99.25 99.30
AVG 15.28 -- -- --
SD 0.02 -- -- --
%RSD 0.15 -- -- --
Table 6 Accuracy Level-3 (130% >650 ppm)
Accuracy Level Wt. of sample (mg) Retention
Time Area
Assay (as such basis) Assay (on dried basis) Level-3
(W1) 65.98 15.24 14047.90 99.39 99.44
(W2) 65.28 15.23 13866.00 99.16 99.21
(W3) 65.88 15.20 14004.00 99.23 99.28
AVG 15.22 -- -- --
SD 0.02 -- -- --
Linearity Level-3
Transferred 5.0 ml of S-Zopiclone working standard stock solution (5000 ppm) into 50 ml volumetric flask and diluted up to the mark with diluents (500 ppm).
Linearity Level-4
Transferred 6.0 ml of S-Zopiclone working standard stock solution (5000 ppm) into 50 ml volumetric flask and diluted up to the mark with diluents (600 ppm).
Linearity Level-5
Transferred 7.5 ml of S-Zopiclone working standard stock solution (5000 ppm) into 50 ml volumetric flask and diluted up to the mark with diluents (750 ppm). Injected these five levels in three replicates. Calculated % RSD and average peak area of these levels.
Result
Coefficient of correlation (r) is 0.9999
Acceptance criteria
Coefficient of correlation (r) should not be less than 0.99.
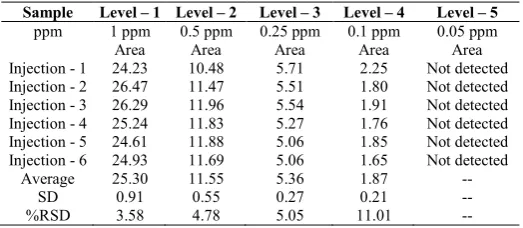
Limit of Detection and Qualification
Estimated the limit of detection by injecting serial dilutions of less than1.0 ppm of S-Zopiclone six replicates and calculated % RSD of S-Zopiclone. Limit of detection would be the lowest concentration of analyte that can be detected which on six replicate injections gives % RSD more than 10.0%. Estimated the limit of quantification by injecting serial dilutions of less than 1.0 ppm of S-Zopiclone six replicates and calculated % RSD of S-Zopiclone.
Observations: LOD/LOQ: S-Zopiclone
Results
Limit of detection for S-Zopiclone is 0.1 ppm and limit of quantification is 0.25 ppm.
Acceptance Criteria
LOD would be the lowest concentration of analyte which can be detected but when % RSD of six replicate injections should be more than 10%. LOQ would be the lowest concentration of analyte which can be quantified but when % RSD of six replicate injections should be less than 10%.
CONCLUSION
The method developed for quantitative determination of S-Zopiclone is rapid, precise, accurate, economic and selective. The method was completely validated showing satisfactory data for all method-validated parameters tested. The developed method is stability indicating and can be used for assessing the stability of Flucytosin as bulk drugs. The developed method can be conveniently used for the assay determination of S-Zopiclone in bulk drugs and pharmaceutical dosage form.
References
1. Luciano R. P. Jr., Lia R. A. B., Erika C. T., Luciano R. B. S. T., Clinics, 2016, 71 (1); 5-9.
2. Blanchard J. C., Julou L., J Neurochem., 1983, 40, 601-7.
3. Skerritt J., Johnston G., European Journal of Pharmacology, 1983, 89 (3-4): 193-8.
4. De D. P., Macdonald R., British Journal of Pharmacology, 1988, 95 (1): 109-20.
5. a) Chaudhari, V., Ubale, M., Pharmacutical and Biomedical Sciences, 2012, 1, 2, 5-12. b) Ubale, M. B., Dhakane, V. D., Chaudhari, V. R., Applied Chemistry, 2011, 41, 5867-5870. c) Dhakane, V. D., Ubale, M. B., Analytical Chemistry an Indian Journal, 2009, 8, 4, 602-607. d) Chaudhari, V., Ubale, M., International Journal of Advanceds in Pharmacy, Biology and Chemistry, 2012, 1, 3, 281-286. d) Ubale, M.B., Bharad, J.V., Chaudhary, V.R., Journal of Current Chemical and Pharmaceutical Science, 2012, 2, 2, 107-112. e) Dhakane, V.D., Ubale, M.B., International Journal of Chromatographic Science, 2012, 2, 3, 13-18. f) Chaudhari, V., Ubale, M., Research journal of Pharmaceutical, Biological and Chemical Science, 2012, 3, 3, 261-270.
6. ICH, Q2 (R1) Validation of Analytical Procedures: Harmonized Tripartie Guideline Text and Methodology Current Step 4 Version.
7. ICH, Q2 (R1) Validation of analytical procedures: International Conference on Harmonization: June. 1994. 8. Indian Pharmacopoeia: Government of India, Ministry of Health and Family Welfare, Vol. 3, Published by the Controller of Publications: Delhi, 1996, pp 25-27. 9. Mistri H.N., Jangid A.G., Pudage A. and Shrivastav P.,
HPLC-ESI-MS/MS, J Chromatogr B Analyt Technol Biomed Life Sci 2008, 137-148
10. Kumar H.K., Vijaya B.D., Jagadeesh B., Ravindranath L. K., Veera K. N. and Venkateswarulu V., Biomedical Chromatography 2011, 26 (2): 225-31.
11. Rao B., Nagendrakumar M.V., Sivanadh A.V.D. and Bramhachari P.V., Journal of Pharmacy Research 2011, 4(1): 248.
12. Souri E, Shirvin A, Shabani R. N., Alvandifar F. and Tehrani M.B., The Open Conference Proceedings Journal 2012, 3:13-17.
Table 4 Observation: Linearity data
Injection No.
Level-1 (250 ppm)
Level-2 (400 ppm)
Level-3 (500 ppm)
Level-4 (600 ppm)
Level-5 (750 ppm)
1 5348.68 8577.94 10910.00 12995.60 16349.40
2 5351.92 8584.21 10896.40 12998.20 16332.30
3 5349.12 8584.01 10916.80 12996.90 16300.10
AVG 5349.91 8582.05 10907.73 12996.90 16327.27
SD 1.76 3.56 10.39 1.30 25.03
%RSD 0.03 0.04 0.10 0.01 0.15
-- -- -- -- Correlation(r) 0.9999
Sample Level – 1 Level – 2 Level – 3 Level – 4 Level – 5
ppm 1 ppm 0.5 ppm 0.25 ppm 0.1 ppm 0.05 ppm
Area Area Area Area Area
Injection - 1 24.23 10.48 5.71 2.25 Not detected
Injection - 2 26.47 11.47 5.51 1.80 Not detected
Injection - 3 26.29 11.96 5.54 1.91 Not detected
Injection - 4 25.24 11.83 5.27 1.76 Not detected
Injection - 5 24.61 11.88 5.06 1.85 Not detected
Injection - 6 24.93 11.69 5.06 1.65 Not detected
Average 25.30 11.55 5.36 1.87 --
SD 0.91 0.55 0.27 0.21 --
13. Lanka A.R.P., Rao J.V.L.N.S., Pamidi S., Vara P.J., Hotha K. K., International Journal of Analytical and Bioanalytical Chemistry, 2012, 2(4): 241-246.
14. Konoz E., Sarrafi A.H.M., Abdolahnejad R. and Zonoz M.B., Journal of Chemistry 2013, 2013:1-6.
15. Eliassen E., Kristoffersen L., Journal of chromatography B, 2014, 971: 72-80.
*******
How to cite this article: