A queuing-theory model of word frequency distributions
Robert Munro University of Sydney
Abstract
This paper describes a novel model for term frequency distributions that is derived from queuing-theory. It is compared with Poisson distributions, in terms of how well the models describe the observed distributions of terms, and it is demonstrated that a model for term frequency distributions based on queue utilisation generally gives a better fit. It is further demonstrated that the ratio of the fit/error between the Poisson and queue utilisation distributions may be used as a good indication of how inter-esting a word is in relation to the topic of the discourse. A number of possible reasons for this are discussed.
1 Introduction
When a given term occurs in a document, what is the probability that it will occur again, and how will this probability change when you have seen , or instances of this term? While NLP is a vast field, the majority of research is devoted to looking for intelligent ways to auto-mate and speed up processes such as grammati-cal and/or semantic parsing, which a human could complete with an equivalent or much higher accu-racy. Where NLP can exceed human accuracy is in extraction of patterns from large scale corpora (Banko and Brill, 2001). Lexical systems, such as term collocations, co-occurrences and frequency distributions, are one such area.
Typically, a word’s occurrence across docu-ments have been assumed to be Poisson in dis-tribution. When this hasn’t worked, a combina-tion of two Poisson mixtures has been attempted with suggestions that when this fails combina-tions of three or more are appropriate (Bookstein and Swanson, 1974; Church and Gale, 1995).
1.1 Contribution of this paper
It is demonstrated here that the distribution of a queue utilisation (QU) is a more accurate repre-sentation for word frequency distributions than a Poisson distribution. A Poisson distribution cap-tures the ‘burstiness’ of the frequency of a given word, otherwise known as the clustered-ness or self-collocation of a word. Here, it is shown that while the underlying assumption of bursti-ness holds, there are better representations for capturing this.
While it has previously been observed that words that best singularly describe the topic (var-iously labeled the ‘interest words’ or ‘content words’ of a discourse) are the words that least obey a Poisson distribution (Church, 2000), this has typically been used only as an observed trend, and without the search for what method best fits modelling this other distribution (if any).
The significance of the relationship between the fits of a Poisson and QU distribution is ex-plored, and it is demonstrated that the level of dis-parity between the fits of Poisson and QU distri-butions can be used to extract words that best sin-gularly describe participants in news topics with a very high level of accuracy.
in using such a method on a large corpus of newswires, and discusses the results in relation to this register.
1.2 Outline
Section 2: background and related work.
Section 3: definitions of the equations use here.
Section 4: testing framework.
Section 5: results of testing.
Section 6: discussion & conclusions.
2 Background and Related Work
In terms of an attempt to describe the reasons for variance in the repetition of certain terms, the most recent work in this area is (Church, 2000) who defined the increased probability of a word occurring once it has already been seen ‘posi-tive adaptation’. It was the observation of the distributions described in this paper, along with the common trend of burstiness in network com-munications, that provoked the exploration of a queuing-theory model of word frequency distri-butions. There, and in (Church and Gale, 1995) the departure from a Poisson distribution were de-scribed as the result of ‘hidden variables’ relating to variation in register and author.
Word frequency distributions have been ex-ploited in almost all tasks in computational lin-guistics and NLP, from subject boundary detec-tion (Richmond et al., 1997), to informadetec-tion ex-traction/retrieval (Lynam et al., 2001; Pirkola et al., 2002; Jones et al., 2000).
The author’s not aware of any previous word frequency distribution research using queuing theory models. Most previous research has used models based on information theory, presumably because it was to be used for information ex-traction/retrieval. Nonetheless, the corpus used here are newswires, so in the spirit of McLuhan, a model is investigated that is derived from the medium of communication.
3 Equations for probabilistic distributions
The goal of matching a word frequency distri-bution to a statistical equation is to find the op-timal parameter value(s) for that equation, such
that it fits the observed distribution with as little error as possible. There are different metrics and methodologies for calculating goodness of fit, in-cluding entropy measures, least squared regres-sion and the practical effectiveness of the infor-mation when applied to some NLP task. Here, the chi-squared (
) test is the metric used. This was appropriate for two reasons. It was the measure minimised by the optimisation algorithm (see be-low), and it is insensitive to error on the axis, which is desirable as this represents an ordinal distribution and it is chiefly the divergence from the expected probability that is of interest.
3.1 Equations Used
These are the four equations that were tested here: The Poisson distribution ():
(1)
The Double Poisson distribution (
The Double Queue Utilisation (#
A weighted combination of a QU and Pois-son distributions was also considered. It is desir-able as only a Poisson distribution initially allows $%
(for values of '&
). Some brief testing confirmed it gave accurate fits, but it is not included in the testing and analysis here as: 1. It is difficult to find a theoretical justification for combining the two in this manner. If the only advantage is that a Poisson distribution
allows($)
2. For an accurate comparison with the combi-nations of a single distribution type, it would be necessary to calculate the extent of over-fitting that occurs, increasing and complicat-ing the work described here.
3.2 Poisson
A Poisson distribution is often used to model sys-tems where the probability of an observation is very low, but the possibility of an observation is very high.
In information retrieval, a double Poisson dis-tribution is often favoured (Robertson and Walker, 1994). It is simply the weighted combination of two Poisson distributions.
Even with the additional parameters of the sec-ond
and the weighting factor, a double Poisson distribution still fails to accurately capture word frequency distributions, but extending the equa-tions to the combination of three or more Poisson mixtures will have the additional problem of the extra parameters to optimise. The most obvious disadvantage of this, other than the computational expense, is the potential for the resultant curve to overfit the data.
Church and Gale addresses this by suggesting Poisson mixtures (Church and Gale, 1995), which are an arbitrary number of Poisson distributions, allowing multiple values for
, but varying ac-cording to a single density function, and therefore only adding one extra parameter. The assumption maintained here is that the underlying distribution
is Poisson in nature, which is later noted as
prob-lematic (Church, 2000).
3.3 Utilisation Queue
In queuing-theory, a utilisation queue is an equa-tion representing the probability of some queue having a given number of entities ‘waiting’ in it.
A queuing system is often described by the general M/G/1 model. Where:
!
= The occupancy
= the average service rate
= the variance of the service time
=
The system is expressed by:
!
! (5)
Any queue may be described in terms of this equation, such as people waiting in line to buy tickets at a movie cinema, or the traffic on a com-puter network. The second of these, and its most common usage, is interesting in this context as it also represents a form of communication, albeit one a little more abstracted.
Within this, the model is often specialised to the M/M/1 model. It makes two assumptions about the data: both the queue arrival rate and the service rate are Poisson. Its relationship to a Pois-son distribution is actually a little more involved, but the description of this is outside the scope of this paper and not directly relevant. This is given by:
!
"
!
(6)
The equation used here, the Queue Utilisation (# ) model, is an equation describing the probability that an M/M/1 system has items in it at a given point in time.
There are several immediate aspects of the equation that are appealing:
1. Simplicity. By Occam’s Razor, if this were to model as accurately as a more compli-cated equation, then it would be the more de-sirable choice.
2. Extensibility. As there already exist, within queuing theory, extensions to the given equa-tions to deal with various phenomena relat-ing to density and limitations on queue size, these might be applied to the given situation.
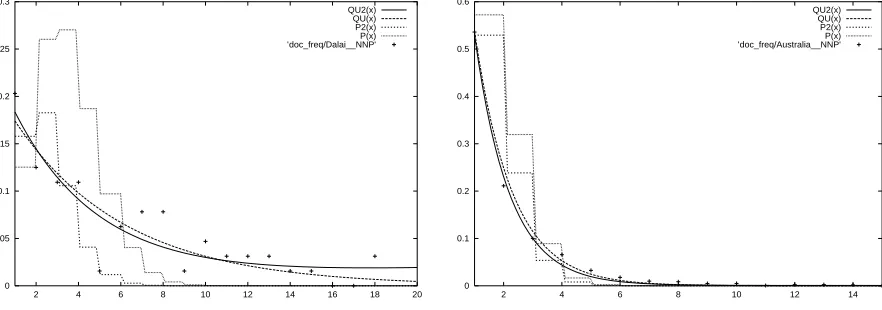
3. Slower tail-off than Poisson. For large val-ues of , the tail-off is slower than for Poi-son, explicitly capturing the phenomena de-scribed both in, and by the title of, (Church, 2000).
A related equation called M/D/1 was tested but results indicated it was not appropriate for this task, but other variations of M/G/1 may have de-sirable properties.
0 0.05 0.1 0.15 0.2 0.25 0.3
2 4 6 8 10 12 14 16 18 20 QU2(x)
QU(x) P2(x) P(x) ’doc_freq/Dalai__NNP’
Figure 1: Fits for the term ‘Dalai’
0 0.05 0.1 0.15 0.2 0.25 0.3
10 20 30 40 50 60
QU(x) P(x) ’doc_freq/the__DT’
Figure 2: Fits for the term ‘the’
0 0.02 0.04 0.06 0.08 0.1 0.12 0.14 0.16
2 4 6 8 10 12 14 16 18 20 QU(x)
P2(x) ’doc_freq/Kabul__NNP’
Figure 3: Fits for the term ‘Kabul’
0 0.1 0.2 0.3 0.4 0.5 0.6
2 4 6 8 10 12 14
QU2(x) QU(x) P2(x) P(x) ’doc_freq/Australia__NNP’
Figure 4: Fits for the term ‘Australia’
0 0.01 0.02 0.03 0.04 0.05 0.06
2 4 6 8 10 12 14 16 18 20 QU2(x)
P2(x) ’term_freq/Iraq__NNP’
Figure 5: Fits for the term ‘Iraq’
0 0.02 0.04 0.06 0.08 0.1 0.12 0.14 0.16 0.18 0.2
2 4 6 8 10 12 14 16 18 20 QU2(x)
QU(x) P2(x) P(x) ’doc_freq/Kashmir__NNP’
4 Testing Framework
4.1 Corpus
The corpus used was a set of 50,000 Reuters newswires from the year 1996. This constituted approximately 15 million words. Newswires make an interesting register for this sort of anal-ysis as each article typically addresses only one main topic or event, which is probably a better delimiter than using the raw number of words or sentences.
The words were marked up for part-of-speech by the brill-tagger (Brill, 1992). The terms con-sidered were the word/POS pairs, so that a rough division between uses occurred. After some con-sideration, it was decided that the words should
not be stemmed or lemmatised - either the
distri-butions of all cases/tenses of a word are similar, or there are differences which may themselves be interesting to investigate.
To reduce noise, words that occurred with a fre-quency of less then 100 were omitted. Words that never occurred in a document with a frequency of 4 or greater were also omitted, as the differing curves of the equations used would not be emer-gent.
This resulted in 4935 word/POS tokens. The total number and frequencies of the occurrences of each of these were collated across all docu-ments.
The recorded distributions were then nor-malised to be tested in two ways:
1. document frequency. All document frequen-cies were divided by the total number of doc-uments containing the given frequency of the word. This is a ‘true’ normalisation, in the sense that the exact distributions are main-tained.
2. term frequency. All document frequencies were divided by the total number instances of the term occurring with the given fre-quency. This will make the tokens with a relatively high level of self-collocation (pos-itive adaptation) more emergent, relative to the document frequency, and is similar to the measure common to information extraction/retrieval and document classifica-tion.
POS doc freq term freq
noun 95.9% 99.9%
prop n. 93.5% 99.8%
verb 90.5% 100.0%
adj 91.8% 100.0%
adverb 90.9% 100.0%
all 94.3% 99.9%
Table 1: Percent of terms for which# was a better fit than
POS doc freq term freq
noun 94.9% 94.6%
prop n. 91.6% 90.9%
verb 90.5% 89.9%
adj 89.6% 89.0%
adverb 89.8% 87.5%
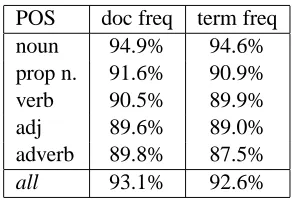
all 93.1% 92.6%
Table 2: Percent of terms for which#
was
a better fit than
4.2 Best Fits
The optimal models were found using gnuplot (Williams and Kelley, 1991), which implements the Marquardt-Levenberg algorithm for parame-ter optimisation (Press et al., 1992) . The equa-tions were prevented from allowing
$ or
!
$ , as this would give negative probabilities not appropriate here.
The success of the fits were gauged by the final sum of squares of residuals or the
result on the same term across the different equations.
Once set up, the entire process, from the single scan of the corpus, to the fitting of the equations, took only a couple of minutes to run on a current PC, the majority of this being the time taken for the ‘double’ distributions to converge.
5 Results
Results are reported for the relative success of the different distributions, given by the percentage of terms for which a given equation has a lower
. These are given as totals and for the divisions into noun, proper noun, verb adjective and adverb parts-of-speech.
POS doc freq term freq
noun 68.7% 0.8%
prop n. 60.0% 1.5%
verb 60.1% 1.9%
adj 64.0% 0.8%
adverb 61.2% 1.1%
all 64.9% 1.1%
Table 3: Percent of terms for which # was a better fit than
Comparisons were made between the fits of all Poisson / queue utilisation combinations. There were no significant results for which the single Poisson was more accurate than a double QU. The other results are given in Tables 1, 2 and 3.
The results demonstrate clearly that a queue utilisation model of word frequency distributions is a more appropriate representation for modelling term frequencies. The most impressive results are in Table 3, showing that even a single QU, with only one free variable, can provide a more accu-rate representation of the data than a double Pois-son, which has two free variables plus the weight-ing factor.
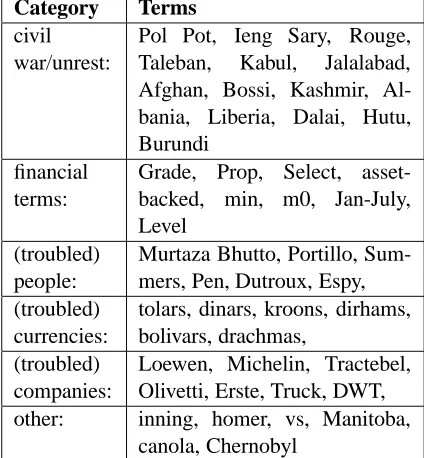
A cursory glance at the accuracies in Table 3 would seem to indicate that modelling term fre-quency is less desirable than word frefre-quency, de-spite the Table 1 accuracies being significantly better. However, looking at the best represented words by each, given by the largest ratio of a QU to a Poisson distribution shows the opposite. The top 1% of words for which was a better fit than
for term frequency is given in Ta-ble 4 (my groupings). These distributions are not emergent for the top 1% of words for document frequency, given in Table 5.
The trend for the term frequency distribution continued, with the next 1% of containing terms such as Ansett, Chechnya, Iraq, Mother Theresa,
Pope, Tibet and Tyson, the one outlier being the
determiner the. By contrast, the bottom 0.5% of terms, given in Table 6, are relatively mild and not particularly indicative of what the topics may be.
The ordering of terms for which a single # was a better fit than a single Poisson cor-responded well to the ordering of terms for the double Poisson, with the majority of terms in the
Category Terms civil
war/unrest:
Pol Pot, Ieng Sary, Rouge, Taleban, Kabul, Jalalabad, Afghan, Bossi, Kashmir, Al-bania, Liberia, Dalai, Hutu, Burundi
financial terms:
Grade, Prop, Select, asset-backed, min, m0, Jan-July, Level
(troubled) people:
Murtaza Bhutto, Portillo, Sum-mers, Pen, Dutroux, Espy, (troubled)
currencies:
tolars, dinars, kroons, dirhams, bolivars, drachmas,
(troubled) companies:
Loewen, Michelin, Tractebel, Olivetti, Erste, Truck, DWT, other: inning, homer, vs, Manitoba,
canola, Chernobyl
Table 4: Terms for which the# gave the best fit, as compared to
for term frequency
top 1% also appearing in Table 4. Those that aren’t in Table 4 are thematically related and in-clude Harridine, Holbrooke, Izetbegovic, rupiah,
Srinagar and Zavgayev.
Similarly, the other document frequency ratios gave orderings of ratios as relatively uninteresting as the set of words in Table 5.
Although the # ’s best described terms were proper nouns and nouns, and the worst more of a mix of adverbs and verbs, the various parts-of-speech were represented about equally as well as each other. A minor exception can be seen in Ta-bles 2 and 3 where the double Poisson was a little less able to improve the representation of some nouns.
In brief, while a document frequency model more accurately described the distribution of terms, a term frequency model would seem to be much more useful for comparing with Poisson to extract topics from a very large volumes of infor-mation.
6 Discussion and Conclusion
colloca-from, which, with, it, an, then, spokesman, was, to, in, and, of, a, by, the, seek, not, but, for, bullish, discounts, before, we, trader, added, at, day, will, as, casualties, been, up, because, durum, cruise, futures, its, on, be-tween, sharply, firmer, be, after, hand, this, have, wheat, while, nation, now
Table 5: Terms for which the gave the best fit, as compared to
for document frequency Nigerian, believed, strength, steady, beyond, treasury, none, midday, critics, relatively, ap-proved, thought, began, begin, making, de-layed, expect, getting, accept, finished, pos-sibly, failed, mainly, once, recently
Table 6: Terms for which the gave the worst fit, as compared to
for term fre-quency
tions of first name or title. This means that the terms in Table 4 are also among the least poly-semous, and therefore the most pure in their dis-tributions in this regard. The same can be said for the demonstrative the, also an explicit refer-ent although typically as an anaphoric reference in written text.
The ‘financial’ words in Table 4 can be ex-plained simply in terms of their being generic eco-nomic terms that are commonly tabulated or used in lists. They are not discussed further.
It is telling that in the top 1% of best repre-sented terms, all the named entities are of persons, places or organisations involved in some sort of conflict. As a topic extraction task this is quite an achievement, but to a certain extent it can also be seen as a product of the register.
Assuming a word is a good indication of topic, there are two broad reasons that the word may also exhibit high ‘adaptation’:
1. The nature of the subject matter is complex, requiring a longer article and the introduc-tion of more themes/participants.
2. The word represents one of multiple partici-pants, and the explicit repetition of the word is chosen instead of the use of anaphora, in order to maintain cohesion.
A third reason, that is worth speculating about but is hard to confirm in a study necessarily ab-stracted from the text itself by scale, is that the phenomenon is capturing an underlying subjec-tivity. In news reporting, the use of narratives of conflict are not limited to articles describing mil-itary conflicts, often being used in sports report-ing. Here, only the terms inning and homer evi-dence this. This may simply be because sports re-porting is known to favour the continuity of Sub-ject, and therefore is able to make more use of anaphora, while maintaining Subject in the re-porting of a military conflict is more likely to be viewed as Subjectivity and is therefore avoided, at least grammatically. But perhaps there is some-thing about a term like Taleban militia, which, in-dependent of context, makes a news reporter de-sire to repeat it more than a term like St Louis
Cardinals, and that this is, in part, a measure of
attitude.
Relating to the first reason above, in the report-ing of conflict, the explicit attributreport-ing of actions and possessions to entities is common, and so rep-etition will not just be as group/phrase heads but as possessives, Burundi’s army, and Classifiers,
Burundi radio.
While these properties will not always hold, it is the emergence of these patterns over large scales that gives these words greater positive adaptation. Even if the results indicated by Ta-ble 4 are mostly a product of the lack of anaphora and ellipses, rather than their ‘content’ or news-worthiness, they are still quite an accurate set of terms for describing topic for any technique that
doesn’t look at grammatical systems.
A brief manual inspection of the terms that occur with a total frequency greater than 100, but never with a document frequency of four or greater (there were about 1700 additional words meeting this criteria) showed that, beneath the noise, these were disproportionately likely to be Epithets, realised by either an adjective or a gerund. This is not surprising, as when a term is functioning as the property or evaluation of an entity, not part of the entity itself, there is rarely the need to remind the reader/listener of this prop-erty/evaluation in a short discourse. An additional experiment with words occurring with a maxi-mum document frequency of three was also con-ducted, giving a further small advantage in overall fit to the distribution, but no significant addi-tions to the word lists already given.
The term Noriega (Church, 2000) appeared with frequency less than 100, and was therefore omitted from the experiments. This shows the other known ‘burstiness’ property of term fre-quencies, that they are also temporal. The ar-ticles used here were deliberately taken from a small window of time to negate this, but it would be interesting to see if the same model could be used for modeling temporal distributions inde-pendently of, or in addition to, the frequency dis-tributions.
As conflict discourses feature multiple partic-ipants, the investigation of co-occurrence would be interesting, as too would be the investigation of collocations/n-grams.
For the most part, the part-of-speech tags alone would have been enough to cluster the various words into the groupings given in Table 4, but with information about the words, such as the er-ror and discovered optimal !
, it would be inter-esting to see what additional tendencies could be discovered and/or exploited in a variety of NLP tasks.
Acknowledgements
Thankyou to the ongoing support of my supervi-sors, Geoff Williams and Sanjay Chawla.
References
M. Banko and E. Brill. 2001. Scaling to very very large corpora for natural language disambiguation.
In Meeting of the Association for Computational Linguistics.
A. Bookstein and D. Swanson. 1974. Proba-bilistic models for automatic indexing. Journal of the American Society for Information Science, 25(5):312–318.
E. Brill. 1992. A simple rule-based part-of-speech tagger. In Proceedings of ANLP-92, 3rd Confer-ence on Applied Natural Language Processing.
K. Church and W. Gale. 1995. Poisson mixtures. Nat-ural Language Engineering, 1(2):163–190.
K. W. Church. 2000. Empirical estimates of adap-tation: The chance of two Noriegas is closer to
than
. In Proceedings of The 18th Inter-national Conference on Computational Linguistics (COLING-2001).
K. S. Jones, S. Walker, and S. E. Robertson. 2000. A probabilistic model of information retrieval: devel-opment and comparative experiments - part 2. In-formation Processing and Management, 36(6):809– 840.
T. R. Lynam, C. L. A. Clarke, and G. V. Cormack. 2001. Information extraction with term frequen-cies. In Proceedings of the Human Language Tech-nology Conference (HTL’01).
A. Pirkola, E. Lepp¨anen, and K. J¨arvelin. 2002. The RATF formula (Kwok’s formula): exploiting aver-age term frequency in cross-languaver-age retrieval. In-formation Research, 7(2).
W. H. Press, S. A. Teukolsky, W. T. Vetterling, and B. P. Flannery. 1992. Numerical Recipes in C. Cambridge University Press, 2 edition.
K. Richmond, A. Smith, and E. Amitay. 1997. De-tecting subject boundaries within text: A language independent statistical approach. In Claire Cardie and Ralph Weischedel, editors, Proceedings of the Second Conference on Empirical Methods in Natu-ral Language Processing.
S. E. Robertson and S. Walker. 1994. Some simple effective approximations to the 2-Poisson model for probabilistic weighted retrieval. In Proceedings of the 17th annual international ACM SIGIR confer-ence on Research and development in information retrieval.