DIGITAL AMPLITUDE CONTROL FOR INTERFER-ENCE SUPPRESSION USING IMMUNITY GENETIC AL-GORITHM
Z. Hamici
Computer Engineering Department Al-Ahliyya Amman University Jordan
T. H. Ismail
Communication Engineering Department Al-Ahliyya Amman University
Jordan
Abstract—In this paper, we propose a novel genetic algorithm (GA) called immunity GA (IGA) for array pattern synthesis with interference suppression using digital amplitude only control. The IGA is based on crossover evolution where the crossover operator is a variant of the known GA operator. A new formulation of the array factor transform for a specific number of elementsNis expressed by a discrete cosine transform (DCT) with pre-computed DCT matrix. Evaluating thousands of candidate solutions generated by the IGA using the precomputed DCT matrix will result in a high speed computation. This high performance allows us to find a good approximation of the absolute minimum SLL of synthesized arrays with digital amplitude control. Simulation results show the effectiveness of this new algorithm for pattern synthesis with low SLL and null steering.
1. INTRODUCTION
Antenna-based signal processing that suppress the interfering signals from prescribed directions while receiving the desired signal from a chosen look direction are still a challenging problem to date [1–4]. Through array antenna signal processing algorithms, sidelobe jammers can be attenuated by modifying some of the array-element amplitude
weights to cause deep pattern nulls in the jamming or interfering signal direction. The determination of the appropriate set of amplitudes is the main role of the anti-jam signal processing algorithms. These amplitudes (weights) must be determined adaptively, since a jammer may move from one part of the sidelobe region to another, and therefore the amplitudes must be readapted. The cost of carrying out the amplitude-adaptation algorithm depends sensitively on the number of amplitudes being determined. The computational cost is proportional to the number of elements and thereby the computation time depends on the number of multiplications and additions. Reducing these later is very critical and hence a good algorithm should be based on fast computation technique to allow instant interference suppression. Since large antenna size is needed to obtain narrow main beam width, it requires a cumbersome procedure to calculate the current excitations which will be very sensitive to the relative errors.
a binary-coded GA are jointly applied to the minimization of SLL problem in planar arrays [13]. The most prominent advantage of DE is its low computation time compared to that of GA, particularly in large antenna arrays. Also, recently, pattern synthesis with minimum SLL and null control based on particle swarm optimization (PSO) was presented [2, 3]. Moreover, a bacterial foraging algorithm (BFA) for null steering of linear antenna arrays by controlling only the element amplitudes was proposed [4].
In this paper, a novel Immunity Genetic Algorithm based on stochastic crossover evolution is introduced to find an optimal set of active array elements by turning off some elements of a uniformly spaced array to produce low side lobes with null steering. Our crossover operator based on the swapping of two-points selected on the parent unduplicated chromosome (DNA) is a variant of the known GA crossover operator. These chromosomes are spread all over the solution space. Furthermore, a new expression of the array factor is presented based on precomputed array factor transform matrix. The array factor is remodeled in a form similar to the Discrete Cosine Transform (DCT). The array factor for a specific number of elementsN is expressed based on a precomputed DCT matrix and a linear transform is used to achieve a high speed computation of the array factor. The new expression of the array factor achieves a high speed up factor which allow us to push the search process to new borders in stochastic search for optimum solutions. Determining the side lobe level accurately is based on finding the nulls of the first lobe; the deactivation process of some elements of the array causes the nulls to move, to resolve this problem a technique for dynamically finding the exact position of the antenna main beam is presented. With 20% deactivated elements our algorithm achieves a side lobe level of about −20 dB and −23 dB SLL for 100 and 200 elements, respectively, which agree with the fact that relative, mean SLL is 1/N. The effectiveness of our technique is also demonstrated with null control while minimizing the SLL of the array pattern. The results show that the null steering with optimum SLL using the digital amplitude control of array elements is very efficient.
2. DIGITAL AMPLITUDE CONTROL USING IGA ALGORITHM
flexibility antennas. Elements at the center of the array play an important role on the SLL, and hence they are kept turned on (active) as shown in Figure 1 (indicated as array core). With Centro-symmetric array configuration, the array factor is given by
AF(θ) = 2
N
X
n=1
an cos[n k d sin(θ)] (1)
where, an represent nth amplitude weights of array elements with
(an= 0 if the element is disabled andan= 1 if the element is enabled
or active),drepresent the interelement spacing, andθrepresents angle from broadside.
Figure 1 shows that the elements with white color are turned on (active elements) and are indicated by the bit 1, and black elements are disabled or nonacive elements and are indicated by the bit 0. The digital amplitude control sequence of the array is considered to be the chromosome of the genetic algorithm.
In genetic algorithms (GA), crossover is a genetic operator used to vary the programming of a chromosome or chromosomes from one generation to the next. It is analogous to reproduction and biological crossover, upon which genetic algorithms are based. Many crossover techniques exist for organisms which use different data structures. Our crossover algorithm is a variant of these algorithms, based on the swapping of two-points which are selected on the parent unduplicated chromosome; these two genes (bits) are swapped to produce a child unduplicated chromosome (evolution). It is similar to a DNA immunization process through generations against chronic viruses. The swapping is based on the generation of two random variables.
In this work, the digital amplitude sequence of the array is similar to a chromosome, where the immunity to diseases evolves from parent
Figure 1. Centro-symmetric an-tenna array and the correspond-ing digital amplitude control se-quence.
to child by crossover evolution, hence the name immunity GA (IGA). In order to find how this chromosome will evolve from generation to generation by changing a part of its genes (bits), we tried to generate large number of the chromosomes and then searching for the best one in term of acquired immunity (SLL). The core of the chromosome (Array core) which contains the main genetic properties is not affected through generations, and it is estimated to be 40% of the number of genes (bits), the rest of the chromosome genes are changed by evolution except the last element. This evolution from parent to child is performed by swapping individual bits in the chromosome (digital amplitude sequence). The selection of bits to be swapped (crossed over) is based on a stochastic process controlled by two variables. The immunity of the chromosome to viruses, which represents the SLL of the array pattern, is measured and the best chromosome with high immunity is kept (array factor with lowest side lobe level).
Consequently, our IGA algorithm is given by the following steps:
Algorithm
1- Initialization; the array size (2N), the number of generated chromosomes (K) of length N, the evolutions index (I), the dynamic thinning range [Lmin+1,N−1] (Lminrepresents the index of the last element of the array core), dynamic thinning efficiency (Theff) (the element deactivation ratio), and initial DNA given by aN.
2- Generate two random indexes N1, N2 within dynamic thinning area.
3- Crossover the two bits (genes) indexed byN1 and N2: aN(N1) = aN(N2) andaN(N2) =aN(N1)
4- Add this new unduplicated chromosome evolution (digital amplitude sequence) to the IGA population.
5- Increment indexI.
6- IfI < K GOTO step 2 else GOTO step 7. 7- Save the IGA population and exit.
TheKevolutions, generated stochastically, are spread all over the total number of possible evolutions given by
CN−Lmin−1
J =
(N−Lmin−1)!
(N −J −Lmin−1)!.J! (2) whereJ is the number of active elements in the dynamic thinning area given by
When the number of active elements, J, is variable, then the total number of all possible chromosomes will be 2(N−Lmin−1). For N = 50
(actual array size is 2N) and Lmin = 19 this means that for a deactivation ratio of 40% there will be 30,045,015 possible evolutions. The K evolutions generated by the stochastic crossover although are very limited compared to the whole evolutions space; they are spread on all possible evolutions values and not concentrated in a limited area. This is a type of spread spectrum evolution where the search for lowest SLL is performed with fixed deactivation ratio. The evolution from parent to child is illustrated by Figure 2.
Each evolution by the IGA is stored for later analysis. The core of the chromosome is not affected by the evolutions. In genetic organism, this means that the global characteristics inheritations are conserved from parent to child through generations. Figure 3 shows the similarity between a biological chromosome (single molecule of DNA) and the digital amplitude sequence. The evolutions of genes in the biological chromosome are similar to the evolutions of bits in the digital amplitude sequence. The bit is 1 (white) when the array element is active and is 0 (black) when the element is deactivated.
After generating thousands of possible chromosomes, a sample of evolutions is shown in Figure 4, where the array core representing the unchanged genes (bits) is in the middle. Each row represents a possible solution with white pixels denote active elements and black
Figure 3. Similarity between biological unduplicated chromo-some (DNA) and digital ampli-tude control sequence.
pixels denote disabled elements. A sample of evolutions is represented by an image which is the top view of the IGA population matrix. The process of generating the array digital amplitude sequence and measuring their SLL in order to increase their rejection to interferences is similar to a DNA immunization process against chronic viruses.
The array core of the chromosomes do not change, the chromosome evolution from parent to child is performed by a 2 bits crossover until a desired SLL is obtained. All identical chromosomes are removed (Hamming distanced= 0). Experiments show that about 50% of the chromosomes are repeated. As the population of possible solutions is large, a fast computation technique is needed to evaluate the SLL of all chromosomes.
3. DIRECT ARRAY FACTOR TRANSFORM
The array factor expression given, by Equation (1) is similar to the discrete cosine transform (DCT), therefore, it can be written as linear transformation using matrix representation. With M the number of evaluation points of the array factor and N is half the array elements. The array factor expression for the Centro-symmetric array of Equation (1) is rewritten as
AF(θ1) AF(θ2) .. .
AF(θM)
= 2
W(1, θ1) W(2, θ1) · · · W(N, θ1) W(1, θ2) W(2, θ2) · · · W(N, θ2) ..
. ... . .. ...
W(1, θM) W(2, θM) · · · W(N, θM)
. a(1) a(2) .. . a(N) (4)
where W(n, θ) = cos(kd nsin(θ)). The above expression is called Direct Array Factor Transform (DAFT) and can be rewritten as
AFM =W(n,θ).aN (5)
where,aN is the amplitude weight vector of theN elements andW(n,θ) is the array factor transform (AFT) matrix of size (M, N) expressed by a non square matrix which has for consequence the inability to find its inverse using a linear transformation. Hopefully, the synthesis of antennas for relatively small size can be done with acceptable computation.
Since the AFT matrix does not depend on the array amplitude coefficients (aN), it can be precomputed to speed up the Transform
using real values. This has a great effect on the computation speed since multiplications and additions are real. The DAFT is applied to a set of chromosomes generated by the IGA algorithm. After a set of thousands of chromosomes is generated, a search is performed within the array factor to satisfy given minimum SLL.
4. SIDE LOBE LEVEL ESTIMATION
When the Array Factor Transform is computed for all chromosomes generated by the IGA, a calculation of the SLL is performed on each array factor. This step is very critical because it is the key feature of a chromosome selection. In order to exactly measure the SLL an accurate estimation of the first lobe is needed. The nulls cannot be estimated correctly from analytical solution because the deactivation of some elements moves these nulls. Hence a good estimation is based on a good numerical method. To achieve this goal we considered the edges of the first lobe as an image processing edge detection problem and used the zero-crossing method to estimate their positions. The first derivative of the Array Factor normalized magnitude is computed. Figure 5, shows the array factor and its derivative where the dashed lines show that the main beam is located exactly at the zero crossing of the array factor derivative.
-20 -15 -10 -5 0 5 10 15 20
-120 -100 -80 -60 -40 -20
-20 -15 -10 -5 0 5 10 15 20
-1 -0.5 0 0.5 1
5. RESULTS AND DISCUSSION
The new digital amplitude controlled array method that utilizes the proposed IGA algorithm is demonstrated by many computer simulation examples in order to suppress interference signals while minimizing the SLL. The simulation is performed in three steps: 1) Generate an AFT matrix for a given number of array elements and store it for later usage, 2) generate thousands of unduplicated chromosomes (digital amplitude sequences). 3) Finally compute the SLL for all chromosomes population and select the best chromosome which gives the lowest SLL. The computing was achieved on a dual core 2 computer running at 1.8 GHz equipped with 2 GB of RAM. When generating a population of 300 thousands chromosomes about 50% of them are repeated, this is due to the fact that the probability to generate two numbersA andB is quasi the same as generatingB and A in a large trials. The swapping of genes (bits) in the two cases will produce the same unduplicated chromosome. This also agrees with the fact that genetic chromosomes are also duplicated. After generating a given population a process of filtering duplicated chromosomes (equal bit patterns) is done and only the filtered population is stored for later analysis using DAFT.
The memory required by the DAFT analysis of the filtered population of chromosomes is given by:
Memory Size =PFM C+PFN C =PFC [M+N] (6)
wherePF is the filtered or unduplicated chromosomes,Mis the number
of points estimated in the range−90◦ to 90◦,C is the number of bytes
reserved for each value; N is half the number of array elements. The first term of equation (6) is the memory size of the array factor for all chromosomes and the second term is the memory size of the population. Using (6), a memory of 0.95 GB is required when PF equal to 145
5.1. Synthesis with Minimum SLL
To verify the validity of the proposed IGA algorithm, simulations were done on 100 and 200 equispaced cento-symmetric linear array elements
0 1 2 3 4 5 6 7 8 9 10 x 104 -20
-18 -16 -14 -12 -10 -8
stochastic GA iterations
S
L
L
d
B
Figure 6. SLL versus IGA evolution index for an array of 100 elements (N = 50), 30% elements are deactivated, and about 100 thousands chromosomes population size.
-80 -60 -40 -20 0 20 40 60 80 -50
-45 -40 -35 -30 -25 -20 -15 -10 -5 0
Arrival/Departure angle (degree)
N
o
rm
.
A
rr
a
y
f
a
c
to
r
d
B
Figure 7. Array factor for the best digital amplitude sequence given in row one of Table 1, 2N = 100, only 70 elements are active. The SLL is−19 dB.
Table 1. Best unduplicated chromosomes (digital amplitude sequence) and the corresponding SLL for different deactivation ratio (dynamic thinning percentage),Theff, with 100 elements (N = 50).
Fig. Array digital amplitude control sequence with the lowest SLL Theff% Pop. υ10 3
SLL (dB)
7 11111111111111111111101111111001111000000001010001 19.0
9 11111111111111111111111111110110011101000011101011 20 91 20.24 ×
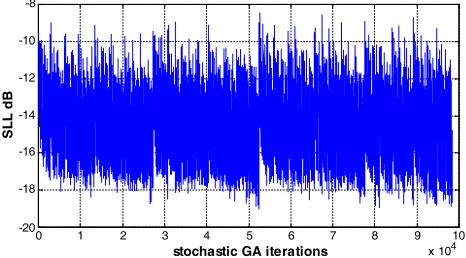
0 1 2 3 4 5 6 7 8 9 10 x 104 -22
-20 -18 -16 -14 -12 -10
Stochastic GA iterations
S
L
L
d
B
Figure 8. SLL versus IGA evolution index for an array of 100 elements (N = 50), 20% elements are deactivated, and 91 thousands chromosomes population size.
-80 -60 -40 -20 0 20 40 60 80 -50
-40 -30 -20 -10 0
Arrival/Departure angle (degree)
N
o
rm
.
A
rr
a
y
f
a
c
to
r
d
B
Figure 9. Array factor for best digital amplitude sequence given in row two of Table 1, 2N = 100, only 80 elements are active. The SLL is−20.24 dB.
of a half wave interelement spacing for different deactivation ratios. In the following examples, different cases with different deactivation ratios are presented. Figure 6 shows the SLL of a population of about 100 thousands chromosomes for a 30% of deactivated elements. The lowest SLL is−19 dB as shown in Figure 7. The corresponding unduplicated chromosome is given in row one of Table 1. The lowest SLL of 20.24 dB is achieved for a population of 91 thousands chromosomes for 20% of deactivated elements as shown in Figure 8.
Table 2. Different chromosomes that yield almost same SLL. (a) 2N = 100 elements, (b) 2N = 200 elements.
Trial Digital amplitude sequence (100 elements Array, 80 are active) SLL(dB) 1 11111111111111111111111111110110011101000011101011 20.24 2 11111111111111111111111111111010110001110100011011 20.0 3 11111111111111111111111011101111010110010100011111 20.0
(a)
Trial Digital amplitude sequence (200 elements Array, 160 are active) SLL(dB)
1
1111111111111111111111111111111111111111111110111111
101111100110110110010100110001000101101111000011 22.2
2
1111111111111111111111111111111111111111011111110101
001111111011111000110100111001010001111011001101 22.4
3
1111111111111111111111111111111111111110111101111101
111011011110010111011001010101111110000010110011 22.1
(b)
−
−
−
−
−
−
Table 3. SLL versus elements deactivation percentage for an array of 100 elements.
deactivation ratio (%) SLL (dB) Gain (dB)
16 −19.2 38.5
20 −20.0 38.0
22 −20.25 37.8
24 −19.8 37.6
26 −19.4 37.4
30 −19.0 37.0
40 −18.0 35.5
46 −17.0 35.0
which controls the total length of the array. Also, it was observed that the deactivation ratio with the lowest SLL is attained at 22% as given by Table 3. To confirm this observation we tried to study small array with size less than 28 elements. For these arrays, we first excluded the core from the amplitude control process, then we generated all possible chromsomes. While for array sizes greater the 28 elements we managed to concentrate the search within the last 17 elements. Table 4 shows that the best deactivation ratio increases for small arrays and settles at aproximately 22%, where SLLR is the real SLL searched within
all possible chromsomes and SLLS is the SLL obtaind by stochastic
search. Increasing N from 15 to 30, the two estimated SLL values match perfectly. Starting from N equal to 30 up to 50, we estimate SLLRby searching the best deactivation ratio within last 17 elements
(bits). From the table, excellent approximation is obtained. However, crossing the border of N equal to 50 the array synthesis based on stochastic search is the only way to perform a good SLL estimation.
To demonstrate the capability of the IGA algorithm, we consider an array of 200 elemtens with deactivation ratio of 20% where a SLL of −22.4 dB is obtained as shown in Figure 10. The corresponding chromosome is given in row two of Table 2(b). In order to increase the computation efficiency, and due to symmetry of the array factor, the computation can be performed in the range from 0◦ to 90◦ instead
of −90◦ to 90◦; this will save 50% of the computation time. Using
Table 4. Variation of the best deactivation ratio versus array size. N Best deactivation ratio(%) SLLR(dB) SLLS(dB)
15 13 −13.56 −13.56
20 15 −15.54 −15.54
25 16 −17.16 −17.16
30 17 −17.99 −17.99
35 20 −18.68 −18.58
40 22.5 −19.39 −18.90
45 22.2 −19.77 −19.22
50 22.0 −20.11 −20.05
-80 -60 -40 -20 0 20 40 60 80 -50
-45 -40 -35 -30 -25 -20 -15 -10 -5 0
Arrival/Departure angle (degree)
N
o
rm
.
A
rr
a
y
f
a
c
to
r
d
B
Figure 10. Array factor for best chromosome given in row two of Table 2(b), 2N = 200, only 160 elements are active. The SLL is −22.4 dB.
5.2. Synthesis with Minimum SLL and Null Steering
In this section, the digital amplitude control is used to synthesize the array pattern with null steering for interference suppression. The search for the best chromosome that gives suppressed levels at the prescribed angular directions with the lowest possible SLL is based on the following fitness function
arrival of the interference has been chosen at the peak of the 6th side lobe. Figure 11 shows the array factor (solid) in the range−20◦ to 20◦
for 50 elements (N = 25) with the imposed null at 8◦ and with 20%
deactivation ratio. The array factor of the uniform array (dashed) is also shown in the figure. The interference rejection of less than−60 dB with−15 dB SLL was achieved with w1= 3 and w2= 1.
Figures 12 and 13 show the array factor (solid) in the range−20◦
to 20◦ for 100 and 200 elements with imposed nulls at 8◦ and 4◦,
respectively, for 22% deactivation ratio. The nulls are chosen at the peak of the third and sixth side lobe of the uniform array factor, respectively. The array factor of the uniform array (dashed) is also
-20 -15 -10 -5 0 5 10 15 20
-60 -50 -40 -30 -20 -10
Arrival/Departure angle (degree)
N
o
rm
.
A
rr
a
y
f
a
c
to
r
d
B
Figure 11. (Solid) Array factor with imposed null at 8◦ and 20%
deactivation ratio. The null depth is −60 dB with −15 dB SLL. (Dashed) Uniformly array factor, 2N = 50, d=λ/2.
-20 -15 -10 -5 0 5 10 15 20
-60 -50 -40 -30 -20 -10
Arrival/Departure angle (degree)
N
o
rm
.
A
rr
a
y
f
a
c
to
r
d
B
Figure 12. (Solid) Array factor with imposed null at 8◦ and 22%
-20 -15 -10 -5 0 5 10 15 20 -60
-50 -40 -30 -20 -10
Arrival/Departure angle (degree)
N
o
rm
.
A
rr
a
y
f
a
c
to
r
d
B
Figure 13. (Solid) Array factor with imposed null at 4◦ and 22% deactivation ratio. The null depth is −70 dB with −16.6 dB SLL. (Dashed) Uniformly array factor, 2N = 200, d=λ/2.
shown in the figures. The interference rejection of less than −70 dB for both cases was obtained with −17.6 dB SLL for Figure 12 and −16.6 dB SLL for Figure 13. Moving the null towards the main beam will degrade the SLL as expected, but we still have an excellent SLL for background noise suppression.
6. CONCLUSION
allows us to find a good approximation of the absolute minimum SLL of synthesized arrays.
Results for array digital amplitude control of different sizes have illustrated the performance of our proposed technique. By studying the dynamic thinning percentage of different array sizes, it was found that the best percentage of deactivated elements is 22% for array size above 100 elements. Simulation results show the effectiveness of this novel algorithm for pattern synthesis with low SLL and interference suppression.
REFERENCES
1. Bevelacqua, P. J. and C. A. Balanis, “Minimum sidelobe levels for linear arrays,”IEEE Trans. Antennas Propagt., Vol. 55, 3442– 3449, Dec. 2007.
2. Khodier, M. M. and C. G. Christodoulou, “Linear array geometry synthesis with minimum sidelobe level and null control using particle swarm optimization,” IEEE Trans. Antennas Propagt., Vol. 53, No. 8, 2674–2679, Aug. 2005.
3. Donelli, M., R. Azaro, F. De Natale, and A. Massa, “An innovative computational approach based on a particle swarm strategy for adaptive phased-arrays control,”IEEE Trans. Antennas Propagt., Vol. 54, No. 3, Mar. 2006.
4. Guney, K. and S. Basbug, “Interference suppression of linear antenna arrays by amplitude-only control using a bacterial foraging algorithm,” Progress In Electromagnetics Research, PIER 79, 475–497, 2008.
5. Haupt, R. L., “Thinned arrays using genetic algorithms,” IEEE
Trans. Antennas Propagt., Vol. 42, 993–999, Jul. 1994.
6. Mahanti, G. K., N. Pathak, and P. Mahanti, “Synthesis of thinned linear antenna arrays with fixed sidelobe level using real-coded genetic algorithm,”Progress In Electromagnetics Research, PIER 75, 319–328, 2007.
7. Buckley, M. J., “Linear array synthesis using a hybrid genetic algorithm,”Proc. IEEE Ant. Propagat. Soc. Int. Symp., 584–587, Baltimore, MD, Jul. 1996.
8. Ruf, C. S., “Numerical annealing low-redundancy linear arrays,”
IEEE Trans. Antennas Propagt., Vol. 41, 85–90, Jan. 1993.
9. Murino, V., A. Trucco, and C. Regazzoni, “Synthesis of unequally spaced arrays by simulated annealing,” IEEE Trans. on Signal Processing, Vol. 44, No. 1, 119–123, 1996.
“The optimization of thinned phased arrays by the use of neural networks,” 10th Annual Benjamin Franklin Symposium, Philadelphia, PA, May 2, 1992.
11. Rattan, M., M. S. Patterh, and B. S. Sohi, “Antenna array optimization using evolutionary approaches,” Apeiron, Vol. 15, No. 1, 78, Jan. 2008.
12. Razavi, A. and K. Forooraghi, “Thinned arrays using pattern search algorithms,” Progress In Electromagnetics Research, PIER 78, 61–71, 2008.
13. Rocha-Alicanoa, C., D. Covarrubias-Rosalesa, C. Brizuela-Rodrigueza, and M. Panduro-Mendozab, “Differential evolution algorithm applied to sidelobe level reduction on a planar array,”