2869
Analytic Implementation of Big Data in Cricket
using Hadoop Framework
Bhawna
1, Seema Baghla
2,
1Student M. Tech. (Comp. Engg.), 2Assistant Professor (Comp. Engg.)
Yadavindra College of Engineering, Punjabi University Guru Kashi Campus, Talwandi Sabo, Bathinda, Punjab, India
Email: [email protected], [email protected]
Abstract-Big data creates a new way in the cricket to predict the results of a game that which team is going to win the game and also help in to improve the performance of the team. In this paper, data mining is performed over the self-created database using the Apache hadoop framework. With the use of mined data, a team can analyse the strategy followed by the opponent team and predict how they are going to play in upcoming matches. The popularity of a particular player can also be analysed by the number of followers on twitter. Players dependent parameters are considered based upon their batting and bowling data to extract the best insights and to classify the batsman and bowler into different categories. In experimental work, analysis of parameters is done using hadoop and hive for all major cricket teams.
Key-words- Cricket team prediction, Apache hadoop, Mapreduce algorithm, HCatalog tool, Beeswax Hive tool.
1INTRODUCTION
Big data is a term used to refer the data sets that are too big to be handled using the existing database management tools [11]. Only those technologies that can present vast quantities of structured and unstructured data quickly in the right context are the ones that will provide genuine insights. Not only will these insights enhance our knowledge but also lead to proactive decision making which can redefine the future of all our ventures. Internationally, sports like baseball and basketball have already adopted statistical analysis to enhance their performance. Today cricket has been added to the list of technologically enhanced sports with the adoption of the advanced big data analytics. Big data creates a new way in the field of cricket to predict the outcome of a game by analysing the numerous amounts of data generated in every match of cricket. This data can be generated from the various wearable devices like fitness trackers that present the real-time stat of each player including the speed of batsman hitting the ball and the speed of bowlers throwing the ball, their heart rate and the acceleration. According to the data generated coaches can analyse the performance of each batsman and the bowler.
2 LITERATURE REVIEW
Gandomi and Haider (2015) [1] explained the
concept of analytics to gain valuable and valid insights from big data. They reviewed various
2870 Rule, Predictive Apriori Association Rule and
Tertius Association Rule. Author compares the result of these three algorithms which shows that Apriori Association algorithm performs better than any other algorithm. Anjali et al. (2015) [8] explained the use of big data analysis in the field of sports. They use the real time data of cricket tweets to get the accurate results. For the analysis of data, map reduce algorithm is used. They suggest to use the big data analysis in other sports also like football, baseball etc. Agarwal et al. (2017) [9] explained the use of statistical modeling approach in the field of cricket to predict the best appropriate team to be lined up for a specific match.
Manikandan and Ravi (2014) [10] explained that
the use of big data tools like mapreduce algorithm over hadoop and hdfs helps the organization in taking best business Mukherjee and Shaw (2016)
[11] discussed the practical and theoretical
challenges that are hindering in the development of big data analytics. Phaneendra and Reddy (2013) [12] explained the hadoop architecture consisting HDFS to handle big data systems. The authors also focused on various challenges faced by enterprises while handling big data. Ahlawat et al. (2016) [13] defined the ecosystem, developed various models and categorized the elements on the basis of big data. They are able to identify various techniques and technologies for big data analytics. They analysed the areas for the usage of big data analytics. The various data forms are also discussed in this paper.
3 METHODOLOGY
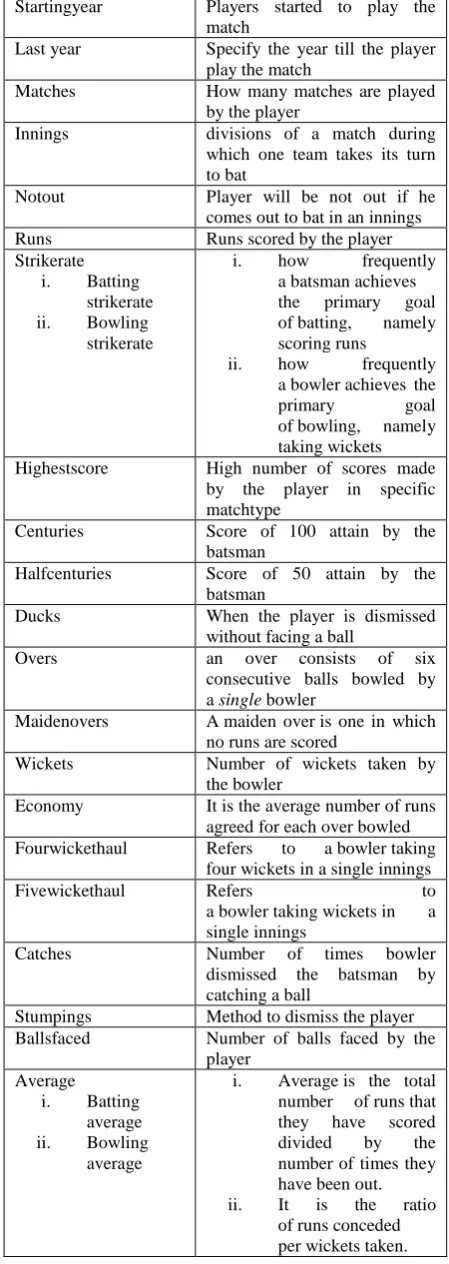
[image:2.595.308.533.103.736.2]The role played by big data for obtaining the objectives are elaborated with the working of MapReduce algorithm and Hortonworks Sandbox 2.2.0. Initially the pre-processed and the compiled (csv) data files are uploaded in hadoop based Hortonworks platform using file browser tool. These files are then accessed using HCatalog tool to form the tables. To obtain the desired results, scripts and queries are written on Beewax Hive tool. Twenty- four parameters are considered based upon the batting and bowling data of a player. Table 1 shows the description of the batting and bowling attributes of cricket.
Table 1 Cricket attributes with description
Attribute Description
Player Name of the players
Matchtype Specify the type of match like “ODI” or “T20”
Country Name of the countries
Startingyear Players started to play the match
Last year Specify the year till the player play the match
Matches How many matches are played
by the player
Innings divisions of a match during
which one team takes its turn to bat
Notout Player will be not out if he comes out to bat in an innings
Runs Runs scored by the player
Strikerate i. Batting
strikerate ii. Bowling
strikerate
i. how frequently
a batsman achieves the primary goal of batting, namely scoring runs
ii. how frequently
a bowler achieves the
primary goal
of bowling, namely taking wickets Highestscore High number of scores made
by the player in specific matchtype
Centuries Score of 100 attain by the batsman
Halfcenturies Score of 50 attain by the batsman
Ducks When the player is dismissed
without facing a ball
Overs an over consists of six
consecutive balls bowled by a single bowler
Maidenovers A maiden over is one in which no runs are scored
Wickets Number of wickets taken by
the bowler
Economy It is the average number of runs agreed for each over bowled Fourwickethaul Refers to a bowler taking
four wickets in a single innings
Fivewickethaul Refers to
a bowler taking wickets in a single innings
Catches Number of times bowler
dismissed the batsman by catching a ball
Stumpings Method to dismiss the player Ballsfaced Number of balls faced by the
player Average i. Batting average ii. Bowling average
i. Average is the total number of runs that they have scored divided by the number of times they have been out. ii. It is the ratio
[image:2.595.69.289.711.767.2]2871 4 RESULTS AND DISCUSSIONS
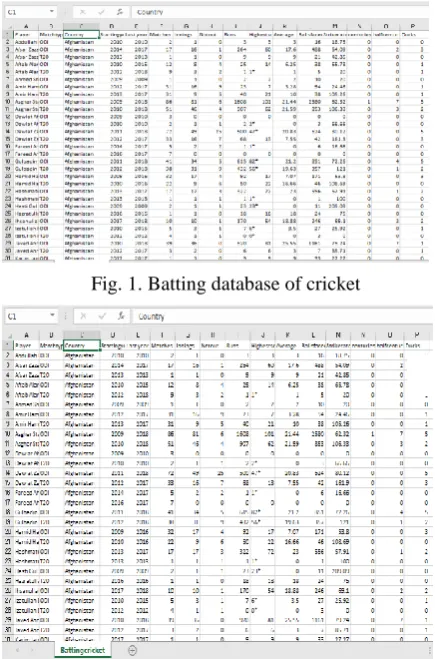
The process is initiated by collecting the data on the basis of some attributes as shown in table 1 related to the field of cricket, to enhance the winning chances of a team in the matches of “ODI” and “T20”. Figure 1 represents the database of cricketers based upon their batting performances.
Fig. 2. Bowling database of cricket
[image:3.595.313.534.100.275.2]Figure 2 represents the dataset of cricketers based upon their bowling performances.
Fig. 3. Script 1 written in hive tool
Figure 3 shows how the script is written to mine the data. The resultant output of script 1 is shown in figure 4 which is in the tabular form.
[image:3.595.71.289.199.529.2]Figure 5 represents the result of script 1 in pie chart form.
Fig. 1. Batting database of cricket
Fig. 7. Results of script 2 in tabular form Fig. 4. Results of script 1 in tabular
[image:3.595.315.532.347.718.2]form
2872 Figure 6 represents the script 2 written in the
beewax hive tool to mine the data from bowling database of cricket.
Fig. 6. Script 2 written in hive tool
Figure 7 shows the result of script 2 in the tabular form.
Figure 8 represents the result of query 2 in area covered form.
Figure 9 shows the query written in hive tool to analyis the popularity of players on social media site like twitter based upon follower> 3000000.
Fig. 9. Query written in hive tool
Figure 10 shows the result of query in tabular form and figure 11 shows the same resultant output in line graph form.
Fig. 8. Results of script 2 in area covered
2873 5 Conclusions and future scope
Even though the use of Big Data analytics has been a game-changer in the world of sports, it should be for informative purpose only. And for professional cricketers these results can take on a whole new meaning. If technologies behind the data are customized for cricket teams they can pave the way towards a higher level of performances. Similar systems could easily condense years of data and help teams make better decisions when it comes to team selection and game strategy. By combining data driven insights with years of experience and practice, even the most experienced professionals can make better decisions. If a team stops depending on its skills and gut instincts, the whole excitement of the game would vanish. So, there should be a distinctive gap between sports and Big Data analytics.
So, it can be concluded that
Teams should effectively consume data to derive insights.
Predicting the entire outcome of the game is difficult, but technology can assist in doing so.
Human decision making still dominates technology as most teams have similar data but performance varies.
In future, with the help of Machine Learning algorithms can be used to identify complex yet meaningful patterns in the data, which then allows us to predict or classify future instances or events. We can use data from the first innings, such as the number of deliveries bowled, wickets left, runs scored per deliveries faced and partnership for the last wicket, and compare that against total runs scored. Machine learning techniques like SVM, Neural Network, Random Forest can be used to create a model from the historical first innings data, considering the teams playing the match. The same model can be used to predict the second innings which is interrupted by rain. This will give a more accurate prediction than the D/L (Duckworth-Lewis system) method which is the most popular use of mathematics in cricket, as we are using a lot of historical data and all relevant variables.
REFERENCES
[1] A. Gandomi, M. Haider (2015), “Beyond the hype: Big data concepts, methods, and analytics”, International Journal of Information Management, 35(2), pp. 137-144.
[2] D. Che, M. Safran, Z. Peng (2013), “From big data to big data mining: Challenges, issues,
and opportunities”, International Conference on database systems for Advanced Applications, 7827, pp. 1-15.
[3] H. S. Bhosale, D. P. Gadekar (2014), “A review paper on big data and Hadoop” International Journal of Scientific and Research Publications, 4(10), pp. 1-7.
[4] J. Dean, S. Ghemawat (2004), “MapReduce: Simplified data processing on large clusters”, Communications of the ACM, 53(1), pp. 1-13. [5] N. Khan, I. Yaqoob, I. A. T. Hashem, Z.
Inayat, W. K. M. Ali, M. Alam, M. Shiraz, A. Gani (2014), “Big data: Survey, technologies, opportunities, and challenges”, The Scientific World Journal, pp. 1-18.
[6] R. Rein, D. Memmert (2016), “Big data and tactical analysis in elite soccer: Future challenges and opportunities for sports science”, SpringerPlus, 5, pp. 1-13.
[7] Shweta, K. Garg (2013), “Mining efficient association rules through Apriori algorithm using attributes and comparative analysis of various association rule algorithms”, International Journal of Advance Research in Computer Science and Technology, 3(6), pp. 306-312.
[8] S. Anjali, V. Aswini, M. Abirami (2015), “Predictive analysis with cricket tweets using big data”, International Journal of Scientific & Engineering Research, 6(10), pp. 78-83. [9] S. Agarwal, L. Yadav, S. Mehta (2017),
“Cricket team prediction with Hadoop: Statistical Modeling Approach”, Procedia Computer Science, 122, pp. 525-532.
[10] S.G Manikandan, S. Ravi (2014), “Big data analysis using apache Hadoop”, IEEE International Conference on IT Convergence and Security, pp. 1-4.
[11] S. Mukherjee, R. Shaw (2016), “Big data- Concepts, applications, challenges and future scope”, International Journal of Advance Research in Computer and Communication Engineering, 5(2), pp. 66-73.
[12] S.V. Phaneendra, E.M. Reddy (2013), “Big data- Solutions for RDBMS problems- A Survey”, International Journal of Advance Research in Computer and Communication Engineering, 2(9), pp. 3686-3691.