DOI: http://dx.doi.org/10.26483/ijarcs.v8i8.4716
Volume 8, No. 8,September-October 2017
International Journal of Advanced Research in Computer Science
RESEARCH PAPER
Available Online at www.ijarcs.info
ISSN No. 0976-5697
SENTIMENT ANALYSIS: AN APPROACH TO OPINION MINING FROM
TWITTER DATA USING R
Pooja Khanna
(Department of Computer Science Engineering, Amity University, Lucknow Campus
Sachin Kumar
(Department of Electronics and Communication Engineering, Amity University, Lucknow
Sumita Mishra
(Department of Electronics and Communication Engineering, Amity University, Lucknow
Anant Sinha
(Department of Electronics and Communication Engineering, Amity University, Lucknow
Abstract :Opinion mining also termed as sentiment analysisis basically utillized to implement anautomated algorithm to analyze and classify opinion.If we are interested to get the idea, the extent to which the Indian citizen likes or dislikes money demonetization or for instance consider a product marketer who on his present company market image, would like to decide upon, launching of his new product. A film celebrity who would like to judge his or her present popularity so as to decide on the perfect time to launch his or her new movie, for any of such case an obvious solution would require analysis of opinion from a random sample of people. For such public opinion measurement, various survey tools and techniques are available. With the sudden increase in text based social media, lump of people simulcast their point of view and ideas on a large range of issues. We can study this data available from public to conclude population attitudes to understand the current trends of the market. This study presents a very easy, costand time effective approach that expose the opinions of much larger public (not bounded by any geographical boundaries) which otherwise would have been not possible. The study presents an exhaustive study on the efficiency of R language in opinion mining and how opinion data can be extracted from twitter database. Extorting the opinion of people from social media text provides a rich and interesting context of database to analysis.
Keywords:Sentiment Analysis, CRAN, Affymetrix, R-Studio.
1. INTRODUCTION
Data analysis is the process of applying organized and systematic statistical techniques to describe, recap, check and condense data. It is a multistep process that involves collecting, cleaning, organizing and analyzing. Data mining is like applying techniques to mould data to suit our requirement. Data mining is needed because different sources like social media, transactions, public data, enterprises data etc. generates data of increasing volume, and it is important to handle and analyze such a big data. It won’t be wrong to say that social media is something we live by. In the 21st century social media has been the game changer, be it advertising, politics or globalization,it has been estimated that data is increasing faster than before and by the year 2020; about 1.7 megabytes of additional data will be generated each instant for each person on the earth. [1] More data has been generated in the past two years than ever before in the history of the mankind. It is clear from the fact that the number of internet users are now grown from millions to billions.
Database which is opted for the proposed study is from Twitter. It is now day’s very popular service which provides facility of microblogging. In this people write short messages generally less than 140 characters., about 11 words on average. It is appropriate for analysis as the number of messages is large. It is much easier task as compared to searching blogs from the net.
The objective of the proposed analysis, ‘Sentiment Analysis’, is the analysis of the enormous amount of data
easily available from social media. Algorithm generates an overall sentiment score from the inputted topic in terms of positive, negative or neutral, further it also works on finding the frequency of the words being used. Word cloud that is a pictorial representation of words based on frequency occurrence of words in the text is also generated. Calculation is actualized utilizing R attributable to its component rich, thorough and expressive abilities for measurable information. [2]
2. R LANGUAGE
R is a coding language and software system utilized for the analysis of statistical data, representation of charts, graphs and reporting. R language was developed by Ross Ihaka and Robert Gentleman at Auckland University New Zealand. R is available freely under public license. Name of programming language R was derived from the first letter of first name of the two R developers (Robert Gentleman and Ross Ihaka).
2.1 Features of R Language
• R language is a well-developed, straight forward and efficient programming language. It includes loops, conditionals, recursive functions, and input and output facilities.
• R has an excellent storage and data handling facility. • R provides a set of operators for vectors, arrays and
• R provides a list of wide collection of tools for data analysis.
• R is accessed through interpreter based on command line; it supports arithmetic operations which are matrix based. Data structure of R involve matrices, lists and data frames. Extendable object scheme of R contains objects for type is not a data structure of R. As an alternative, a scalar is expressed as a vector which is of length one. • Procedural programing is supported by R language with
utilized by statisticians and mathematicians, needs an atmosphere for analysis of statistical data and development of software, R language is also utilized as a tool box for common matrix operations with performance standards similar to MATLAB or GNU octave.
2.2 Package
Performance of R language can be enhanced through a package which is created by user generally developed in C, C++ and java. For specific statistical method, graphical plots (ggplots), Import/ Export abilities, reporting tools (knitr, sweave ) etc. R has a core group of packages; it is provided through the installation, with more than 7,801 extra packages, these include Comprehensive R Archive Network (CRAN), Bio conductor, Omega hat, GitHub, etc.
The "Task Views" page on the website of CRAN provide a great variety of jobs (such as Finance, Genetics, Computing with good performance, Machine Learning, Medical Imaging, Social Sciences and Spatial Statistics) to which R has been utilized and for which packages are provided. R is also used by the Food and Drug Administration (FDA) as right for analyzing data from medical research. Some R package resources comprise Crantastic, which is an open site for rating and studying all CRAN packages, and R-Forge, a central platform for the collective enhancement of R packages, software associated to R, and projects. R-Forge also hosts various unpublished beta packages, and development of CRAN package.
For the analysis of genomic data, the Bio-conductor project provides many R packages like Affymetrix and cDNA microarray object-oriented data-handling, and has begun to offer tools for examination of next generation data high throughput sequencing technique.
2.3 R Studio
RStudio is an IDE, integrated development environment. It offers management of workspace, it involves syntax highlighting editor, console and debugging. RStudio is an open supply software system although business versions are also provided with some improved features and it supports desktop computers which operates on windows, mac and Linux as well as on browser connected to RStudio.
Two versions available are:
a. Rstudio desktop: Software runs in the same way as desktop application.
b. Rstudio server: In this Rstudio is used to access web browser.
The proposed work was carried out using RStudio Desktop. Features utilized were:
1) IDE was created specifically for R language.
• Syntax is highlighted, completion of code and the smart indention
• From the source editor R program can be executed directly
• Rapidly switch to function definitions
2) Workflow is taken together
• Integrated R support and documentation
• using projects multiple working directories can be easily managed
• Data viewer and workplace browser
3) Influential authoring and fixing • Quickly detect and fix errors.
• Tools Extensive package development. • Authoring with Sweave and R Markdown
2.3.1 Shiny
Graphic User Interface for the proposed work ’Sentiment Analysis’ was developed utilizing shiny package of RStudio. It is one of the strongest software supports provided by RStudio. Shiny is equipped with a lot of prominent interface enhancing features. It's an interactive and user-friendly app developing package. [3-5]
3. TWITTER DATA
The algorithm proposed works on Twitter Data, primarily it collects the tweets and then study it with the help of different statistical computing procedures. Twitter account once registered and logged in, needs registering the application name on Twitter API to create our application which provide us the four legal credentials (API_key, API_secret, access_token, access_token_secret) required for connection establishment. [6,7] Steps involved can be pictorially summarized as:
i. Log on to Twitter Developers site and Sign in with your Twitter account.
iii. Generate a new application
iv. Enter the details of your application
v. Create your access token.
vi. Make a note of OAuth settings
Once done with the above steps, make a note of your OAuth settings. The information required for the proposed algorithm for twitter app are:
• Consumer Key • Consumer Secret • OAuth Access Token
• OAuth Access Token Secret [8-9]
[image:3.595.337.546.66.258.2]4. PROPOSED METHODOLOGY
Figure 1 shows a pictorial view of the steps involved; from collection of tweet data to opinion mining of the text data. Relationbetween R and Twitter was established using OAuth Protocol. OAuth protocol is an open standard for approval, generally utilized as a method for Internet operators to sign in to thirdparty websites by twitter, Facebook, Google, Microsoft, One Network etc. Accounts that do not share password. OAuth offers to customers a "safe delegated access" to server resources on account of a resource holder. It states a method for resource holders to approve the access of third party to their resources of server, and it is not necessary to share their identity. Specially designed to work with (HTTP) Hypertext Transfer Protocol,
Figure1: Pictorial Representation of opinion mining
from Twitter
Extract Tweets using OAuth Protocol
Cleaning of Text using R Language
WordCloud Generation
Histogram showing overall Sentiments of
the Data collected
Plotting of frequency count Histogram
Once the connection is made we can access tweets on any topic. Connection can be established with twitter using following code
Input: Twitter Account
Output: Connection establishment between Twitter and R
#connectionCredentials
consumer_key<- "KXtxt6wQpP2SHysvW1zpUfeom"
consumer_secret<-"mLVjBvBnKIEyygVww9JRxJIrKBFpyqGPkSNOzrKFoD qODTXRfa"
access_token<-"702745581706416128JkbMaTnnECZCXaUke8yM0TL53 W9sZFG"
access_secret<-
"xgpCHHTPKPvjf5Gyk36z9A5Vf1SOVwibXdygvwShBlR zu"
setup_twitter_oAuth (consumer_key, consumer_secret,access_token,access_secret)
Once connection is established the next step will be extraction of tweets
Input: Twitter Account Output: Extracted tweets
tweets <- searchTwitter(sample, n=num, retryOnRateLimit = 1, lang="en")
Variable tweets have been used to store the tweets in its raw form. Out here we can specify the entity to be searched, number of tweets to be considered at a time, the language of tweets to refer to and number of try to be done.
Raw tweets segregated are then converted into a list format which is then, with the help of lply function is converted into vectors (i.e., individual words). After this cleaning of text is performed.
Input: Extracted Tweets
Output: Cleaned Words, with all unnecessary details removed
clean <- tm_map(corpus, removePunctuation)
clean <- tm_map(clean, content_transformer(tolower)) clean <- tm_map(clean, removeWords, stopwords("en")) clean <- tm_map(clean, removeNumbers)
clean <- tm_map(clean, stripWhitespace) clean <- tm_map(clean, removeWords
Initial step is to eliminate the punctuations, then all words are converted to lowercase, after that all stop words are eliminated along with numbers and whitespaces. In last wordcloud is plotted by following statement.
Input: Cleaned Tweets Output: Plotted wordcloud
[image:4.595.313.533.54.249.2]wordcloud(clean, min.freq = 1, rot.per = 0.15,scale = c(3,0.5), random.order=FALSE, colors=brewer.pal(8, "Dark2"))
Figure 2: Wordcloud Plot
[image:4.595.318.537.353.504.2]“Frequency Count Second function determines frequency count of the words from tweets depicted in Figure 3. At any given time, there are thousands of tweets for a single post. Each and every word in such posts is not that significant on the other hand certain words show their own weightage by occurring number of times. This is achieved through built in function. [10]
Figure 3: Word Frequency Count Histogram.
Third is the sentiment analysis which gives us the clear idea of sentiments of public. Only the word count cannot express the sentiments of the people therefore we use “Sentiment Analysis” which gives the clear representation of the overall tweets getting positive, negative or neutral. This is the most unique function implemented in the paper as it shows the on-going thoughts of variety of people.
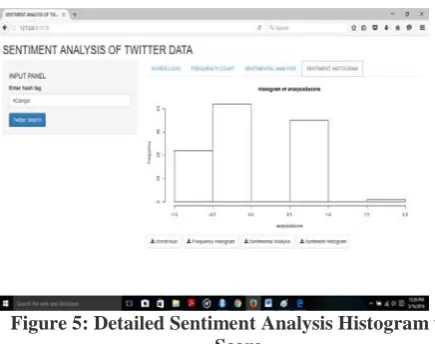
[image:4.595.330.547.599.753.2]Last function utilized tells us the percentage of being positive and negative. Analysis gives the comparative study of positive and negative thoughts. In the example implemented people have used more positive words as compared to negative words. Figure 4 depicts system analysis histogram based on number of positive, negative and neutral words.
Figure 5: Detailed Sentiment Analysis Histogram with Score.
Figure 5 gives analysis score histograms for the Twitter data taking into account sentiments of variety of people. The algorithm was implemented was based on instant moods giving a timing and cost effective solution.
5. CONCLUSION
Paper presents an algorithm to convert “bulk of data” available from social media (Twitter) into useful data and extract information by processing it to suit our requirement. Other benefits related with the automatic sentiment analysis presented, include subjects who express their opinions frequently have much distinct opinions than others. These sentiments are also impelling others who are reading them, which is called word-of-mouth marketing. Taking out these thoughts is thus more treasured. Also, thoughts are extracted in real-time, letting for earlier response times to market changes and for full time-based data because of which it
become possible to plot trends over time. This was implemented using R to obtain detailed sentiment analysis of the Twitter Data. The analysis so obtained can be used to infer population attitudes to generalize the prevailing trends of the market and make predictions regarding profit making sectors.
REFERENCE
[1] Xing Fang, Justin Zhan, “Sentiment analysis using product review data , Journal of Big Data, 16 June 2015.
[2] Shruti Kohli,HimaniSingal, “Data Analysis with R”, 2014 IEEE/ACM 7th International Conference on Utility and Cloud Computing
[3] T. R. Foundation, "R: What is R?,". [Online]. Available: https://www.r-project.org/about.html
[4] "RStudio," in Wikipedia, Wikimedia Foundation, 2016. [Online]. Available: https://en.wikipedia.org/wiki/RStudio. [5] FissehaBerhane, “Sentiment Analysis on Donald Trump using
R and Tableau ”, R news and tutorials contributed by (600) R bloggers , 2 January 2016.
[6] Xin Chen, Student Member, IEEE, Mihaela Vorvoreanu, and Krishna Madhavan, “Mining Social Media Data for Understanding Students’ Learning Experiences”, IEEE TRANSACTIONS ON LEARNING TECHNOLOGIES, VOL. 7, NO. 3, JULY-SEPTEMBER 2014
[7] Shulong Tan, Yang Li, Huan Sun, Ziyu Guan, Xifeng Yan,
Member, IEEE, Jiajun Bu, Member, IEEE, Chun Chen, Member, IEEE, and Xiaofei He, Member, IEEE,” Interpreting the Public Sentiment Variations on Twitter”, IEEE TRANSACTIONS ON KNOWLEDGE AND DATA ENGINEERING, VOL. 26, NO. 5, MAY 2014
[8] Y.Sandeep et al, “Methodological Study of Opinion Retrieval Techniques for Twitter Social Network”, 2015 International Conference on Circuit, Power and Computing Technologies [ICCPCT]
[9] Xinjie Zhou, Xiaojun Wan, and Jianguo Xiao, “CMiner:
Opinion Extraction and Summarization for Chinese Microblogs”, IEEE TRANSACTIONS ON KNOWLEDGE AND DATA ENGINEERING, VOL. 28, NO. 7, JULY 2016.
[10]Khurshid Ahmad, “Affective computing and sentiment