Hotels in Australia 1988 – 2003
A Tale of Booms and Busts
By
Brian King
School of Hospitality, Tourism and Marketing Victoria University
Australia
and
Mike McVey
Centre for Hospitality and Tourism Research Victoria University
Hotels in Australia 1988 – 2003
Abstract
This paper reviews the development of Australia‟s hotel sector over a 15 year period and uses this analysis as the basis for suggesting the likely shape of future developments. The underlying dynamics of hotel development and subsequent performance are shown to reflect a continuing pattern of boom and bust. The late 1980s were characterised by a building boom in the lead up to the Bicentennial and World Expo celebrations. This was soon followed by a bust during the recession of the early 1990s. In the lead up to the 2000 Olympics another building boom occurred, particularly in Sydney leading to the predictable oversupply of rooms and subsequent stalling of construction during 2003. A change has been evident amongst developers from their view of hotels as a component of commercial property development towards a stronger connection between inner-city residential apartment developments and hotels.
Introduction
In recent years the Australian hotel industry has experienced considerable market turbulence. As noted in the report Hotels in Australia, a number of major new hotels entered the market in the lead up to the Sydney 2000 Olympics (McVey and King 1998). Though the staging of the Games in Sydney was widely reported as having achieved great success, the anticipated surge in international visitation to the country did not eventuate. Whilst New Zealand achieved growth of 7 percent during 2001, international arrivals to Australia over the same period fell by 2 percent. International arrivals stalled in the aftermath of the September 11, 2001 terrorist attacks and the subsequent „War on Terrorism‟ and associated leading to military campaigns.
The Australian hotel industry was also badly affected by the collapse of Australia‟s second largest carrier in September 2001, Ansett Airlines. Domestic and international airline services were cancelled or significantly curtailed. The launch of the low cost domestic carrier Virgin Blue and its announcement of plans to expand internationally to New Zealand and Fiji has subsequently alleviated the reduction in air services. However at the time of its launch it was unable to fill the gap left by Ansett and compensate fully for the already difficult operating environment. Subsequently the operating environment has to some extent stabilised. The prospective launch of new domestic low cost carriers (LCCs) including the Qantas-owned Jetstar may help to improve market conditions with associated benefits for the accommodation sector.
Tourism Demand
will provide a sense of longer term trends and insights into likely future events from a supply, demand, investment and development perspective.
The health of hotels and the commercial accommodation sector derives substantially from tourism demand trends. Fewer international tourists arrived in Australia during 2001 and 2002 prompted by fears of an economic downturn in the United States, continued deflation in Japan and the lingering effects of the Asian Financial Crisis in key markets. On a more positive note, the Bureau of Tourism Research (BTR) reported that domestic tourist trips increased during 2002, albeit by a modest 1 per cent. Whilst particularly welcome for destinations outside the urban areas, this growth has been insufficient to offset the ongoing over-supply of hotel rooms.
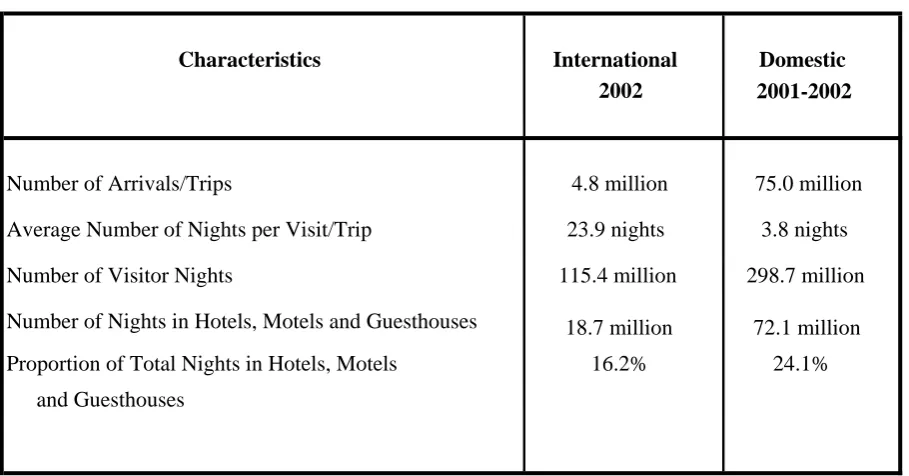
Table 1 shows the scale of international and domestic tourism in Australia during 2002. Domestic tourism generates nearly three times as many visitor nights as international tourism. The discrepancy is however even more pronounced in the case of hotel, motel and guesthouse room nights. The demand from domestic tourists for these categories of accommodation is six times its equivalent amongst international tourists.
Insert Table 1 about here
Accommodation Stock
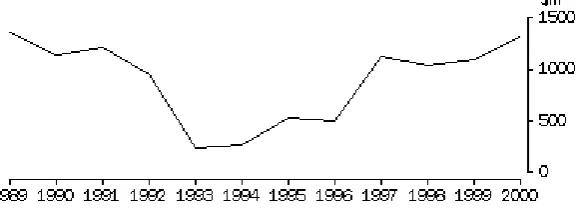
The value of completed accommodation projects reached its highest level for more than a decade in 2000, posting an increase of 21 per cent in room supply (worth AU$1,320 million) over the previous year. Half of this new investment occurred in New South Wales, Australia‟s most populous state. Over the period 1998 to 2000, in excess of AU$1,242 million of new tourist accommodation was added in New South Wales alone, mostly in Sydney.
Insert Figure 1 about here
______________________________________________________________
In 2000, the number of applications and approvals for new tourist accommodation declined dramatically with a drop in approvals by 42 per cent over 1999. Into 2001 the value of completed accommodation developments slumped by more than 80 per cent over 2000, continuing the earlier trend. In the run-up to the Olympics much of the growth in tourist accommodation consisted of 4 and 5 star establishments in New South Wales (Australian Bureau of Statistics 2001). Whilst the supply of tourist accommodation in New South Wales was 25 per cent, Australia-wide capacity grew by a more modest 13 per cent between 1997 and 2000. This suggests that supply does experience a peak in the lead up to the hosting of major events and that such growth, while reflected nationally, is concentrated in the area hosting the event.
_________________________________________________________
Insert Table 2 about here
Wales witnessed the largest contraction (almost five per cent). Between 2001 and 2002 14 Sydney hotels went out of business, many of these in the King‟s Cross Area which has been a well established tourist precinct. These closures included a number of well-known properties such as the Landmark, the Gazebo, the Sebel, the Chateau, the Manhattan and The Top of the Town. Some were converted into apartments by their owners, encouraged by escalating real estate values and the disincentive to refurbish when average room rates are trending downwards. The closures and conversions mark a new trend in Australia‟s accommodation supply. It suggests that crossovers may occur in cases where supply within a particular accommodation segment grows to unsustainable levels. The serviced and residential apartment sector may be the main beneficiaries, though with plateaing prices and emerging oversupply in Melbourne and Sydney, it is not inconceivable that future conversions could follow a reverse pattern.
In 2002 New South Wales also exhibited the largest contraction of room supply in the motels and guesthouses sector, followed closely by Queensland. Tasmania, the smallest and least populous state, reported a surprising 9 per cent increase following the addition of 6 new establishments. Nationwide the supply of motel and guesthouse establishments and rooms declined by around 1 per cent in 2002.
Insert Table 3 about here
Insert Table 4 about here
______________________________________________________________
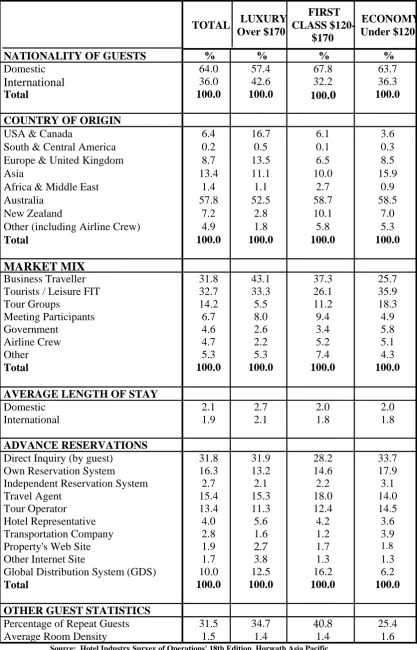
Australia is quite well served by reports which provide an annual overview of the accommodation sector. An annual Hotel Industry Survey is published by Horwath Asia Pacific (2002). Table 4 presents data from the most recent survey and shows that on average, nearly 2 out of every 3 guests originated from within Australia. „Luxury‟ hotels had a significantly higher proportion of international guests.
Across the range of properties that were surveyed, around two thirds of guests were either Tourist/Leisure FIT (32.7 per cent) or Business Travellers (31.8 per cent). Tour groups (14.2 per cent) provided the third largest component of the market mix. These are also the three dominant market mix in the „Economy‟ and „First Class‟ hotels that were included in the survey. However, „Economy‟ hotels received more Tourist/Leisure FIT guests (35.9 per cent) than Business Travellers (25.7 per cent). In the case of „First Class‟ hotels, Business Travellers (37.3 per cent) comprise the largest segment followed by Tourist/Leisure FIT (26.1 per cent). In „Luxury‟ hotels business Travellers (43.1 per cent) comprise the biggest segment followed by Tourist/Leisure FIT (33.3 per cent). Meeting Participants (8.0 per cent) providing a larger proportion of guests than Tour Groups (14.2 per cent) in „Luxury‟ hotels. During 2002, 2 nights was the typical length of stay for both international and domestic guests. In contrast, domestic guests in „Luxury‟ hotels tended to stay longer (2.7 night) than those staying in „Economy‟ or „First Class‟ hotels (both 2.0 nights). International guests stayed slightly longer in „Luxury‟ hotels (2.1 nights) than in „Economy‟ and „First Class‟ hotels (both 1.8 nights).
source of information for many respondents who report making internet enquiries prior to making reservations. Most people still however appear to prefer an element of personal contact when making advance reservations.
Insert Table 5 about here
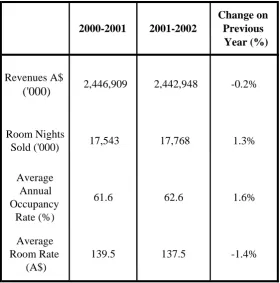
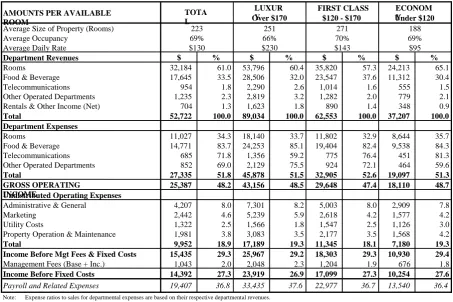
Table 5 provides a breakdown of departmental revenues and expenses for the hotels included in Horwath Asia Pacific survey. The average occupancy rate for all hotels (69 per cent), is higher than the figure recorded by the Australian Bureau of Statistics (62.6 per cent). The average size of property in the Horwath Asia Pacific report was 223 rooms, perhaps indicative of skewing towards larger city centre properties. During financial year 2001-2002 average room rates in the ABS survey were AU$137.50, slightly down on the previous year (AU$139.50). The average room rate for hotels included in the Horwath Asia Pacific survey was somewhat lower AU$130.
„Luxury‟ hotels achieved the highest average room rate (AU$230), but the lowest average occupancy rate (66 per cent). From an operator and investor point of view, the comparison with equivalent properties overseas is not encouraging. In mid 2002 the corporate rate for Sydney‟s Four Seasons Hotel was AU$225. Based on prevailing exchange rates, its equally ranked property in London charged a rate equivalent to more than three times this level. „First Class‟ hotels in Australia achieved an average room rate of AU$143 and the highest occupancy rate of 70 per cent. „Economy‟ hotels achieved an average room rate of only AU$95, well below the overall average. Nevertheless, their average occupancy rate of 69 per cent matched the figure reported by all hotels.
„Economy‟ hotels achieved a higher proportion of revenues from rooms (65.1 per cent) and a lower proportion from food and beverage (30.4 per cent). The opposite was the case for „First Class‟ hotels, with room revenues accounting for a lower proportion of total revenues (57.3 per cent) and food and beverage revenues accounting for a higher proportion (37.6 per cent). „Luxury‟ hotels came closer to the overall average with 60.4 per cent of revenues derived from room sales and 32 per cent of revenues from the sale of food and beverage.
Across the three categories of hotel considered in the survey, departmental expenses were more evenly matched. Operating costs within room departments averaged 34.3 per cent of room revenues compared with food and beverage department costs averaging 83.7 per cent of departmental revenues. The minor revenue generating sources (telecommunications and others) also had high expenses averaging 71.8 per cent and 69 per cent respectively. Gross operating incomes were remarkably similar across the three categories of hotel and average gross operating incomes were within one percentage point of the overall 48.2 per cent average for all categories. The same observation my be applied to undistributed operating expenses which averaged 18.9 per cent of overall revenues. Some significant variances were evident within the category of marketing expenses. „Luxury‟ hotels allocated an average 5.9 per cent of revenues to marketing activity, compared with the overall average of 4.6 per cent. By way of comparison „First Class‟ and „Economy‟ hotels both averaged an allocation of 4.2 per cent. This reflects the stronger emphasis given by upscale properties to creating and maintaining a luxury brand image and the higher cost of promotional materials associated with such market positioning.
Class‟ and „Economy‟ properties averaging 36.7 per cent and 36.4 per cent respectively.
It appears as if „Luxury‟ hotels have been undertaking increasing marketing activity in order to boost stagnant occupancy rates . At the same time they appear to be by cutting costs on payroll and related expenses to improve operating profits. In a previous Hotels in Australia report which relied upon 1994 data, the overall average occupancy rate recorded by the Horwath Asia Pacific survey was 72 per cent (McVey and King 1995). During 2002 this dropped to an average of 69 per cent. „Luxury‟ hotels recorded an average occupancy of 66 per cent in both years, well behind the average of 73 per cent for „First Class‟ and „Economy‟ hotels.
Significant shifts in expenditures were evident across the three categories of hotel. In 1994, „Luxury hotels were allocating an average of 8.9 per cent of revenues towards marketing compared to the overall average 5.5 per cent. In 1994, payroll and related expenses accounted for 45.3 per cent of „Luxury‟ hotel revenues compared to an overall average 36.6 per cent. As a result, income before fixed costs and management fees for „Luxury‟ hotels was only 9.5 per cent of revenues in 1994 compared to an overall average of 23.9 per cent for all hotels surveyed. In 2002, „Luxury‟ hotels achieved an average income before management fees and fixed charges of 29.2 per cent compared to an overall average of 29.3 per cent for all hotels surveyed. Over the past eight years, it appears that „Luxury‟ hotels have benefited from their improving operational efficiency.
Insert Table 6 about here
______________________________________________________________
In Table 6 performance indicators are provided for key cities and tourist destinations. All are located along Australia‟s eastern seaboard which is where most of the national population is concentrated. Brisbane achieved the highest occupancy rate with Sydney in second position, increasing its occupancies by 6 percent over 2002. Sydney hotels achieved the highest annual average daily rate (ADR) followed by Australia‟s second largest city Melbourne. Sydney also achieved the highest revenue per available room, again followed by Melbourne. During 2002 declines were reported for Melbourne in all three indicators. All of the other key destinations performed better during 2002, the only exception being a slight decline in Sydney‟s annual average daily rate.
fallen. Australian resorts have suffered from low occupancies and poor yield relative to capital hotels in most states.
These are among the findings of a recent report commissioned by TTF Australia (formerly known as the Tourism Taskforce) and produced by Ernst & Young (Ernst and Young 2003). The report was published in 2003 and made recommendations for changing the way in which tourism is marketed generally and resorts are marketed in particular. The Ernst & Young conclusions make unpleasant reading for investors. High labour costs and fixed expenses, poor accessibility and growth in the supply of serviced apartments have all damaged the resort sector. According to UBS Warburg and the Australian Stock Exchange (ASX), the Standard & Poor (S&P)/ASX 300 Property index returned 11.1 per cent in the three years to July 31, 2002. During the same period, leading listed trusts that included resorts all failed to come close to this figure. The Grand Hotel Group recorded a negative 21.49 per cent return, Peppers Hotel Trust (now the Australian Hotel Fund) negative 18.78 per cent, Port Douglas Reef Resorts negative 3.09 per cent and Cypress Lakes Trust negative 2.21 per cent. Only Hamilton Island Trust based in Queensland‟s Whitsunday Islands posted a positive return. The result amounted to a return of just 2.84 per cent.
Ernst & Young offer a number of proposals to improve resort performance. „Older, luxury resorts need to revamp their conservative image (making them appear) active, fun and exciting if seeking to appeal to the family market. There is a growing need for retreat-style resorts, given the significance of existing demand‟. To improve viability, resorts should focus on providing services and value for money to „increasingly sophisticated domestic and international consumers‟. The report concludes that resorts must capitalise on the perception of Australia as a safe place to travel to, and within during this period of uncertainty.
Hotel Ownership
Insert Table 7 about here
______________________________________________________________
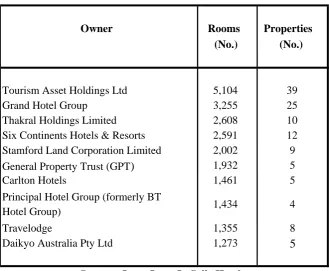
In a national survey carried out amongst 132 major owners, 393 establishments and 66,500 rooms, Jones Lang LaSalle identified the top ten owners of tourist accommodation in Australia (2003). The results shown in Table 6, demonstrate only one change of position since the previous annual survey. United Overseas Land dropped off the list as a result of the sale of its Landmark Parkroyal property in late 2001. United Overseas Land‟s place has been taken by Travelodge which opened a 275 room property in Southbank, Melbourne. It should be pointed out that Travelodge is separate from the prominent mid-scale brand previously operated by the former Southern Pacific Hotels Corporation (SPHC).
through the acquisition of three properties in Cape Tribulation, Queensland, and the refurbishment and addition to Ayers Rock Resort in the Northern Territory. GPT remains the sixth largest owner of tourist accommodation in Australia.
Insert Figure 2 about here
_______________________________________________________________
Hotel Investment
The virtual demise of Japan as a significant source of hotel investment over the last fifteen years has had a significant impact on the sector in Australia. This is a marked change over the late 1980s where there was a widely held popular misconception that Japanese investment would come to dominate the hotel industry throughout Australia. At one stage Japanese sources did account for a disproportional share of investment in a limited range of up-scale properties in specific locations (mainly in Far North Queensland and on the Gold Coast). As compensation for the drop in Japanese involvement, domestic investment has become increasingly evident. Singapore currently occupies second place as a source of investment, albeit well behind Australia.
The report identified a number of impediments to investment. These include:
trading volatility;
poor past performance due to oversupply;
returns to investors are not commensurate with risk; hotels tend to be over-valued;
the hotel market is relatively illiquid and small scale; low barriers to entry contribute to over-supply; and unrealistic expectations on behalf of investors.
The report concluded that investors lack any clear understanding of the risks involved in hotel industry investment and that whilst the availability of reliable information has improved over the past decade, investors do not know how to use it. The authors argued that investors need to develop a better understanding of the risks involved and a more realistic expectation of likely returns.
A summary of the Jones Lang LaSalle recommendations is provided below:
Taxation
- Reduce travel taxes (eg. the tax imposed following the collapse of Ansett) or inject funds back into the industry; - Reduce or remove onerous levels of stamp duty on
property transactions;
- Eliminate the GST currently payable on stamp duty; - Educate the market about the „going concern‟ rule;
- Base depreciation on the effective life of an asset, rather than on its physical life;
- Increase transparency and consistency across these state based taxes; and
Regulations
- Remove the market distortions involving incentives for strata titled development to ensure a level playing field; - Regulate strata development offerings and introduce an
accreditation of promoters;
- Councils should require feasibility plans before granting development consent for accommodation; and
- Eliminate compulsory inclusion of hotels in mixed use developments.
Information/Education
- Lessen the use of jargon;
- Share business mix information between hotels;
- Provide demand forecasts on a regional and business mix basis;
- Publish development registers;
- Improve the timing and reliability of the International Visitor Survey and the National Visitor Survey;
- Compare hotel cycles with other property cycles to create arguments for hotel investment as a method of diversification;
- Analyse sales and yields by buyer type, rather than in aggregate;
- Create an accurate and tailored operational benchmark system for hotel owners; and
- Educate investors as to the need to consider an exit strategy in the investment decision process.
Profile of Hotel Investment Market
- Increase the profile of hotel experts with institutional investors;
- Push for the inclusion of hotels‟ in general and non-property investment discussions and seminars;
- Target a high profile opinion leader institutional investor to invest in hotels; and
- Raise the profile of hotels with asset consultants and understand their roles and requirements.
Owner/Operator Alignment
- Alignment could be improved by owners taking equity in management companies or operators taking an equity position in hotel investment;
- Include performance incentives in management agreements;
- Educate investors as to the role and availability of asset managers; and
- Calculate incentive fees based on investment returns rather than Gross Operating Profit.
Capital Intensive Nature
- Undertake a triple net lease, with the operator taking responsibility for capital requirements;
- Purchase a portfolio of well-balanced assets with different timing for capital expenditure to increase the pool of available funds;
- Shorten the investment timeframe; and
- Improve capital expenditure planning and operators‟ discipline with the use of the Furniture, Fittings & Equipment Reserve
- Ensure that any future hotel specific Listed Property Trust (LPT) takes into account the experience of past LPTs; - Introduce income smoothing mechanisms into
management agreements or replace with leases;
- Educate operators as to the benefits of leasehold agreements;
- Create tranched investments which offer differing levels of risk to satisfy different investment strategies;
- Package hotels with other property types to provide a spread of risk;
- Market hotels as an “alternative” rather than as a “core property” class;
- Research and understand the timing of the cycles before buying and selling;
- Package hotels as part of a mixed use development, to offer a diversified income stream;
- Improve the accuracy of forecasting and make pricing decisions according to the required yield premium for hotels given their risk;
- Package hotels into geographically diverse portfolios; and - Create a hotel syndicate marketed at high net worth
individuals, targeting growth.
work outs or at least the provision of additional security to meet loan to value ratios (LVR) are likely.
Despite overall uncertainty and a softening of trading conditions in several key property types, a number of Australia‟s lending institutions are currently in the market for new hotel financing deals. Some of the larger lenders are however adopting a more cautious stance, opting to maintain their current portfolio in preference to increasing their hotel sector exposure. Any lending institutions in the market for new hotel financing deals expect to obtain a premium of at least 30-50 basis points over and above the rates required for fully let commercial property. In terms of LVR requirements, most banks set a limit of 50 to 60 per cent for senior debt, with both requirements reflecting the volatility of hotel assets.
Insert Table 8 about here
______________________________________________________________
Hotel Management Groups
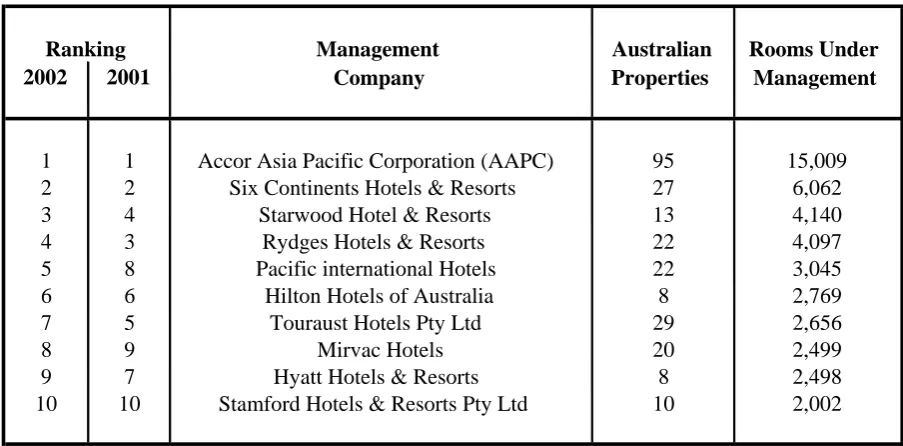
The appearance of serviced apartment dominated groups on the list of major management companies is likely to be a growing trend in view of the increasing preference by travellers for this type of accommodation. The Mirvac Hotels group has experienced an expansion for serviced apartments having secured the management of three properties during 2002. Mirvac is a major developer of residential apartments in inner urban areas such as Melbourne‟s Docklands. The entrance of Mirvac Hotels into the top ten has pushed Marriott International out of the list. Rydges Hotels & Resorts relinquished management of the Wentworth in Sydney to AAPC leading to the re-launch of this property under the Sofitel brand. The portfolio of Stamford Hotels and Resorts‟ declined when the Stamford Plaza Sydney was converted into residential apartments.
As well as a diverse range of properties under management, Accor has a diversified brand portfolio. These range from the five star Sofitel and Grand Mercure brands to the more functional and recently established Formule 1. Accor has also announced the establishment of a backpacker brand to be known as Base Backpackers. This initiative is indicative of Accor‟s intention to be a prominent operator across all market segments. The group has pursued its strategy of aggressive expansion through the acquisition of smaller chains including All Seasons, individual city properties such as the Victoria Hotel in Melbourne and regional properties such as Mount Buller Chalet in the Victorian Alps. When operating under its previous name of Bass Hotels and Resorts, the second largest hotel management group Six Continents, took over the SPHC management operations and proceeded to re-brand the Park Royal, Centra and Travelodge brands into Holiday Inns and Crown Plaza properties. A significant expansion of the latter brand has recently been announced with the re-designation of existing properties as Crown Plazas.
properties are motel-style which explains its omission from Table 8. In most cases they compete with independent owner operated properties and with other referral chains such as Best Western rather than with the more up-scale managed groups such as Starwood and InterContinental.
Insert Table 9 about here
______________________________________________________________
Hotel Property TransactionsError!
_________________________________________________________
Insert Figure 3 about here
_________________________________________________________
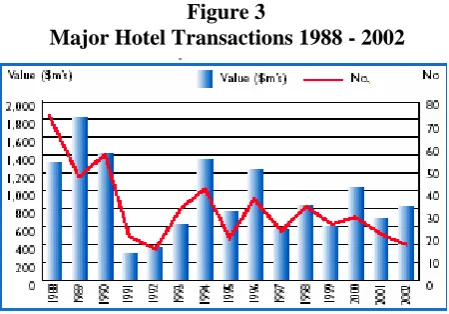
As is shown in Figure 3, the number of hotel transactions in Australia has been steadily declining over the past 15 years. More than 80 hotels were sold during 1998 valued at over AU$5 million. By 2002, such transactions had fallen to less than 20 properties. The value of these transactions has been in consistent. The value of hotels sold peaked in 1989 at around AU$1.8 billion before collapsing to around AU$300 million in 1991. The value of hotels sold during 2002 exceeded AU$800 million, up on the value of those sold during 2001.
According to Colliers International Australia (CIA), there were four major hotel sales (defined as those with a price in excess of AU$5 million) in Australia during December 2002. This raised the total number of major transactions for the year to 16, with a total value of around AU$812 million. In comparison there were 19 major sales in 2001 with a total value of some AU$705 million as shown in Figure 3. Australian purchasers accounted for 11 of these transactions, totalling some AU$300 million or 37 per cent by value. The two largest deals of the year were GIC Singapore‟s purchase of the Westin and ANA hotels in Sydney accounted for a combined AU$366.5 million or 45 per cent of total transactions for the year by value. The remaining 3 purchases featured investments from Malaysia, Macau and Thailand and accounted for 18 per cent by value.
Colliers International Hotels expect investor interest in Australian hotels to remain firm.
The ABS recorded an improvement in the performance of tourist accommodation for the December quarter 2002, underpinned by an increase in international visitor arrivals and a reduction in room supply. International markets did not recover until a full year after the attacks of September 11, 2001. Given the severity of the prolonged drought and widespread bushfires in Australia the recovery arrived surprisingly quickly. Nevertheless, major US corporate collapses, renewed international terrorist threats and weak global economies remained as deterrents to international travel. The Australian dollar is also at its highest level for several years compared with the US dollar, the Japanese yen and the currencies of some of Australia‟s most important tourist markets. This will reduce Australia‟s price competitiveness as a tourist destination.
The negative impact of international events could be compensated by domestic tourism growth as Australian travellers defer overseas trips and opt to travel domestically. The incidence of the SARS virus also sparked further interest in travel to domestic destinations. In the aftermath of the conflict in Iraq, the domestic self-drive tour market has been a beneficiary of lower fuel prices. Other positive factors which led to an improvement in demand for tourist accommodation included the hosting of the Rugby World Cup in late 2003. The hosting of the Commonwealth Games in Melbourne in 2006 is also likely to provide an impetus for growth in Victoria.
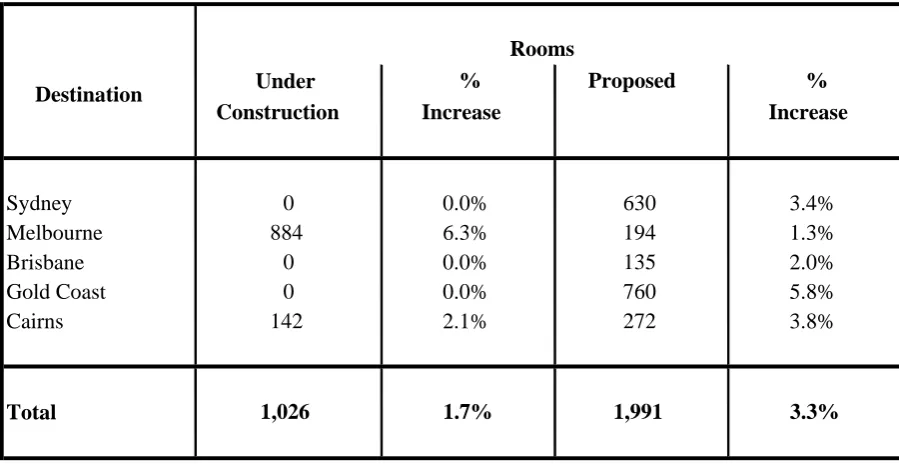
Colliers International Hotels assert that RevPAR rose during 2002, having slumped in the previous year. They expect a slight delay in growth as a result of the conflict in Iraq and SARS and that optimism remains strong in Sydney supported by recent room supply reductions and the expectation of solid demand growth over the medium to long term. They also believe that increases in room supply in Melbourne will continue to have a short term negative impact on hotel performance. The 80 room Marque Rendezvous Hotel opened in early 2003, epitomising the growing significance of boutique style hotels providing guests with individualised service. In terms of capacity, boutique hotels cannot compete with larger corporate properties. However, their expansion and continuing success is indicative of changing consumer preferences. Construction activity during 2004 has included the 469 room Promenade Hotel located within the Crown Casino complex and totals around 675 rooms.
Brisbane‟s robust hotel performance is expected to continue into the foreseeable future benefiting from major events such as the Rotary International Convention which was held in 2003 and brought in 15,000 international visitors. The growth in domestic self-drive tour markets, mentioned previously, is likely to encourage further growth in Queensland‟s Gold Coast. The introduction of Australian Airlines to Cairns in October 2002 produced positive results with improved links to the Asia Pacific region, though schedules have now extended to Sydney and Melbourne, thus neutralising some of the initial advantage that was gained by the northern gateway. The network of direct connections from Cairns to Asian cities provides an ongoing boost to demand. Growth in demand is expected with limited new room supply envisaged in the near future.
hotel market. As is the case in Sydney and Melbourne, Perth is experiencing an expansion of residential apartments in inner urban areas. This may alter the dynamics of property development with residential issues starting to exert some influence. Historically it has been issues of commercial property development which have been the dominant factor.
A significant increase in demand and static room supply in the Australian Capital Territory has produced positive results for the ACT tourist accommodation market in 2003. The market has been impacted negatively in the short term by the huge bushfires which occurred around the national capital during January 2003. Darwin continued to show negative trends during the first half of 2003. The launch of Australian Airlines services in 2002 which created new routes through Darwin should have boosted demand by mid-2003. The new north-south rail link between Darwin and Adelaide is providing a strong boost in the demand for leisure accommodation. Ongoing gas and oil exploration in the Timor Strait is likely to stimulate the corporate market.
Future Prospects
Over the next five years, can we expect a repeat of the boom/bust mentality and behaviour of the past 15 years? Encouragingly, there is no single event on the scale of the Olympics with the likely prospect of spurring the type of building frenzy which occurred in the lead up to 1988 (the Bicentennial and Brisbane Expo) or 2000 (the Olympics). Since Melbourne is already facing an oversupply, the prospect of such a pattern occurring in Victoria in the lead up to the Commonwealth Games is less likely, thus avoiding any potential knock-on effect to other states. The State Government has emphasised the importance of staging an ongoing calendar of events and avoiding an over-emphasis on a single mega-event. If a more balanced and sustained approach were to be adopted towards investment throughout Australia, this would help to counteract the instability that has characterised international tourist markets between 2001 and 2003. It would also allow property owners a sufficient margin to make provision for refurbishment, thereby maintaining Australia‟s reputation for quality service and products.
The rise of serviced apartments in Australia to challenge the traditional hotel model has come later than was the case in North America. The trend is however now well established, with strong penetration into the corporate market. Other forms of accommodation are also emerging. They include boutique style properties, particularly in inner urban areas and in destinations within easy reach of the main cities. Spa and health-focussed properties are also booming. These include dedicated properties such as Hyatt Coolum, as well as established hotels which have embraced a health and spa dimension. The 16th release of the Tourism Forecasting Council in May 2003 expects international tourist arrivals to Australia to grow by nearly 21 per cent and domestic tourism room nights by 2 per cent over the next five years. (TFC 2003)
Bibliography
Australian Bureau of Statistics (2003) Overseas Arrivals and Departures, ABS Canberra
Australian Bureau of Statistics (2003) Tourist Accommodation Australia, ABS Canberra
Australian Bureau of Statistics (2003) Year Book Australia 2002 – Tourist Accommodation Developments since 1998, ABS, Canberra
Ernst & Young (2003), Resorting to Profitability – Making Tourist Resorts Work in Australia, Report prepared for TTF Australia, Ernst and Young, Sydney
Horwath Asia Pacific (2002) Hotel Industry Survey of Operations 18th Edition, 2002 Howath Asia Pacific, Sydney
Jones Lang LaSalle Hotels (2002) Digest 2002, Jones Lang LaSalle, Sydney
Jones Lang LaSalle (2003) New Investment Frontiers – An Industry Action Plan for Reshaping Hotel Investment, Property Council of Australia and TTF Australia, Canberra
McVey, M.J. and King, B.E.M. (2003) Hotels in Australia Travel and Tourism Analyst, Mintel, London
McVey, M.J. and King, B.E.M. (1993) Hotels in Australia Travel and Tourism Analyst, Economist Intelligence Unit, London
Tourism Forecasting Council (2003) Forecast, TFC, Canberra
Standard & Poor/ASX 300 Property index, July 2002
Characteristics International Domestic 2002 2001-2002
Number of Arrivals/Trips 4.8 million 75.0 million
Average Number of Nights per Visit/Trip 23.9 nights 3.8 nights
Number of Visitor Nights 115.4 million 298.7 million
Number of Nights in Hotels, Motels and Guesthouses 18.7 million 72.1 million
Proportion of Total Nights in Hotels, Motels
and Guesthouses
16.2% 24.1%
Source: Australian Bureau of Statistics Table 1
Figure 1
Value of Completed Tourist Accommodation Buildings (Projects valued at AU$50,000 or more)
Note: Includes hostels, boarding houses, guesthouses, and holiday apartment buildings. Excludes the value of land and landscaping
Motels and Guesthouses
Location
Establishments Rooms Establishments Rooms Establishments Rooms Establishments Rooms Establishments Rooms Establishments Rooms
New South Wales 201 25,001 198 23,855 -1.5% -4.6% 990 32,929 979 32,109 -1.1% -2.5% Victoria 130 12,424 130 12,488 0.0% 0.5% 497 15,445 495 15,597 -0.4% 1.0% Queensland 169 20,822 168 20,639 -0.6% -0.9% 520 18,647 508 18,209 -2.3% -2.3% South Australia 61 4,083 62 4,362 1.6% 6.8% 144 5,170 145 5,232 0.7% 1.2% Western Australia 129 9,464 128 9,438 -0.8% -0.3% 124 5,561 126 5,579 1.6% 0.3%
Tasmania 53 2,900 54 2,867 1.9% -1.1% 49 1,646 55 1,801 12.2% 9.4%
Northern Territory 23 1,976 23 2,012 0.0% 1.8% 49 3,187 47 3,185 -4.1% -0.1% Australian Capital Territory 15 1,904 14 1,855 -6.7% -2.6% 27 1,845 27 1,853 0.0% 0.4%
AUSTRALIA 781 78,574 777 77,516 -0.5% -1.3% 2,400 84,430 2,382 83,565 -0.8% -1.0%
Percentage Change
Source: Australian Bureau of Statistics Table 2
Hotels, Motels And Guesthouse Establishments and Rooms In States And Territories
2001 2002 Percentage Change 2001 2002
Revenues A$
('000) 2,446,909 2,442,948 -0.2%
Room Nights
Sold ('000) 17,543 17,768 1.3%
Average Annual Occupancy
Rate (%)
61.6 62.6 1.6%
Average Room Rate
(A$)
139.5 137.5 -1.4%
Change on Previous
Year (%) 2001-2002
Source: Australian Bureau of Statistics 2000-2001
Performance Indicators For Hotels, Motels and Guesthouses 2000-2001 and 2001-2002
TOTAL LUXURY Over $170 FIRST CLASS $120-$170 ECONOMY Under $120
NATIONALITY OF GUESTS % % % %
Domestic 64.0 57.4 67.8 63.7
International 36.0 42.6 32.2 36.3
Total 100.0 100.0 100.0 100.0
COUNTRY OF ORIGIN
USA & Canada 6.4 16.7 6.1 3.6
South & Central America 0.2 0.5 0.1 0.3 Europe & UnitedKingdom 8.7 13.5 6.5 8.5
Asia 13.4 11.1 10.0 15.9
Africa & Middle East 1.4 1.1 2.7 0.9
Australia 57.8 52.5 58.7 58.5
New Zealand 7.2 2.8 10.1 7.0
Other (including Airline Crew) 4.9 1.8 5.8 5.3
Total 100.0 100.0 100.0 100.0
MARKET MIX
Business Traveller 31.8 43.1 37.3 25.7
Tourists / Leisure FIT 32.7 33.3 26.1 35.9
Tour Groups 14.2 5.5 11.2 18.3
Meeting Participants 6.7 8.0 9.4 4.9
Government 4.6 2.6 3.4 5.8
Airline Crew 4.7 2.2 5.2 5.1
Other 5.3 5.3 7.4 4.3
Total 100.0 100.0 100.0 100.0
AVERAGE LENGTH OF STAY
Domestic 2.1 2.7 2.0 2.0
International 1.9 2.1 1.8 1.8
ADVANCE RESERVATIONS
Direct Inquiry (by guest) 31.8 31.9 28.2 33.7 Own Reservation System 16.3 13.2 14.6 17.9 Independent Reservation System 2.7 2.1 2.2 3.1
Travel Agent 15.4 15.3 18.0 14.0
Tour Operator 13.4 11.3 12.4 14.5
Hotel Representative 4.0 5.6 4.2 3.6
Transportation Company 2.8 1.6 1.2 3.9
Property's Web Site 1.9 2.7 1.7 1.8
Other Internet Site 1.7 3.8 1.3 1.3
Global Distribution System (GDS) 10.0 12.5 16.2 6.2
Total 100.0 100.0 100.0 100.0
OTHER GUEST STATISTICS
Percentage of Repeat Guests 31.5 34.7 40.8 25.4
Average Room Density 1.5 1.4 1.4 1.6
Table 4
Hotel Market Analysis 2002
City Occ % ADR % RevPAR %
Change Change Change
Sydney 72.2% 6.0% $139.05 -5.0% $100.43 5.5%
Melbourne 69.0% -3.8% $135.22 -8.0% $93.30 -4.5%
Brisbane 72.6% 3.1% $101.75 1.8% $73.85 4.9%
Gold Coast 65.9% 2.8% $98.58 1.5% $64.99 4.3%
Cairns 66.2% 1.5% $100.01 1.9% $66.25 3.5%
Source: ABS and Jones Lang LaSalle Hotels
Table 6
Tourist Accommodation Performance in Key Australian Destinations, 2002
AMOUNTS PER AVAILABLE ROOM
LUXUR Y Over $170
FIRST CLASS $120 - $170
ECONOM Y Under $120
Average Size of Property (Rooms) 223 251 271 188
Average Occupancy 69% 66% 70% 69%
Average Daily Rate $130 $230 $143 $95
Department Revenues $ % $ % $ % $ %
Rooms 32,184 61.0 53,796 60.4 35,820 57.3 24,213 65.1 Food & Beverage 17,645 33.5 28,506 32.0 23,547 37.6 11,312 30.4 Telecommunications 954 1.8 2,290 2.6 1,014 1.6 555 1.5 Other Operated Departments 1,235 2.3 2,819 3.2 1,282 2.0 779 2.1 Rentals & Other Income (Net) 704 1.3 1,623 1.8 890 1.4 348 0.9
Total 52,722 100.0 89,034 100.0 62,553 100.0 37,207 100.0
Department Expenses
Rooms 11,027 34.3 18,140 33.7 11,802 32.9 8,644 35.7 Food & Beverage 14,771 83.7 24,253 85.1 19,404 82.4 9,538 84.3 Telecommunications 685 71.8 1,356 59.2 775 76.4 451 81.3 Other Operated Departments 852 69.0 2,129 75.5 924 72.1 464 59.6
Total 27,335 51.8 45,878 51.5 32,905 52.6 19,097 51.3
GROSS OPERATING INCOME
25,387
48.2 43,156 48.5 29,648 47.4 18,110 48.7 Undistributed Operating Expenses
Administrative & General 4,207 8.0 7,301 8.2 5,003 8.0 2,909 7.8 Marketing 2,442 4.6 5,239 5.9 2,618 4.2 1,577 4.2 Utility Costs 1,322 2.5 1,566 1.8 1,547 2.5 1,126 3.0 Property Operation & Maintenance 1,981 3.8 3,083 3.5 2,177 3.5 1,568 4.2
Total 9,952 18.9 17,189 19.3 11,345 18.1 7,180 19.3
Income Before Mgt Fees & Fixed Costs 15,435 29.3 25,967 29.2 18,303 29.3 10,930 29.4
Management Fees (Base + Inc.) 1,043 2.0 2,048 2.3 1,204 1.9 676 1.8
Income Before Fixed Costs 14,392 27.3 23,919 26.9 17,099 27.3 10,254 27.6
Note: Expense ratios to sales for departmental expenses are based on their respective departmental revenues. All other expense ratios to sales are based on total revenue.
Source: Hotel Industry Survey of Operations' 18th Edition, Horwath Asia Pacific TOTA
L
Table 5
Departmental Revenues and Expenses, 2002
Owner Rooms Properties (No.) (No.)
Tourism Asset Holdings Ltd 5,104 39
Grand Hotel Group 3,255 25
Thakral Holdings Limited 2,608 10 Six Continents Hotels & Resorts 2,591 12 Stamford Land Corporation Limited 2,002 9 General Property Trust (GPT) 1,932 5
Carlton Hotels 1,461 5
Principal Hotel Group (formerly BT
Hotel Group) 1,434 4
Travelodge 1,355 8
Daikyo Australia Pty Ltd 1,273 5
Table 7
Top 10 Tourist Accommodation Owners, 2002
Figure 2
Origin of Australian Tourist Accommodation Owners, 2002
59%
5% 4% 8% 16%
4%4%
Australia Japan Hong Kong Other Singapore Malaysia UK
Ranking Management Australian Rooms Under
2002 2001 Company Properties Management
1 1 Accor Asia Pacific Corporation (AAPC) 95 15,009 2 2 Six Continents Hotels & Resorts 27 6,062
3 4 Starwood Hotel & Resorts 13 4,140
4 3 Rydges Hotels & Resorts 22 4,097
5 8 Pacific international Hotels 22 3,045
6 6 Hilton Hotels of Australia 8 2,769
7 5 Touraust Hotels Pty Ltd 29 2,656
8 9 Mirvac Hotels 20 2,499
9 7 Hyatt Hotels & Resorts 8 2,498
10 10 Stamford Hotels & Resorts Pty Ltd 10 2,002
Table 8
Top Ten Tourist Accommodation Operators, 2002
Under % Proposed %
Construction Increase Increase
Sydney 0 0.0% 630 3.4%
Melbourne 884 6.3% 194 1.3%
Brisbane 0 0.0% 135 2.0%
Gold Coast 0 0.0% 760 5.8%
Cairns 142 2.1% 272 3.8%
Total 1,026 1.7% 1,991 3.3%
Source: Jones Lang LaSalle Hotels Rooms
Destination
Table 9
Figure 3
Major Hotel Transactions 1988 - 2002
Origin of Purchasers of Major Hotels by Value