Western University Western University
Scholarship@Western
Scholarship@Western
Electronic Thesis and Dissertation Repository
1-14-2013 12:00 AM
Change in pore size distribution of compacted soil layers and its
Change in pore size distribution of compacted soil layers and its
effect on solute breakthrough curves
effect on solute breakthrough curves
Sara Karimi
The University of Western Ontario
Supervisor Dr. Ernest Yanful
The University of Western Ontario
Graduate Program in Civil and Environmental Engineering
A thesis submitted in partial fulfillment of the requirements for the degree in Master of Engineering Science
© Sara Karimi 2013
Follow this and additional works at: https://ir.lib.uwo.ca/etd
Part of the Environmental Engineering Commons, and the Geotechnical Engineering Commons
Recommended Citation Recommended Citation
Karimi, Sara, "Change in pore size distribution of compacted soil layers and its effect on solute breakthrough curves" (2013). Electronic Thesis and Dissertation Repository. 1076.
https://ir.lib.uwo.ca/etd/1076
This Dissertation/Thesis is brought to you for free and open access by Scholarship@Western. It has been accepted for inclusion in Electronic Thesis and Dissertation Repository by an authorized administrator of
Change in pore size distribution of compacted soil layers and its effect on solute
breakthrough curves
(Spine title: Pore size distribution of glass beads-kaolinite mixtures and its effect on sodium and chloride breakthrough curves)
(Thesis format: Monograph)
By
Sara Karimi
Graduate Program in Civil and Environmental Engineering
A thesis submitted in partial fulfillment of the requirements for the degree of
Master of Engineering Science
ii
THE UNIVERSITY OF WESTERN ONTARIO
School of Graduate and Postdoctoral Studies
CERTIFICATE OF EXAMINATION
Supervisor
______________________________
Dr. Ernest Yanful
Supervisory Committee
______________________________
Examiners
______________________________ Dr. Tim A. Newson
______________________________ Dr. Abouzar Sadrekarimi
______________________________ Dr. Amarjeet Bassi
The thesis by
Sara Karimi
entitled:
Change in pore size distribution of compacted soil layers and its effect on solute breakthrough curves
is accepted in partial fulfillment of the
requirements for the degree of
Master of Engineering Science
iii
Abstract
It is often useful to predict contaminant migration from waste containment systems, such as
landfills, as part of the assessment of the overall impact of such systems on the receptor
environment. In many instances, material properties, for example, those of the liner, are assumed
to be constant. This study was conducted to evaluate the accuracy of considering constant
material and transport parameters in the modelling of sodium and chloride breakthrough curves
through a compacted soil layer using the commercial software, Pollute v.7. Experiments were
conducted with three different mixtures of glass beads and varying amounts of kaolinite (30, 40
and 50% by weight). The base line hydraulic conductivity K of the samples was established
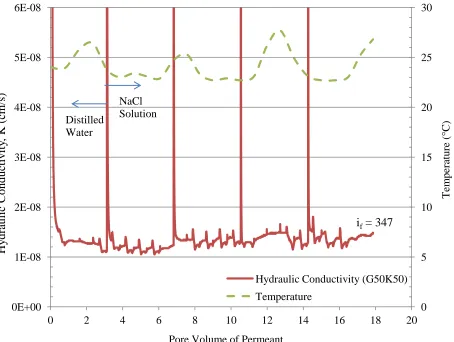
using distilled water as permeant. The observed values of K were 8.2X10⁻¹¹ m/s, 1.28X10⁻¹⁰ m/s and 1.48X10⁻¹⁰ m/s for the 30, 40 and 50% kaolinite, respectively. These values did not change when the permeant was changed from distilled water to 0.04 M NaCl Effective diffusion
coefficient of 3.5-8.5 x 10⁻¹⁰ m2/s was obtained for sodium and 1.9-4 x 10⁻¹⁰ m2/s for chloride. These results also showed that diffusion of both ions in the soils was affected by the percentage
of clay fraction. The greater the amount of clay, the lower the diffusion coefficient obtained.
Moreover, the diffusion coefficient of sodium was approximately two times that of chloride and
this trend was visually apparent from the shape of the breakthrough curves for Na+ and Cl-. Modelling with constant porosity overestimated the concentration of both ions. The pore size
distribution of each mixture was determined from mercury intrusion porosimetry testing before
and after hydraulic conductivity test. The results showed a decrease of 24%, 13% and 12% in the
porosity of the 30, 40 and 50% kaolinite mixture. Sensitivity analysis carried out by decreasing
the porosity of the mixture by these percentages did not alter breakthrough curves noticeably. On
the other hand, sensitivity analysis based on changes in the distribution coefficient and diffusion
coefficient showed a considerable change in model outputs. It was concluded that although the
porosity changed during hydraulic conductivity test, it did not eliminate the discrepancy between
experimental results and modelling results, In fact, the model was found to be more sensitive to
change in diffusion coefficient and distribution coefficient. Therefore, more studies are required
to monitor these parameters during hydraulic conductivity testing.
Keywords: diffusion coefficient, distribution coefficient, porosity,breakthrough curve, pore size
iv
Acknowledgement
I owe my deepest gratitude to my supervisor, Dr. Ernest Yanful, for all his support, guidance and
encouragement from the initial steps to final levels. This work would not have been possible
without his advice and unsurpassed knowledge. I am grateful for his continuous support and
encouragement in many respects other than research as well. I am also indebted to laboratory
technician, Tim Stephens, for his assistance in almost all the tests. I will never forget how patient
and kind he is. I would like to thank other laboratory staff, Wilbert Logan and Melodie Richards,
for their help during hydraulic conductivity test.
Very special thanks to administrative staff of civil and environmental engineering department,
Whitney Barrett, Stephanie Laurance, Cynthia Quintus and Connie Walters for their kindness
and support. I would also like to thank Paul Sheller, procurement Coordinator of engineering
store.
Words fail me to express my deepest appreciation to Navid Hatami, for being the best friend
ever; he was always a constant source of support and encouragement. He supported me in all and
every single step of this work from getting admission from university until submitting this thesis.
I will always remember all he did for me. My sincere thanks also go to my friends,
Venkateswara Reddy Kandlakuti, Naemeh Naghavi and Behrang Dadfar who were always
willing to listen to me, stand by me and help me to overcome the difficulties of this way.
I would like to dedicate this thesis to my parents, my sister and brother and my best friend,
Navid. Without their unending support and unconditional love, I could not have completed my
v
Table of Contents
Abstract ... iii
Acknowledgements ... iv
List of Tables ... vii
List of Figures ... viii
List of Symbols ... ix
Introduction ... 1
1.1. Problem Definition ... 1
1.2. Objectives of Study ... 4
1.3. Scope of Thesis ... 4
1.4. Thesis Outline ... 5
Literature Review ... 6
2.1. Waste Generation ... 6
2.2. Waste Management ... 7
2.3. Modern Landfill ... 8
2.4. Waste Stabilization ... 9
2.5. Leachate Generation and Composition ... 12
2.6. Effects of Leachates ... 14
2.6.1. Clayey Soil ... 14
2.6.2. Groundwater ... 15
2.7. Contaminant Transport Mechanism through a Liner ... 16
2.8. Contaminant Transport Modelling Approach ... 18
Materials and Methods ... 28
3.1. Materials ... 28
3.2. Methods... 28
3.2.1 Cation Exchange Capacity (CEC) ... 29
3.2.2 Hydraulic Conductivity Test ... 30
3.2.3 Batch Sorption Tests ... 37
3.2.4 Diffusion Tests ... 40
3.2.5 Water Samples Analysis ... 43
3.2.5.1 Solution Analysis for Cations ... 43
3.2.5.2 Solution Analysis for Chloride ... 43
vi
3.2.6.1 Freeze Drying ... 45
3.2.6.2 Mercury Intrusion ... 46
3.2.7 Computer Modelling ... 48
Results and Discussion ... 54
4.1. Soil Properties ... 54
4.2. Column Diffusion Test ... 58
4.3. Batch Sorption Studies ... 58
4.4. Hydraulic Conductivity ... 62
4.5. Effluent pH... 70
4.6. Effluent Electrical Conductivity ... 70
4.7. Solute Breakthrough Curves ... 73
4.8. Mercury Porosimetry Analysis ... 78
Conclusion and Recommendations ... 85
5.1. Conclusion ... 85
5.2. Recommendations for Future Studies ... 86
References ... 87
Appendix A ... 95
vii
List of Tables
Table 2.1: Range of concentration of Basic Parameters in MSW Landfill Leachate ... 22
Table 2.2: Heavy metals concentration in landfill leachate (Adopted from Renou 2008) ... 24
Table 2.3: Landfill leachate classification based on age (Adopted from Renou 2008) ... 24
Table 2.4: Selected leachate flow and transport models ithin landfills ... 25
Table 3.1: Physical Data of Glass Beads ... 52
Table 3.2: Chemical Composition/Heavy Metal Content of Glass Beads ... 53
Table 3.3: Sodium Chloride Specifications ... 53
Table 4.1: Physical properties of glass beads-kaoline mixtures used in study ... 55
Table 4.2: Chemical Properties of soils in this study... 57
Table 4.3: Distribution coefficient, diffusion coefficient and retardation factor of solutes ... 60
viii
List of Figures
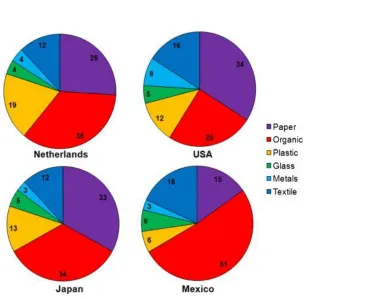
Figure 2.1: Composition of solid waste in different countries (OECD 2008) ... 20
Figure 2.2: Different methods contribution to municipal solid waste disposal in different countries ... 21
Figure 2.3: Typical modern sanitary landfill cross section ... 21
Figure 3.1: Different part of the fixed-wall hydraulic conductivity cell ... 49
Figure 3.2: Set up of hydraulic conductivity test ... 49
Figure 3.3: Schematic of hydraulic conductivity cell cross-section... 50
Figure 3.4: Schematic of diffusion cell ... 51
Figure 3.5: Diffusion test set up ... 51
Figure 3.6: schematic of IC instrumentation ... 52
Figure 4.1: Atterberg limits for different glass beads-Kaolinite mixtures ... 56
Figure 4.2: Compaction curves for glass beads-Kaolinite mixtures ... 56
Figure 4.3: Hydrometer analysis for kaolinite ... 57
Figure 4.4: Batch equilibrium test results for Sodium ... 61
Figure 4.5: Batch equilibrium test results for Chloride ... 61
Figure 4.6: Variation in hydraulic conductivity of G80K20 ... 64
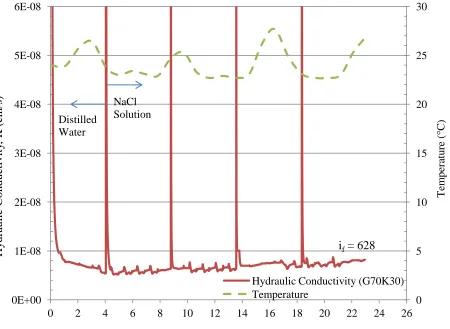
Figure 4.7: Variation in hydraulic conductivity of G70K30 ... 65
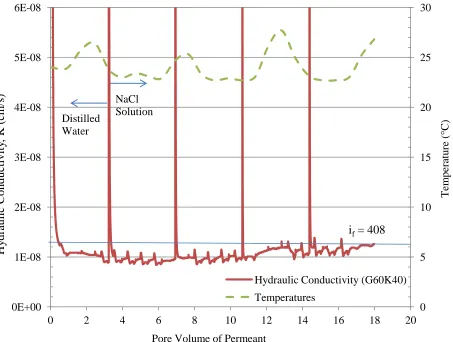
Figure 4.8: Variation in hydraulic conductivity of G60K40 ... 66
Figure 4.9: Variation in hydraulic conductivity of G50K50 ... 67
Figure 4.10: Turbidity in G80K20 effluent ... 68
Figure 4.11: Segregation of kaolinite and glass beads in G80K20 ... 68
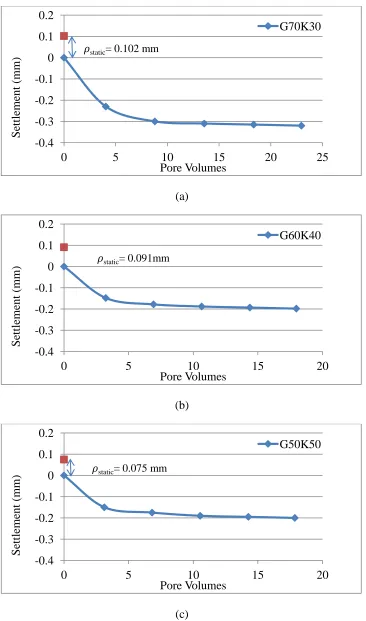
Figure 4.12: Settlement versus pore volumes during testing ... 69
Figure 4.13: pH curves versus net pore volumes ... 71
Figure 4.14: Variation in relative effluent electrical conductivity during permeation of soils with NaCl.. 72
Figure 4.15: Sodium breakthrough curves ... 75
Figure 4.16: Chloride breakthrough curves ... 77
Figure 4.17: Cumulative Intrusion versus Pore size ... 80
Figure 4.18: Sodium breakthrough curves (Adjusted porosity) ... 81
Figure 4.19: Sodium Breakthrough Curves (Adjusted Darcy velocity) ... 84
ix
List of Symbols
A Activity of soil
α Dispersivity
BOD Biochemical oxygen demand
C Solute concentration
Cb Background concentration of species in a soil
Ci Initial concentration
Ce Effluent concentration
Ct Species concentration in the source solution at time t
CEC Cation exchange capacity
COD Chemical oxygen demand
D Coefficient of hydrodynamic dispersion
De Effective diffusion coefficient
Dm Coefficient of mechanical dispersion
erfc Complementary error function
Kd Distribution coefficient
M Molar concentration of a solution
MIP Mercury intrusion porosimetry
MSW Municipal solid waste
Npv Number of pore volumes
Dry density
PI Plasticity index
pH Log10(Hydrogen ion concentration)
q Darcy velocity
R Retardation factor of contaminant species
1
Chapter1
Introduction
1.1. Problem Definition
Our society consumes and discards a diverse range of materials in the course of a wide range of
activities. The processes of accelerated population growth and urbanization translate into a
greater volume of wastes generated since urban population tends to have higher incomes, so
there will be higher rate of goods consumption and eventually higher generation of waste
compared to rural populations (OECD 2004).
In the past the waste used to be disposed of by dumping in uncontrolled landfills which had
adverse impact on local environment and human health. These damages include methane
production and greenhouse gas emission through anaerobic decaying of waste which can reach
explosive concentration and release to the atmosphere, leading to global warming problems and
threat to human health. Landfill leachate generation is another environmental hazard. Leachate
may form from moisture within the landfill itself, but the main source of landfill leachate is
natural precipitation, which filters down through the landfill and aids bacteria in the
decomposition process. Depending on what is in the landfill, this liquid (leachate) can carry with
it metals, alkaline, acid and organic materials and may be dangerously toxic. In the past, this
contaminated water was not well managed and was allowed to leak into the adjacent
environments and threatened groundwater and surface streams, making water supplies unsafe for
human and wildlife. Some of these older sites are still in use and are sources of pollution.
However currently the 3Rs concept – Reduce, Reuse, and Recycle – are being employed in
2
treatment or disposal. Internationally, about 70% of MSW is disposed of in landfills (OECD,
2001; Zacarias-Farah and Geyer-Allely, 2003). At this point, it is important to minimize the
human health and environmental effects by managing waste in an environmentally sound
manner. Sanitary landfilling is a preferred management option for the disposal of solid urban
waste. The use of sanitary landfills is widely accepted in many parts of the world because based
on comparative studies completed in some countries; it is the most economical option among the
various alternative disposal methods (Lema et al., 1988). Moreover, sanitary landfills allow
decomposition of most solid wastes under more or less controlled conditions, until their final
transformation into relatively inert, stabilized materials (Tatsi et al., 2002). Modern landfills are
often designed to prevent liquid from leaching out and entering the environment. In addition,
many new landfills collect harmful landfill gas emissions and convert them to energy (USEPA
2012). In fact, they are designed and located in a way to minimize both social and environmental
impacts. To achieve this goal, a waste containment system which acts as a barrier to the outside
environment is required. The top barrier in the containment system is the landfill cover which
will not be discussed here as it is outside the scope of this study. The other barrier is the landfill
liner located at the base and sides which should have a minimum permeability and thickness,
depending on the type of the waste allowed to be deposited in the site. Liners are constructed
from natural clay or composite materials that have some important advantages over natural liners
(Giroud and Bonaparte 1989; Giroud et al. 1992; Daniel 1993; Rowe et al. 1995; Van Impe
1998). However, the use of these kinds of liners has several problems such as long-term
durability and compatibility and sensitivity to stress cracking failure. The other problem is the
3
have to import these materials. So, natural clayey soils are more cost-effective but need to be
assessed adequately to make sure they are safe.
The compatibility of different types of clayey soil and municipal solid waste has been studied
over the past years (Fernandez and Quigley 1985; Rowe et al. 1995; Thorton et al. 2000;
Frempong et al. 2008) and there is a large database in the literature about it. Although sanitary
landfills help to reduce the adverse impacts of leachate, the long-term performance operation of
liners is still matter of concern. As stated in the USEPA Solid Waste Disposal Criteria (August
30, 1988a), the release of contaminants to the environment may be delayed but even the best
liner and leachate collection system will eventually fail and the waste will represent a threat as
long as it is in the landfill. Hence, future concerns of landfills should be taken into consideration
to the greatest possible extent during the design of landfills. Soil and leachate properties, as well
as soil-leachate interaction are used for modelling of contaminant transport through landfill liners
to evaluate their long-term performance and efficiency. Although there are published data on
modelling of solute breakthrough curves from different methods and their comparison with
laboratory experiments in the literature, they all assume that soil properties are constant during
the life of the landfill and none of them considers variable soil properties over time. The present
study was undertaken to fill part of this gap and try to interpret the discrepancy between
experimental breakthrough curves and model predictions observed in previous studies
4
1.2. Objectives of Study
As stated above, input data are considered constant during breakthrough curve modelling
which may not be true and this assumption may result in underestimation or overestimation
of the flux of contaminant that enters the environment in the long term and can considerably
affect the landfill design consideration. In this study, the effective porosity as an effective
parameter in breakthrough curve modelling is assessed; thus the objectives of study are to:
1) Establish experimental breakthrough curves of sodium and chloride through glass beads
samples mixed with different amounts of kaolinite.
2) Model breakthrough curves of sodium and chloride with the commercial software,
Pollute7 and compare with the experimental results.
3) Develop the pore size distribution graph versus time during the experiments and assess its
effect on discrepancy between the experiment and modelling.
4) Assess the overall accuracy of maintaining constant properties over time during
modelling.
1.3. Scope of Thesis
The following tasks were performed in the research:
1) Determination of soil properties before and after permeation with permeant
2) Determination of hydraulic conductivity of soils when permeated with sodium chloride
solution
3) Performance of batch sorption and column diffusion tests to determine distribution
coefficient and diffusion coefficient
5
5) Modelling of sodium and chloride breakthrough curves obtained during hydraulic
conductivity test
1.4. Thesis Outline
This thesis is divided into five chapters and two appendices. Chapter 1 is an introduction to
this study which highlights its necessity and also includes its objectives and scope. Literature
relevant to the research is reviewed and summarized in Chapter 2. A review is carried out on
waste generation and disposal. Problems arising from landfilling as a common way of
disposing of generated municipal solid waste are described and Contaminant transport
mechanisms and factors that influence them are also discussed.
Chapter 3 deals with materials and methods adopted in the experiment and covers procedures
for batch sorption, column diffusion and hydraulic conductivity tests and pore size
distribution determination. The experimental results analysis, details of breakthrough curves
modelling using Pollute7 and their comparison with experimental results are discussed in
chapter 4. Chapter 5 (last chapter) presents the study conclusion and recommendations for
6
Chapter 2
Literature Review
2.1. Waste Generation
Municipal solid waste, commonly known as trash or garbage, is defined as material thrown
away as unusable which originate from agricultural, commercial, domestic, industrial and
institutional solid wastes (Ramachandra, 2009). As shown in Figure 2.1, waste composition
varies widely in various regions and countries as it is very dependent on local condition such
as socio-economic factors, geographic location and climate, level of industrialisation and also
on method of reporting, classification and degree of recycling (OECD 2008). The global
generated waste is about 1636 million tonnes per year and it continues to rise (OECD 2008;
UNEP 2004) which can be partly related to changing patterns of consumption and population
increase. In this regard, high-income countries also have higher waste production per capita
compared to poorer countries. Lacoste and Chalmin (2006) showed that the United States of
America generated the highest quantity of waste per capita among all western countries in
2004. This volume of waste is a major challenge for any society and proper management,
which includes collection, transport, treatment and disposal, is required to handle it. Proper
management is also important because It is also crucial as it reduces public safety risks,
contributes to sustained economic activity, and enhances public welfare (United Nations
7
2.2. Waste Management
Nowadays, solid waste management is focused on developing environmentally sound
methods of getting rid of trash. For example, solid waste is no longer dumped into oceans or
in unlined landfills as it used to be the case. The main operating philosophy in most existing
waste management programs is waste reduction, reusing, recycling and safe disposal (Fifth
Environmental Action Programme, 1993-2000); however, management practices can differ
for developed and developing countries and they also depend on waste composition. Figure
2.2 shows the contribution of different waste management methods in some countries around
the world (European Commission 1997-2010; EPA 2009).
Waste reduction is defined as any process or techniques that result in preventing or reducing
waste at its source (Crittenden and Kolaczkowski 1995) and it is both environmentally and
economically beneficial. Reusing a product more than once or reusing it in another
application extends its lifespan and therefore reduces the quantity of waste requiring
treatment and disposal. So, there will be a saving in raw material and energy costs.
Collection, separation, clean-up and processing of waste material to produce a new
marketable product is recycling and can be done in the manufacturing process or at the
consumer stage. According to OECD 2004, there has been a remarkable increase in the level
of recycling throughout the world. Although these 3Rs have reduced the amount of waste,
there are still some residuals that need to be disposed and the majority of them end up in
landfills as a controlled system. Landfills are still widely accepted and used in many parts of
the world because of financial advantages (Lema et al. 1988; El-fadel 1997) and suitability
for a wide variety of wastes, especially in developing countries that do not have sufficient
8
a source of some environmental concerns, such as greenhouse gas emissions, leaching of
toxic compounds and land use pressures. To minimize the side effects of landfills, some
regulation in their design and construction is generally imposed and the operation is
controlled during the life of the landfill.
2.3. Modern Landfill
Landfills were built without engineering considerations, such as use of liners and leachate
collection systems. During this period, the practice was to cover the waste in open dumps
with soil to control negative consequences, such as vermin growth and odour. However,
there were still two other main complications: first methane gas production through
anaerobic decomposition of waste which leads to global warming and, also, the production of
toxic leachate that threatened groundwater and surface water resources. Therefore, new
standards and regulations for landfills operation were enacted in the United States of
America in the 1970s leading to the development of sanitary landfills (United Nations
Publication 2011). Modern engineered landfills are designed based on two basic principles,
containment and attenuation. The protective lining have a minimum thickness and a
maximum permeability in order to prevent leachate leakage and piping at the bottom of the
landfill as leachate collection was part of the requirement of the enhanced design elements
(Porter, 2002). Further engineering elements included the construction of collection ponds
for the leachate treatment to remove pollutants to environmentally acceptable levels,
installation of venting tubes to extract generated methane gas and waste burial on a daily
9
section of a typical sanitary landfill is illustrated in Figure 2.3 (Environmentalists Every Day,
2012).
The construction and operational costs of sanitary landfills increased because of all these
regulations and caused significant reduction of the total number of landfills in many
countries. For example, in the United States the number of landfills reduced from about
20,000 in the early 1970s to barely 2,000 by 1998 (Porter, 2002). The high costs of modern
landfills also meant open-dumps remained the main waste-disposal methods in some
developing countries. Older landfill sites must be dug up, and a new impermeable liner must
be installed, or the material must be moved to another site. However, even if this is done, the
damage would have already been done and it may take a long time before the area can fully
recover.
2.4. Waste Stabilization
The deposited waste undergoes a series of biological, physical and chemical processes as it
decomposes and waste stabilization occurs in the following four phases (Christensen and
Kjeldsen, 1995; Bozkurt et al., 2000):
(1) An initial aerobic phase
(2) An anaerobic acid phase
(3) An initial methanogenic phase
(4) A stable methanogenic phase
Also, an additional aerobic phase of decomposition was proposed by Bozkurt et al. ( 2000).
10
more than the depletion rate of microbial oxygen. Therefore, over time the anaerobic landfill
is hypothesized to become an aerobic ecosystem.
During the aerobic phase, the oxygen present in the void space of buried waste is consumed
rapidly and this results in carbon dioxide production. This reaction is exothermic and can
result in waste temperature of up to 60°C (Farquhar and Rovers 1973). The waste typically is
not at field capacity during the aerobic phase (Barlaz and Ham, 1993) and most produced
leachate is from released moisture during compaction and also short-circuiting of
precipitation through the buried refuse. Field capacity is the maximum moisture content that
can be retained without downward percolation. As oxygen is not replenished once the refuse
is covered, the aerobic phase lasts a few days. Due to the depletion of oxygen within the
landfill, the waste becomes anaerobic and fermentation reactions occur. The major
biodegradable constituents of MSW are cellulose and hemicellulose (Barlaz et al., 1989b)
and their biodegradation is carried out by three groups of bacteria, these compounds are
decomposed to methane and carbon dioxide in landfills under anaerobic conditions (Barlaz et al., 1990; Pohland and Harper, 1986; Bookter and Ham, 1982).In this phase the hydrolytic,
fermentative, and acetogenic bacteria dominate and result in carboxylic acids accumulation,
and pH decrease. The highest concentration of BOD and COD in the leachate is generally
observed during the second phase (Barlaz and Ham, 1993; Reinhart and Grosh, 1998). The
reported value for BOD:COD ratio in the acid phase is above 0.4 (Ehrig,1988) or 0.7
(Robinson, 1995). The leachate in this phase is chemically aggressive because of the acidic
pH and will increase the solubility of many compounds (Kjeldsen 2002).
The third phase, initial methanogenic phase, starts when measurable amounts of methane are
11
methane and carbon dioxide and the methane production rate increases (Christensen and
Kjeldsen, 1989, Barlaz et al., 1989a). As acids are consumed, BOD
and COD concentrations will decrease and pH will increase. The consumption of carboxylic
acids causes a decrease in BOD to COD ratios. Methane production rate reaches its
maximum and then drops after as carboxylic acids decrease and because carboxylic acids
consumption is as rapid as their production, the BOD:COD ratio generally will fall below
0.1. In theory, after this phase, refuse decomposition will continue until no more degradation
occurs and the landfill becomes aerobic.
The progress rate through these phases is dependent on the existing physical, chemical and
microbiological conditions within the landfill (Pohland and Harper 1985; Reinhart and Grosh
1998). Some of the factors affecting refuse decomposition have been summarized in earlier
studies (Barlaz et al., 1990; Christensen et al., 1992) and moisture content has most
consistently been shown to affect the waste decomposition rate. It is generally accepted that
refuse decomposition in arid climates progresses much slower than in regions that receive
more than 50 to 100 cm of annual infiltration into the waste. As waste burial in landfills takes
place over many years, different parts of the landfill can be in different decomposition stages.
Therefore, leachate composition can vary throughout a landfill because of a strong
relationship between the state of refuse decomposition and its associated leachate properties.
An understanding of leachate composition is crucial for predictions of the long-term impacts
12
2.5. Leachate Generation and Composition
Leachate is generated when the waste moisture content exceeds its field capacity and the
magnitude of gravitational forces exceeds moisture holding forces which are surface tension
and capillary pressure (El-Fadel et al. 1997). In leachate formation, soluble compounds
which are generally encountered in the refuse at emplacement, or are formed in chemical and
biological processes, are removed by the non-uniform and intermittent percolation of water
through the refuse mass. Precipitation, irrigation and runoff are the primary sources of
percolating water and cause infiltration through the landfill cover. Ground water intrusion,
and to a lesser extent, the initial refuse moisture content can be sources of this free water as
well and in smaller amount, waste decomposition due to microbial activity may also
contribute to leachate formation (Public administration service 1970; El-Fadel et al. 1995).
The factors that influence leachate generation can be divided in two groups. Those that
contribute landfill moisture directly such as precipitation, irrigation, initial moisture content,
groundwater intrusion, recirculation and refuse decomposition and other factors such as
waste age, particle size distribution of waste, refuse density, settlement, cover and liner
material affect moisture and leachate distribution within the landfill. Leachate generation
prediction based on the knowledge of basic hydrological factors has been mathematically
modelled. (Lema et al., 1988)
It has been shown that there is a large variation in leachate composition for different landfills
and even for different parts of the same landfill (Robinson and Luo, 1991). There is a
comprehensive discussion about controlling factors on leachate composition in the literature
(Lu et al. 1985, Reinhart 1993, Qasim and Chiang 1994, Britz 1995, Robinson 1995,
13
landfill leachate composition are site management and operational procedures such as refuse
pre-treatment, irrigation, recirculation and liquid waste disposal; refuse characteristics such
as waste age, waste composition and degree of waste stabilization Other factors include
internal reactions such as biodegradation, speciation, dissolution, ion exchange, contact time,
gas and heat generation and transportation (Hoeks and Harmsen, 1980; Parker and Williams,
1981; Harmen, 1983; Pohland et al., 1983, El-fadel et al. 1997). However, in particular, the
leachate composition varies greatly depending on landfill age (Baig et al. 1999). MSW
landfill leachate constituents can be divided into four groups:
Dissolved organic matter, quantified as COD (Chemical Oxygen Demand) or TOC (Total
Organic Carbon), volatile fatty acids (that accumulate during the acid phase of the waste
stabilization, Christensen and Kjeldsen, 2002) and more refractory compounds such as
fulvic-like and humic-like compounds.
Inorganic macro-components: calcium (Ca2+), magnesium (Mg2+), sodium(Na+),
potassium (K+), ammonium (NH4+), iron (Fe2+), manganese (Mn2+), chloride (Cl–), sulfate ( SO42–) and bicarbonate (HCO3
– ).
Heavy metals: cadmium (Cd2+), chromium (Cr3+), copper (Cu2+), lead (Pb2+), nickel
(Ni2+) and zinc (Zn2+).
Xenobiotic organic compounds (XOCs) originating from domestic or industrial
chemicals and present in relatively low concentrations (usually less than 1 mg/L of
individual compounds). Other compounds such as borate, sulfide, arsenate, selenate,
barium, lithium, mercury, and cobalt may also be found in leachate at very low
14
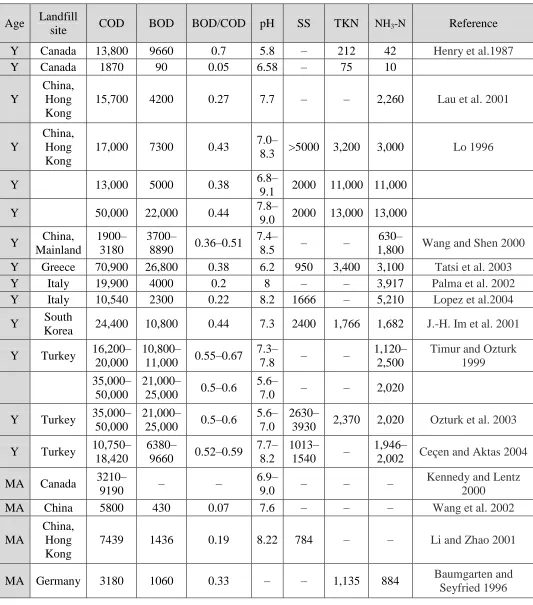
Basic parameters like COD, BOD, the ratio BOD/COD, pH, suspended solids (SS),
ammonium nitrogen (NH3-N), total Kjeldahl nitrogen (TKN) and heavy metals can
usually represent the leachate characteristics (Renou et al. 2008). Tables 1 and 2
summarize the range of these parameters in landfill leachate. Although leachate
composition may vary widely within four phases of waste evolution, three types of
leachates- recent, intermediate and old- have been defined based on landfill age (Table 3,
Chian, and DeWalle 1976). Dramatic change occurs in several parameters as the landfill
stabilizes. For example, the pH value is low during the acid phase and the concentrations
of many compounds are high, specifically easily degradable organic compounds, such as
volatile fatty acids. However, in the stable methanogenic phase, the pH increases and the
biological oxygen demand measured over 5 days divided by chemical oxygen demand
(BOD5/COD) which reflects the organic carbon degradability is lowered significantly
(Ehrig, 1988). Hazardous constituents, such as volatile organic compoundsandheavy
metals are present in MSW leachate and the release of leachate to the groundwater can
pose several risks to human health and to the environment.
2.6. Effects of Leachates
2.6.1. Clayey Soil
Various complex interactions can occur between clay minerals and landfill leachate
constituents (Rowe, 1987) which are dependent on physical and chemical properties of both
of them. The performance of clayey soils as liners can be affected by these interactions. The
processes involved in these interactions include clay mineral transformations, cation
15
clays collapse and change to that of illite because of cation exchange with leachate
constituents (Batchelder et al. 1996, 1997a & b). The illitic clay agglomeration and decrease
in double layer thickness lead to an increase in clay hydraulic conductivity up to three orders
of magnitude (Quigley et al. 1988). Batchelder et al (1997b) reported that the rate of
structural change is dependent on the leachate ionic strength and reaction temperature.
Solutions with relatively high ionic concentrations of landfill leachate cause crystals collapse
in a few seconds and higher temperature also result in increase in the rate of reactions.
Weaker solutions have a slower influence but they still run to completion. However,
previously it was assumed that illitic clays did not react with leachates; more recent studies
suggest that illitic and kaolinitic clays may also undergo structural changes such as
fluctuation and dispersion at a slower pace (Joseph et al. 2001). There is a well-documented
study of landfill leachate impacts on clayey soils in the literature (Mitchell 1993; Cancelli et
al. 1995; Rowe et al. 1995; Batchelder et al. 1997).
2.6.2. Groundwater
Once leachate is formed and reaches the bottom of landfill it can move through the liner to
subsurface formation. Groundwater is a main source of drinking water in many countries and
the release of pollutants from landfill leachate poses a risk to groundwater if not controlled
adequately (Ikem et al. 2002). Additionally, the contamination can continue to move through
the groundwater and finally reach where it discharges (streams, wetlands and lakes) and may
lead to loss of aquatic life and change in local ecosystem. Leachate impacts on groundwater
continue to raise concern and have been widely investigated (Kjelsen et al., 2002; Ahmed
16
Cariera and Masciopinto, 1998; Loizidou and Kapetanios, 1993; Gallorini et al., 1993; Khan
et al., 1990; Kunkle and Shade, 1976).
Municipal solid waste leachates contain a wide range of inorganic compounds and also
volatile organic compounds (VOCs) at lower concentrations (Rowe, 1998; Foose 1997). It
has been shown that the transport of volatile organic compounds generally is more critical
than the transport of inorganic compounds (e.g. toxic heavy metals) as VOCs are generally
toxic at lower concentrations than many inorganic compounds and they diffuse readily
through geomembrane polymers (Park & Nibras, 1993, Park et al., 1996, Brown & Thomas,
1998, Haxo & Lahey, 1988, Mueller et al., 1998, Friedman, 1988, Foose et al., 2001 and Kile
et al., 1995). Moreover, the organic compounds and heavy metals may be toxic, corrosive,
flammable, reactive and carcinogenic (Slack et al.2005). Accordingly, the liner system is one
of the most crucial elements of a modern engineered landfill which should prevent or
minimize the migration of contaminants into surrounding soil and groundwater.
2.7. Contaminant Transport Mechanism through a Liner
The movement of contaminants through a porous medium occurs through three mechanisms.
Advection is the transportation of dissolved contaminants by flowing groundwater at its
average linear velocity and is governed by Darcy’s Law, with the Darcy flux, va, given by:
va = -ki (2.1)
Where k is the hydraulic conductivity (permeability coefficient) and i is the hydraulic
gradient, which is often controlled by the level of mounded leachate on the landfill liner
(Rowe 2005). As the mass of contaminant flows through the medium, the solute spreads due
17
mass because of the deflection is dispersion. The second mechanism, diffusion, is the
movement of contaminants from an area of high concentration to one of low concentration
and can happen in the absence of any bulk air or water movement. Diffusive transport is
generally governed by Fick’s laws, with the diffusive flux f given by:
f = - Ddc/dz (2.2)
Where D is the diffusion coefficient and dc/dz is the concentration gradient. The apparent
contaminant diffusion through a porous media is a complicated process that involves
molecular diffusion because of concentration gradient. However, it is also influenced by
other parameters such as the complex tortuosity of the porous media, osmotic flow, electrical
imbalance, and possible anion exclusion (Rowe et al. 2004). Although early concerns about
clay liners focused on their hydraulic conductivity and their ability to limit contaminant
migration by advection (Daniel, 1984; Anderson et al., 1985, Fernandez and Quigley, 1988),
later research showed that a clay liner with acceptable hydraulic conductivity can be
constructed if construction is done carefully. Some previous studies have suggested that
municipal solid waste landfill leachate does not influence the hydraulic conductivity of
clayey liners detrimentally (Bowders and Daniel, 1987; Yanful et al., 1990; Kim et al., 2001;
Berger et al., 2002; Kalbe et al., 2002). It has also been shown that in well-built liner
systems, the dominant contaminant transport mode is via diffusion and considering the
leakage rate as the only mode of migration may be misleading (Crooks and Quigley, 1984;
Shackelford, 1990; Rowe et al., 1995; Kim et al., 2001; Foose et al., 2002; Kalbe et al.,
2002). In many practical situations, the one dimensional contaminant transport of a single
reactive solute in a porous medium involves solving the following equation by applying
18
(2.3)
Where c is the contaminant concentration at depth z and time t, n is the effective porosity, De
is the effective diffusion coefficient, ρd is the dry density, and Kd is the partitioning coefficient. Biodegradation of organic wastes generate heat which can influence the liner
temperature and consequently the contaminant transport as both Kd and De are dependent on temperature.
In addition, retardation mechanisms that include dilution, sorption, precipitation,
volatilization, radioactive and biological decay, may affect contaminant transport through a
clay liner. Sorption is defined as contaminant removal from solution by solid matter (e.g.
clay particles or organic matter) and can be further divided into adsorption and absorption.
The former refers to adhesion of contaminant to the surface of a solid while the latter implies
a more or less uniform penetration of the solid by a contaminant. As discharged leachate
from landfills is the primary source of the organic and inorganic contaminants release to
surrounding environment, an understanding of processes and factors controlling the release
and migration of these contaminants in the landfill is essential.
2.8. Contaminant Transport Modelling Approach
Transport mechanisms of contaminants through a liner are individually well understood and
can be reasonably modelled in a laboratory but their interactions in a landfill are still not well
understood (El-Fadel et al. 1997b) and are associated with a high degree of uncertainty
(Bou-Zeid 2004). Numerous studies have been conducted to investigate pollutant mobility through
landfill liners (Foose et al., 2002; Kalbe et al., 2002; Baun et al., 2003; Edil, 2003; Lo et al.,
19
solution for the transport equation based on the modelled system properties for a wide range
of flow and transport problems such as one, two or three dimensional, transient and steady
state transport, saturated or non-saturated state in a fractured or non-fractured medium have
been developed, however, none of them can simulate these processes in a reasonable degree
of scientific certainty because of inadequate field data and, also, because of insufficient
understanding of the biochemical transformation and biodegradation processes. Numerical
methods based on the finite difference or finite element techniques are commonly used to
solve the transport equations, especially for non-homogenous systems with complicated
geologic properties; descriptive summary of selected models is presented in Table 2.4.
An inherent assumption in these models is that landfill condition and input parameters
remain uniformly constant which is unlikely as landfill undergoes physical, chemical and
biological interactions during its operation and after closure (El-Fadel 1997). Developing a
comprehensive, integrated model would lead to a better understanding of a landfill
environment and consequently a better control of its negative environmental effects can be
achieved. Several software packages, such as EnviroScape, Migrate and Multimed for
Windows, have been developed which simulate contaminant migration in a porous medium
based on properties of leachate and ecosystem. The software used in the current study was
Pollute which has been utilized in landfill design and remediation industry for over fifteen
years and the designs that can be considered range from simple systems on a natural clayey
aquitard to composite liners, multiple barriers and multiple aquifers. This program
implements a one and a half dimensional solution to the advection-dispersion
equation. Unlike finite element and finite difference formulations, POLLUTEv7 does not
20
while also avoiding the numerical problems of alternate approaches. In addition to
advective-dispersive transport, POLLUTEv7 can consider non-linear sorption, radioactive and
biological decay, transport through fractures, passive sinks, phase changes and time-varying
properties.
21
Figure 2.2: Different methods contribution to municipal solid waste disposal in different countries (European commission 1997-2010; EPA 2009).
22
Table 2.1: Range of concentration of Basic parameters in MSW landfill leachate (Adopted from Renou 2008)
Age Landfill
site COD BOD BOD/COD pH SS TKN NH3-N Reference
Y Canada 13,800 9660 0.7 5.8 – 212 42 Henry et al.1987
Y Canada 1870 90 0.05 6.58 – 75 10
Y
China, Hong Kong
15,700 4200 0.27 7.7 – – 2,260 Lau et al. 2001
Y
China, Hong Kong
17,000 7300 0.43 7.0–
8.3 >5000 3,200 3,000 Lo 1996
Y 13,000 5000 0.38 6.8–
9.1 2000 11,000 11,000
Y 50,000 22,000 0.44 7.8–
9.0 2000 13,000 13,000
Y China, Mainland
1900– 3180
3700–
8890 0.36–0.51 7.4–
8.5 – –
630–
1,800 Wang and Shen 2000 Y Greece 70,900 26,800 0.38 6.2 950 3,400 3,100 Tatsi et al. 2003
Y Italy 19,900 4000 0.2 8 – – 3,917 Palma et al. 2002
Y Italy 10,540 2300 0.22 8.2 1666 – 5,210 Lopez et al.2004 Y South
Korea 24,400 10,800 0.44 7.3 2400 1,766 1,682 J.-H. Im et al. 2001 Y Turkey 16,200–
20,000
10,800–
11,000 0.55–0.67 7.3–
7.8 – –
1,120– 2,500
Timur and Ozturk 1999 35,000–
50,000
21,000–
25,000 0.5–0.6
5.6–
7.0 – – 2,020
Y Turkey 35,000– 50,000
21,000–
25,000 0.5–0.6
5.6– 7.0
2630–
3930 2,370 2,020 Ozturk et al. 2003 Y Turkey 10,750–
18,420
6380–
9660 0.52–0.59 7.7–
8.2
1013–
1540 –
1,946–
2,002 Ceçen and Aktas 2004 MA Canada 3210–
9190 – –
6.9–
9.0 – – –
Kennedy and Lentz 2000
MA China 5800 430 0.07 7.6 – – – Wang et al. 2002
MA
China, Hong Kong
7439 1436 0.19 8.22 784 – – Li and Zhao 2001
MA Germany 3180 1060 0.33 – – 1,135 884 Baumgarten and
23
Age Landfill
site COD BOD BOD/COD pH SS TKN NH3-N Reference
MA Germany 4000 800 0.2 – – – 800 Dijk and Roncken
1997 MA Greece 5350 1050 0.2 7.9 480 1,100 940 Tatsi et al. 2003 MA Italy 5050 1270 0.25 8.38 – 1,670 1,330 Frascari et al. 2004
MA Italy 3840 1200 0.31 8 – – – Chianese et al. 1999
MA Poland 1180 331 0.28 8 – – 743 Bohdziewicz et al.
2001
MA Taiwan 6500 500 0.08 8.1 – – 5,500 Wu et al. 2004
MA Turkey 9500 – – 8.15 – 1,450 1,270 Kargi and Pamukoglu
2003
O Brazil 3460 150 0.04 8.2 – – 800 Silva et al. 2004
O Estonia 2170 800 0.37 11.5 – – – Orupold et al. 2000
O Finland 556 62 0.11 – – 192 159 Hoilijoki et al. 2000
O Finland 340–
920 84 0.09–0.25 7.1–
7.6 – –
330–
560 Marttinen et al. 2002 O France 500 7.1 0.01 7.5 130 540 430 Trebouet et al. 1999
O France 100 3 0.03 7.7 13–
1480 5–960 0.2 Tabet et al. 2002
O France 1930 – – 7 – – 295 Gourdon et al. 1989
O Malaysia 1533–
2580 48–105 0.03–0.04 7.5–
9.4
159–
233 – – Aziz et al. 2004
O South
Korea 1409 62 0.04 8.57 404 141 1,522 Cho et al. 2002 O Turkey 10,000 – – 8.6 1600 1,680 1,590 Uygur and Kargi 2004
24
Table 2.2: Heavy metals concentration in landfill leachate (Adopted from Renou 2008)
Age Landfill
site Fe Mn Ba Cu Al Si Reference
Y Italy 2.7 0.04 – – – – Lopez et al. 2004
MA Canada 1.28– 4.90
0.028– 1.541
0.006– 0.164 –
<0.02– 0.92
3.72–
10.48 Kennedy and Lentz 2000
MA Hong
Kong 3.811 0.182 – 0.12 – – Li and Zhao 2001 MA South
Korea 76 16.4 – 0.78 – – J.-H. Im et al. 2001
MA Spain 7.45 0.17 – 0.26 – – Rivas et al. 2003
O Brazil 5.5 0.2 – 0.08 <1 – Silva et al. 2004 O France 26 0.13 0.15 0.005–
0.04 2 <5 Tabet et al. 2009 O Malaysia 4.1–
19.5 15.5 – – – – Aziz et al. 2004
O South
Korea – 0.298 – 0.031 – – Cho et al. 2002
Y: young; MA: medium age; O: old; all values are in mg L−1.
Table 2.3: Landfill leachate classification based on age (Adopted from Renou 2008)
Recent Intermediate Old
Age (years) <5 5–10 >10
pH 6.5 6.5–7.5 >7.5
COD (mg L−1) >10,000 4000–10,000 <4000
BOD5/COD >0.3 0.1–0.3 <0.1
Organic compounds 80% volatile fat acids (VFA)
5–30% VFA + humic and fulvic acids
Humic and fulvic acids
Heavy metals Low–medium Low
25
Table 2.4: Selected leachate flow and transport models within landfills
Reference Model Description
Fuller et al. 1979 Adopted an existing analytical solution to predict the movement of Cd, Ni and Zn using parameters from disturbed soil columns and municipal solid waste leachate. The model described the effect of longitudinal diffusion in labarotary columns where, unlike in landfills, chemical and physical parameters are well controlled.
Straub, 1980; Strub and Lynch, 1982
Applied numerical models to water flow and contaminant transport, dissolution and decay in unsaturated sanitary landfills. The model application is limited to simulating the production and removal of organic substrates.
Bernades, 1984 Developed a model describing fixation of heavy metals in the co-disposal of industrial sludge with domestic solid waste. The model suffers from a lack of real values for its inputs parameters.
Korfiatis, 1984 Korfiatis et al., 1984
Analyzed leachate flow through refuse of a laboratory column using the theory of unsaturated flow through porous media. Leachate quality and solute transport were not modelled.
Demetracopoulos et al.,
1982, 1984, 1986, 1987
Based on the work of Korfiatis et al. and Erdogan, they improved numerical techniques to simulate leachate generation and transport through solid waste landfills. No comparison with actual field data was presented.
Papadopulos, 1988 Developed a mathematical model to simulate the transport of a single chemical species in solid waste to the landfill boundary based on the simultaneous flow of gas and water in unsaturated porous media. Development of this model discontinued prior to complete validation and no results simulating field or laboratory data were reported.
Noble et al., 1989 Developed a one-dimensional finite difference model (FULLFILL) to evaluate moisture transport and distribution in landfills. Experiments were conducted in conjunction with this modelling effort to obtain calibration data.
Lu and Bai, 1991 Developed a mathematical model to simulate leaching from solid waste landfills. The model suffers from need of many parameters that are usually are not readily available at landfill sites. Indeed, a sensitivity analysis showed that at least eight parameters strongly affect the model simulations.
Al-soufi, 1991 Developed a three-dimensional model to simulate water and solute movement through the soil and applied the model at a landfill site. Although the model provides a comprehensive framework to model leachate behaviour in landfills, it suffers from the need of many parameters that are not usually readily available at landfill sites.
Findikakis and Ng, 1991
26
Reference Model Description
transport and dilution of leachate discharge from the landfill in the harbour due to tidal circulation and dispersion. The application of this model is site specific and depends on the estimation of many parameters. It illustrates however, the usefulness of combining existing models to simulate leachate behaviour.
Reinhart et al., 1991 Used the Vadose Zone interactive processes (VIP) model to simulate the fate of organic constituents co-disposed in municipal refuse landfill. Although the model reportedly provided a good fit with column data, its application is limited due to the uncertainty associated with its input parameters, particularly at actual landfill sites.
Krom et al., 1991 Applied the model VS2D to help explain observed measurements and simulate the effect of proposed waste disposal solutions. The model does not account for leachate quality.
Vincent et al., 1991 Presented a model to describe the leachate flow, chemical transport and biodegradation in landfills. The model was used to simulate experimental data. The authors recommended the incorporation of additional processes to describe physcio-chemical reactions in landfill. Additional experiment work was being pursued to refine the basic biological and physcio-chemical components of the model
Batchelor, 1992 Developed a numerical model that describes leaching from solidified/stabilized wastes by simulating chemical and physical mechanisms. The model addresses only leachate quality. It does not simulate leachate quantity or moisture routing. The model was applied to simulate data from laboratory leach tests.
Al-Yousfi, 1992 Developed a model (PITTLEACH-2) to simulate leachate quantity and quality, as well as biogas generation, at sanitary landfills. The uncertainty associated with parameter estimation was not addressed.
Ahmed, 1992 Ahmed et al., 1990
Presented two-dimensional unsteady state Flow Investigation for Landfill Leachate (FILL) to describe the leachate flow process in a landfill. Although the model reportedly provided a good simulate with field data, its application is limited to quantifying the amount of the leachate and does not address leachate quality.
Ballestero and de Castro, 1993
Presented a one-dimensional model that simulates the generation of landfill leachate due to large precipitation events. Although the model reportedly provides good predictions of landfill leachate behaviour, the authors recognized the limitations and the difficulty in obtaining the hydraulic properties of the landfill layers. The uncertainty associated with estimating other model parameters was not addressed. Leachate quality was also not simulated in this modelling effort.
Khanbilvardi and Ahmed, 1993; Khanbilvardi et al., 1992, 1995
27
Reference Model Description
Leachate quality was not addressed in this modelling effort.
Riester, 1994 Presented a numerical model that includes three-dimensional moisture transport coupled with two-dimensional surface runoff and one-dimensional liner flow. The model was used to simulate leachate production and contaminant transport, and gas generations at existing landfills.
Gonullu, 1994 Presented analytical models of organic and inorganic contaminants in leachate. The models were used to simulate experimental data form laboratory columns. The parameters for the analytical solutions were estimated by simulating experimental data. Moisture routing was not modelled.
Piotrowski, J. J., 1995
Developed a two dimensional finite element model to examine the effects of anisotropic conditions on moisture distribution within a landfill. Leachate flow was simulated as unsaturated flow in porous media. The model consistently underestimated peak leachate generation measurements which were attributed to the smoothing of the input precipitation data were conducted to eliminate numerical oscillations. Adopted from: : M. El-Fadel, A. N. Findikakis & J. O. Leckie, “Modeling Leachate
Generation and Transport in Solid Waste Landfills”, , Environmental Technology, 18:7,
28
Chapter 3
Materials and Methods
3.1. Materials
The tested specimens in this study included different mixtures of glass beads and kaolinite. The
glass beads were obtained from Jaygo Incorporated (Union, New Jersey). Approximately 93% of
the particles was in the range of 100 to 200 (µm), 5% was larger than 200 µm and 2% smaller
than 90 (µm). The bulk density was 1519 (kg/m3). The physical characteristics and chemical
composition of the glass beads provided by the manufacturer are presented in Tables 3.1 and 3.2.
The powdered kaolinite (Al2Si2O5(OH)4) was purchased from Ward’s Natural Science Establishment Incorporated (St. Catharines, Ontario). Kaolinite commonly forms as a secondary
product of the weathering or hydrothermal alteration of aluminum silicates, particularly feldspar,
and it is a main constituent of kaolin. According to the manufacturer, the specific gravity of the
kaolinite is 2.6.The as-received product was white with brown or grey staining likely due to the
presence of minor impurities.
Sodium chloride which was used to make the sodium chloride solutions was reagent grade a
purity of at least 99% and met the American Chemical Society (ACS) specification. Its
constituents are presented in Table 3.3.
3.2. Methods
Standard geotechnical methods were used to characterize the samples for water content, particle
29
density and optimum water content) according to American Society for Testing and Materials
(ASTM). The as-received soluble salt concentrations of glass beads and kaolinite were
determined by washing the samples with deionized, dstilled or mega pure water with a 1:100
soil:water ratio.
3.2.1 Cation Exchange Capacity (CEC)
The C.E.C of kaolinite was determined using the potassium and ammonium acetate exchange
method. To prepare ammonium acetate solution, 10 g of ammonium acetate was dissolved in 500
mL of mega pure water to give a concentration of approximately 0.12 mol/L. The measured pH
of this solution was 7 to 8 which ensured enough ammonium (NH4+) existed to displace ions held
in the exchange sites. Potassium solution was made by dissolving 9.5 g of potassium chloride in
500 mL of mega pure water to make a 0.12 mol/L solution. For the extraction of exchangeable
cations, exactly150 mL of ammonium acetate solution was added to 1.5 g of air-dried soil in a
plastic centrifuge bottle. The bottles were then capped and shaken overnight using the
wrist-action shaker. After 24 hours of shaking, the bottles were centrifuged at 5000 rpm for 20 mins to
separate solid particles from solution. The supernatant was filtered through a 0.45 micron syringe
filter into a Nalgene sample bottle for storage and subsequent determination of cation
concentration using inductively-coupled plasma-optical emission spectroscopy (ICP-OES). A
similar procedure was followed for the extraction of cations by the potassium solution. The
following equation was used to calculate the CEC value of the four major cations which are
30
CEC = [(cation concentration in ppm) x (volume of extract g) x 100 g of soil]/[(cation molecular
weight/cation valence x 1000) x (soil dry weight in g)] (3.1)
The four calculated values were added together and the soluble salt concentrations were
subtracted from this value to determine the exchangeable cation concentrations.
3.2.2 Hydraulic Conductivity Test
There are several variations of hydraulic conductivity test cells available for laboratory testing of
soil samples which can be divided into two main categories, rigid-wall permeameters and
flexible-wall cells. The advantages and disadvantages of each group are discussed in the
literature (Zimmie, 198; Daniel et al. 1986). Rigid-wall cells are easier to use and less expensive
than flexible-wall cells but on the other hand it is always possible to have sidewall leakage as a
result of reduction in boundary stress and this leakage is difficult to quantify. Therefore an
increase in hydraulic conductivity due to side-wall leakage cannot be determined and there will
be overestimation in hydraulic conductivity. The flexible-wall permeameter virtually eliminates
this problem; it also decreases testing time as fairly rapid saturation of samples is possible by
applying back pressure and the saturation of sample can be confirmed by measuring the B value.
However, high cost of flexible-wall equipment, complexity of the test and membrane integrity in
sample permeation with special chemicals or waste liquid is three main disadvantages of this
device. The importance of the project that hydraulic conductivity is desired for, best simulation
of field condition, time and budget limitation are some of the factors that must be considered
31
In the present study, a constant-flow permeameter was used to permeate different mixture of
kaolinite and glass beads with three pore volumes of distilled water and subsequently with
several pore volumes of sodium chloride solutions. The fixed-wall, constant- flow rate
permeameter generates a constant flow rate through all specimens by a triaxial loading frame
driving four piston-syringes system containing permeant. The main components of the
compression machine are a gear box, a motor and two stainless steel syringes holder. Each
syringe has a capacity of 65 mL and can travel at velocities within the range 1.48 x 10⁻² mL/s to
5.92 x 10⁻⁶ mL/s. This wide range is possible due to the possibility of selecting different size of gears in two gear locations and controlling the motor speed at each selected position. Prior to the
test, an estimate of soil hydraulic conductivity was made according to Kozeny-Carman formula
(Carrier W.D., 2003).
(3.2)
Where,
S0= specific surface area per unit volume of particles (1/cm); and e= void ratio.
Based on the estimated hydraulic conductivity, the speed of the flow pump motor was selected so
that the flow pump could deliver permeant at the desirable flow rate and generate the acceptable
head difference. The constant flow rate induces head drop across the sample used along with
flow rate and sample area to calculate the hydraulic conductivity of the soil sample according to
Darcy’s law; this procedure is extensively described by Olsen (1966). Pressure transducers were
used to measure the pressure in permeant influent and the effluent pressure was kept at
32
5.38 cm inner diameter and 7 cm height. To seal the contact between the cylinders and aluminum
plates, both ends of the cylinder are machined to contain Viton O-rings. The fluid outlet which is
connected to the cell base is for collection of effluent for chemical analysis. There are two ports
on the top of the cell, one for fluid inlet which is also used as the pressure transducer mount and
the other one for escape of air during filling of the fluid chamber. Appropriate spring and
supporting ring assembly are placed on top of the sample to prevent swelling of specimen during
permeation. The assembled cell is held together by four threaded and sleeved rods which are
attached to the lower stainless steel plate. Filter papers are placed between soil sample and
porous stones. A photo of the assembled device showing the various parts of the equipment are
illustrated in Figure 3.1 and Figure 3.2, respectively. Figure 3.3 shows a cross-section of the cell
assembly.
Four different mixtures were prepared by mixing sufficient air-dried glass beads with different
amounts of powdered kaolinite. The samples were named G80K20, G70K30, G60K40, G50K50
while G stands for glass beads and K for kaolinite and the following numbers denote their
percentage portion. In accordance with standard procedure for construction of compacted clay
liners for waste containment (Shackelford and Redmond, 1995; Steiakakis et al., 2012), each
sample was mixed with water to achieve a water content of approximately 2% wet of optimum in
order to minimize the hydraulic conductivity and obtain a fairly homogeneous distribution of
voids within the material. After wetting and mixing the samples to the desired water content, the
soils were placed in double-sealed plastic bags and were allowed to hydrate for several days in
order to promote uniform water content before compaction. O-rings were added to the cell body
and the cell was placed on a Plexiglas plate, a fine porous stone with 0.2 cm thickness was