Bioenergy: Potentials and limitations
E.-D. Schulze andJ. G. Canadell
Max-Planck Institute for Biogeochemistry - PO Box 1001 64, 07449, Jena, Germany and Global Carbon Project, CSIRO Oceans and Atmospheric Flagship - Canberra, ACT, Australia
Summary.— In this lecture we explain 1) the biochemical basis for photosynthesis and plant production and 2) the future demands on biomass for human use. Sum-ming all physiological processes, the efficiency of converting solar energy into biomass is<1.6% in the tropics, and between 0.4 and 0.8% for the temperate regions. In view of the present and future high demand on biomass for food, bioeconomics, fiber, construction material, only a relatively small fraction of plant production will be available for bioenergy. We estimate this fraction to be between 3 and 8% of the global energy demand by 2050. The contribution of bioenergy is at the higher end in tropical regions and in the less industrialized parts of the world, but may even be<3% in industrialized nations.
1. – Introduction
The search for renewable sources for energy has been intensified over the past decade in response to concerns of national energy security and the awareness that burning of fossil fuels and land-use change cause greenhouse gas emissions that result in global climate change [1]. Thus, land-based biological strategies for climate mitigation are considered potential contributors to climate stabilization. However, to satisfy the growing demands for food, wood products, energy, climate mitigation and biodiversity conservation, all of which compete for biomass and the same terrestrial surface of the globe, the use of plant
DOI: 10.1051/epjconf/2015980 0 04
7KLVLVDQ2SHQ$FFHVVDUWLFOHGLVWULEXWHGXQGHUWKHWHUPVRIWKH&UHDWLYH&RPPRQV$WWULEXWLRQ/LFHQVHZKLFKSHUPLWV 3
C
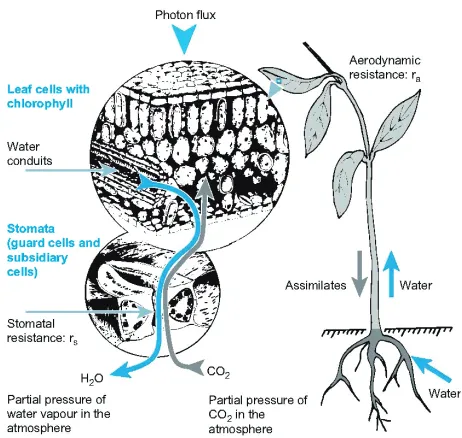
Fig. 1. – Functional design of a plant, including roots, stem and leaves, and the flow of assimilates and water with nutrients. In greater detail the structure of a leaf is shown with a separation of conducting system, the carbon assimilation tissue and the protective envelope of an epidermis (the skin of a plant) with specialized cells for gas diffusion [3].
products for energy must be placed in the context and priorities of multiple competing uses, and driven by high standards in sustainable development.
In the following we will start by explaining the biochemical basis of plant production in order to constrain the upper limit of biomass availability for energy production, and then assess the present use of biomass, and its future opportunities and limitations. In this short overview it will not be possible to provide enough details, but refer to common textbooks on plant physiology and plant ecology for the biochemical bases [2-4]. For the global assessment of bioenergy use we refer to the statement of the German National Academy of Sciences Leopoldina [5] and to the review by Canadell and Schulze [6] on climate mitigation.
2. – Physiological basis of plant production
In this section we like to introduce concepts of plant metabolism, the limitations of photosynthesis and respiration, and the regulation of growth and yields in order to give insight into some principles about plant functioning, including the regeneration of substrates in closed reaction cycles, the use of chemical energy via redox-systems, and the importance of membranes to separate charges.
Vascular plants have different organs for water and nutrient uptake, and for photo-synthesis (fig. 1). Both organs are generally separated by a conducting system, the stem.
The system is designed to produce carbohydrates and amino acids for flowering and seed production. The same principle design holds for minute mosses and giant trees. We should be aware that we can only harvest the stem, the leaves and fruits, but not the roots, because this would destroy the habitat for growth,i.e.the soil.
Rainfall and drought are major problems for plant growth as known from watering the lawns of cities and gardens. It seems appropriate to start a description of plant production with an understanding of the relation between water vapor and carbon dioxide use. The diffusivity of CO2in air is 0.14×10⁻⁴m2s−1 and thus 4 orders of magnitude larger than in water (0.16×10⁻⁸m2s−1), making life outside water attractive for plants. However, the CO2 gradient between the air and the leaf interior is in the order of 100 ppm, while the gradient of water vapor between water saturated cell walls of living cells and the surrounding air at average conditions of humidity is in the order of 12000 ppm. Thus, the efficiency of water use (including the differences in diffusivity of water vapor and CO2) is 12000 * 1.6/100, and equals 192 mol H2O/mol CO2. Thus plants must have access to large amounts of water in order to assimilate the atmospheric CO2 because there is no membrane that is permeable to CO2but not to H2O due to the molar weight ratio of 44/18, and there is no plant structure to store sufficient water. In this context it is interesting to note that present-day conditions are different for animals. At 20% oxygen in the air the O2 and the H2O gradient between the lung and the air is about 50000 ppm for both molecules, which leads to a water use of only 1 mole H2O per CO2, and it decreases to 0.2 for cold-blooded animals. Thus, the availability of water is crucial for plants, which also cannot move, compared to animals, which also can hide by moving. The production of biomass starts with the capture of solar energy by reducing “energy carrying” molecules in a so-called “light reaction”. The products of this reaction are then available for reducing atmospheric CO2 in a second step of a so-called “dark reaction”. During the light reaction electrons of the chlorophyll molecule are excited by photons (fig. 2), but only a narrow range of energy can be used for photochemistry. Blue light excites the electron to the second singlet stage, and the return reaction is too fast to be used photochemically. Only heat is produced. The red light excitement is not sufficient to bring the electron to the singlet stage, and the energy is lost by phosphorescence. Also, even if the electron reaches the first singlet stage, the energy may not be used because the photochemical acceptor is not ready for chemical use, or the protein is under repair from damage by previous reactions. In these cases the energy is also lost by heat or by fluorescence. Because of these limitations, the photosystem is designed to capture as many photons of a confined wavelength as possible, and lens-like antenna systems are produced for energy capture and transfer to a single reactive center for transferring the light into chemical energy.
Fig. 2. – Light absorption and photochemical use at different wavelengths [3].
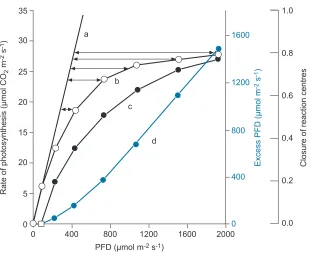
membrane and carrying the chemical energy between Photosystem II and I. This avoids overload in the electron transfer, but it costs time and a loss in efficiency. This loss has to be weighted against the risk of damaging the protein complex that captures the energy at 680 and 700 nm. About 10% of the reaction centers are damaged at any time, and the efficiency of capturing light decreases with increasing levels of available light (fig. 3).
The reaction center of the photo-systems are a magnesium-nitrogen complex in the chlorophyll and an Fe-S complex for the NADP reduction. Additional minerals needed for this reaction are Cu for plastocyanin, Zn for scavenging oxygen radicals, and Mn for water splitting. Photosystem I also reduces nitrite and sulfite as part of the plant metabolism.
In the following dark reaction, 6 molecules of CO2are reduced to form one molecule of glucose. This reaction requires the energy of 12 molecules of NADPH, plus 12 protons, H+, and 18 molecules of ATP (adenosintriphosphate). In this reaction CO2binds initially to a lysin-NH3complex forming a carbamat which is activated by Mg. The initial product is a phospho-glycerat which is formed from ribulose-bis-phosphate, RuBP. The glycerate is reduced to triosephosphate the earliest photosynthetic product. The triosephosphate can be further condensed to fructose and starch in the chloroplast, or it can be condensed to sucrose and exported to the conducting system of the plant.
20 2 0 5 15 20 25 30 35
Rate of photosynthesis (μmol CO
2
m
-2 s -1)
400
0 800 1200 1600 2000
400 1200
800 1600
PFD (μmol m-2 s-1)
a
b
d c
Excess PFD (μmol m
-2 s -1)
Closure of reaction centres
1.0 0.8 0.6 0.4 0.2 0.0 0
Fig. 3. – Light saturation curve of photosynthesis showing (curve b) the rate of CO2 fixation in response to photon flux density, PFD. a) Linear response of photosynthesis with increasing light at low PFD. c) Calculated time of transfer of electrons from PSII including repair of damage by light. d) Excess light energy [3].
All plant cells, that do not contain chloroplasts, must generate their energy from the break-down of saccharine via formation of organic acids and the reduction of ATP and NADH as universal chemical energy carriers in other biochemical reactions.
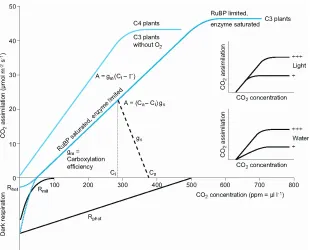
Besides light, the availability of CO2 gas is one of the limiting substances in pho-tosynthesis. Figure 4 summarizes the complicated interactions by showing the rate of CO2 assimilation at increasing atmospheric CO2 concentration. We distinguish between so-called C4-plants, where CO2is initially fixed as organic acid and reduced to carbohy-drates in a second step after concentrating CO2 in specific cells, and C3-plants, which lack the CO2-concentration mechanism. Here we can deal only with the C3-plants in de-tail. CO2assimilation increases with atmospheric CO2concentration if the CO2-binding enzyme is limiting but RuBP is available. The response saturates at about 500 ppm when the regeneration of RuBP becomes limiting.
Fig. 4. – Schematic representation of the response of CO2-assimilation in C4 and C3-plants to the CO2 concentration in the atmosphere. Positive values represent CO2 uptake, negative values represent CO2 emission. The inserted figures show that changes in light climate change the saturation point of the CO2-fixation, while limitations in water change the slope of the reaction. For further explanations see text [3].
It is interesting to note that Ci is under most environmental conditions adjusted to be at about 50% of the maximum capacity of the enzyme system. Most enzymes in metabolism operate at such low rate, because it gives sufficient flexibility to cope with variations in light and thus avoid damage. The conditions of low CO2 concentration are highly uncertain and dependent on the so-called rate of photorespiration (a process forming amino-acids) and dark respiration.
The regulation of the diffusive conductance of the guard cells is very complicated. Mechanistically it is an osmotic response to K+ being carried into or out of these cells, a high osmotic pressure causing the cells to open the stomatal pore, allowing CO2 and H2O diffusion, and low osmotic pressure causing the stomatal pore to close. There is no unifying concept to describe this regulation. The stomatal pore is adjusted directly by light, temperature, and air humidity, and indirectly by metabolic signals, such as abscisic acid, which can originate from the metabolism in the root in response to dry soil.
Even though the biochemistry in the leaf is the primary source for carbohydrates, it does not determine the total amount of carbohydrates that are available to a plant because the plant individual has restrictions to expose leaves to the light (too many leaves
H2O CO2
CO2 assimilation
Δw
Assimilate pool partitioning, Rm, Rg
d e c b a Stomata Growth of leaves Growth of supporting structures Death of supporting biomass Water use for growth Nutrient use for growth Nutrient uptake Nutrient loss Storage Green biomass Supporting biomass
Soil carbon pool
Soil nutrients Soil water
Water uptake Storage
Transpiration
f
A = f (Δc . g . LA) E = f (Δw . g . LA)
Death of leaves
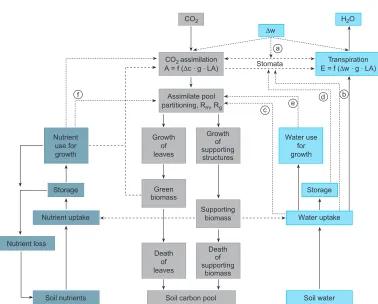
Fig. 5. – Schematic model of the interactions and controls between water- nutrient- and carbon-relations at the whole plant level. Fluxes of materials are shown by solid lines, controls are indicated by dashed lines. Air humidity as indicated by Δw represents the saturation deficit between leaf mesophyll and air. The equations in the assimilation and transpiration boxes represent the diffusion of CO2 and H2O through the stomata, as represented by a conductance g, and the leaf area, LA. Small letters in circles represent (a) controls by the atmosphere, (b) and (c) by the water supply to the root, and (d) by water and (f) by nutrient deficits in cells [3].
would shade each other) and to maintain a balance between the water and nutrient supply from the root and the carbohydrate supply from the leaf, considering also the senescence of various organs. At this point we can only show a conceptual model of these mutual limitations (fig. 5). Water and nutrients in the soil promote leaf growth depending on the supply by the root. On the contrary leaf growth and its photosynthesis supply the carbohydrates to grow more new leaves and roots, where the “decision” to grow a new leaf also depends on the amount of existing biomass in terms of energy demand (by maintaining respiration) and the mutual self-shading of new leaves over old leaves.
Fig. 6. – CO2 fluxes at the ecosystem level, for explanation see text [7, 8]. Arrows pointing to the top indicate C fluxes to the atmosphere, while arrows pointing to the bottom indicate C fluxes to the soil or into biomass.
detail, but it is important to understand, that photosynthesis is only one of many fluxes at the ecosystem level (fig. 6), and one that is still far from telling the amount of biomass that ultimately will be produced.
Input to the ecosystem is “gross primary productivity”, which is equivalent to photo-synthesis, but calculated by assumptions about plant respiration in the light. About 50% of the carbohydrates produced in this way are used by the plant itself during autotrophic respiration, i.e. respiration of living plant cells that do not contain chloroplast. The outcome of this plant internal carbon balance is the “net primary production”, which is equivalent to plant growth. The soil with its input of organic matter from litter and animals feeds the microbial communities in the soil which emit carbon dioxide to the atmosphere,i.e., heterotrophic respiration. Carbon is also emitted to the atmosphere by
Fig. 7. – Demands on biomass from multiple sectors: Conservation, Greenhouse-gas mitigation and part of energy production would contribute to climate mitigation, while food production and bioeconomics cause greenhouse-gas emissions and thus enhance climate change [6].
fires and lost by dissolved organic and inorganic carbon to ground water. The combina-tion of all these fluxes, including plant harvest by animals and humans, results in the net biome production as the landscape level C-balance. The metabolism of microorganisms inside other organisms (ruminants) and in the soil cause other non-CO2 greenhouse gas emissions to the atmosphere, mainly CH4 and N2O. Only after accounting for these emissions we derive the resultant Greenhouse Gas Balance, NGB, of an ecosystem.
Taking net plant production (NPP) as a basis (about 50% of photosynthesis), which is of interest for bioenergy, Larcher [4] derived an efficiency of photon use of the terrestrial global plant cover to be<1.6% in the humid tropics, 0.4 to 0.8% in the temperate zones, and<0.02% in the arid regions. Thus, the global average photon use efficiency is<1%. At the ecosystem level based on NBP the photon use efficiency is<0.1%.
3. – The supply and use of biomass for energy
Based on the foregoing analysis we could stop here and conclude that burning of biomass to produce energy is such an inefficient use of solar energy, that it is clearly not an activity that should be pursued. However, this is not the reality. Governments around the world see domestic bioenergy production as a key development in achieving national energy security, especially for liquid fuels. In developing countries and also in some developed countries there is an increase use of firewood (and pellets) for home heating and luxurious open fireplaces. Thus, we will further assess the constraints of land-use and biomass production.
cli-Fig. 8. – Fluxes of global greenhouse-gas fluxes as averaged for the period 2003 to 2012 [6].
mate mitigation, other enhance climate change. The contribution of the energy-sector is ambiguous, depending on the associated greenhouse-gas (GHG) balance [9]. The multiple demands on land and biomass are closely linked. For example, increased food production causes GHG emissions which in turn produces climate change, may require additional land, which in turn may reduce the natural CO2sinks, and therefore further accelerating climate change. The reverse would also apply. GHG emissions include mainly CO2, N2O and CH4. Conservation could reduce deforestation, but full protection also reduce the net ecosystem carbon uptake due to enhanced respiration of dead wood and decaying biomass [10]. Bioeconomics intends to replace fossil-fuel–based products, but the pro-duction of the required biomass could either cause land-use change or GHG emissions.
The magnitude of the resultant GHG fluxes are summarized in fig. 8 as averaged over 10 years (2003 to 2012). The dominating role of CO2 emissions is obvious. Land-use change (LUC) also results in net CO2 emissions, even though this is the result of two larger components, namely emissions from clearing land and CO2 uptake from regrowth on abandoned land. Both types of emissions are balanced by the growth of CO2 stored in the atmosphere, by uptake of the oceans, and by uptake of the land surface, including the production of biomass for human use. It is remarkable that the global land-CO2-sink is exceeded by carbon-equivalent emissions of CH4and N2O, with CH4emissions mainly caused by meat production, and N2O emissions caused by fertilizer application to grow biomass. Thus, reducing GHG emissions should be a top priority in climate mitigation efforts. In Europe, Germany, Benelux-states, northern France and southern England are the regions with the largest GHG emissions [7]. Globally, China and USA are the nations with the highest GHG emissions, exceeding all other nations [11].
Assessing the efficacy and desirability of different land-based biological climate mit-igation is not straightforward (fig. 9), because any activity has positive and negative
Fig. 9. – Pros and cons of various options of land-based biological climate mitigation activities [6].
effects [6]. There are two types of climate mitigation strategies. First, the management of sinks and sources via increasing carbon sinks and decreasing carbon GHG sources, which would compensate fossil-fuel emissions. Second, the management of bioenergy production to replace fossil-fuel energy sources and so decreasing GHG emissions. The source/sink management would enhance storage in biomass and soils, mainly by con-servation, or the reduction of non-carbon-GHG emissions. The main drawback of all of these activities would be a reduced productivity, the likelihood of a non-permanence, the spread of pests and diseases, and the saturation of sinks (i.e.the activity will cease to be effective). The bioenergy production includes biomass for burning, and for the production of oil and methanol; this includes the use of waste and forest/agriculture residues in modest amounts. The extensive use of energy crops has the caveats that the production of energy and food might be in competition for land. Waste use has the caveat of implicitly promoting waste production.
Fig. 10. – Who demands what from a forest enterprise [12].
4. – A regional example of the constraints of GHG emission management: Germany
In the following we like to explore the chances and limitations of bioenergy production in forestry and in agriculture, taking the situation of Germany, the main fossil-fuel emitter of Europe, as an example.
In forestry, even though wood production is the main commercial objective of a land owner, there are numerous additional non-monetary demands by society (fig. 10), ranging from recreation via hunting to enabling the production of drinking water [12]. In this context it is interesting to explore, who represents “society”. To a large extent the representation is by Non-Governmental Groups (NGOs) that demand high stakes on those other societal benefits (e.g.abandoning harvest on 10% of German forest land and putting it into wilderness). It is quite obvious, that all of these societal demands affect climate mitigation in positive and negative ways. There are also embedded conflicts, such as the damage by high deer populations, as favored by hunters [13], and wood production, and the conservation of biodiversity.
In terms of wood production, again, there are various options [14]. The traditional silvicultural practice was a rotation forestry, where stands of different age classes grew up to about 100 yrs until harvest by clear-cut (fig. 11). This practice has been abandoned by the request of the broader public opposing to possible ecological consequences of clear cuts, even though these consequences are scientifically debatable [15]. Thus forests are
Fig. 11. – Options of wood-production in Germany [14].
re-structured into selective-cutting, which is not included in fig. 11 for simplicity rea-sons. One possible way to increase productivity is the plantation of new species with higher growth rate, and which could be harvested after 50 yr rotation. One possibility to achieve this would be the plantation of Douglas fir in Germany. However, the conser-vation administrations under the pressure of NGOs declared Douglas fir as an invasive alien species, which should be eradicated and trade was threatened to be condemned [16]. Thus, there are emotional pressures, which oppose climate mitigation. The alternative would be to fertilize native species, with associated emissions of GHGs [14], or the conver-sion of forest into short-rotation coppices, which was historically used for firewood, but which proved to be non-economic and unsustainable due to the additional uses for graz-ing of domestic animals and to grow barley the year after coppicgraz-ing. The consequences of this management type can be visited in Kosovo, former Yugoslavia [13].
Forest enterprises sell wood to a wood market, and the demand drives the production. One major problem we observe is the increasing demand for firewood in Germany caused by multiple reasons, such as the increasing cost of fossil fuel for heating, the luxury burning in open fireplaces, and the increasing awareness of the public about global change and the willingness to help mitigation with using renewable resources for heating. The total demand of firewood has increased beyond the possible supply by German forestry. Thus, prices have increased almost 10-fold over the past 5 years, and the incentive of using fertilizer in forestry increased with the associated N2O production [17]. Firewood is presently imported to Germany from North America and Russia [18]. In addition, burning wood is not at all C-neutral due to non-CO2GHG emissions [19].
life-Fig. 12. – Current and future global land demand [6].
style contradicts the demands for putting forest into a conservation status and personal recreation. Thus, wood production for climate mitigation in Germany is being outsourced to other countries, and personal demands for recreation take priority.
In agriculture the situation is more concerning because Germany is purposefully not accounting non-CO2 greenhouse gas emissions, the most important GHG in agriculture. This is based on the exemption of the EU Common Agricultural Practice for food pro-duction, even though about 25% of the agricultural land is presently used for industrial products, such as bioenergy. The non-CO2 GHG emissions are high. 50% of the Euro-pean CH4emissions originate from animal husbandry, 70% of the N2O emissions originate from cropping, and 90% of the NH3 emissions are of agricultural origin [8]. Part of the problem is that large amounts of fodder are imported to achieve a higher meat and milk production. Only about 3% of the fed nitrogen-fodder remains in milk and meat, and the rest is excreted, and thus contributes to GHG emissions and to nitrate pollution in ground-waters. Biofuel production of about 1.7 million tons of carbon (MtC), meat pro-duction of about 1.6 MtC and milk propro-duction of about 1.5 MtC (in total about 5 MtC production) require 5 MtC of high N-fodder imports and about 75 MtC rough fodder for ruminants, and result in 60 MtC-equivalent CH4and 40 MtC-equivalent N2O production, with a large fraction of the products being exported [20, 7].
DiLucia et al.[9] summarized the mitigation potentials of liquid biofuels for Europe and concluded that neither sugarcane, wheat, maize, soja nor rapeseed meets the EU efficiency targets for replacing fossil fuels. The present consumption can only be met by imports to Europe [18]. Obviously, the industrial agriculture in Germany is unsus-tainable, and it contributes to rather than mitigates the global climate change. The production of agricultural goods is increasingly based on land outside Germany.
5. – Global land area requirements
The global climate debate is centered mainly on mass balances. Concerning the con-tribution of land, however, there is the need to consider that the cultivation of products requires land area (fig. 12). Presently, about 50% of the global land surface is used by agriculture and forestry to grow products for human use. The rest of the land is either
too remote for management (e.g.remote tundra areas) or it is unavailable (e.g. alpine regions or deserts). It is evident, that even today the so-called remote and unavailable areas are extensively grazed by nomadic people. With the given distinction we like to separate land with commercial harvest of biomass from land that is remaining quasi “natural”, except for cities.
Projecting the land demands into the future, one scenario is that land will be taken into commercial use by each sector individually,i.e.agriculture, bioenergy, bioeconomics and forestry. In this case the demand will be so large, that the area-equivalent of man-aging most of the remote and unavailable land would be needed, which is not possible, due to the environmental conditions of such regions (permafrost, salinity, rock-surfaces). A composite of all current aspirational land demands from multiple sectors is estimated to be 3 to 7 times bigger than the land considered being available under various defini-tions [6]. Alternatively, the land demand could be confined by sustainable land manage-ment, which includes an intensification of plant cultivation on the one hand (e.g.closing the yield gap in non-industrialized countries) but a reduction of GHG emissions on the other. GHG emissions could be reduced by application of fertilizer according to the de-mand for growth by the plant cover. It is clear that sustainable land management and intensification of production on existing land will not be acceptable by many groups of the society, but it is the same society which creates the demands and buys these products. Also, commercial incentives exist, that use land wherever possible, to produce products that are paid by developed countries. The encroachment of oil palm into rainforests of Africa and Southeast Asia to produce biodiesel for industrialized nations may be taken as example [21]. In addition, developed nations tend to increase demand for recreation over land for climate mitigation [22, 23].
6. – Conclusion
The mitigation potential of land-based carbon mitigation is large with respect to reducing non-CO2 GHG emissions, even though the contribution to substitute fossil fuels for energy production is low. Canadell and Schulze [6] estimated that only about 3 to 8% of the global energy requirement can be delivered from biomass. In view of the fact that more people want to participate in the life-style of present industrialized nations, the growing energy demand can only be supplied by technical processes rather than by biological production.
REFERENCES
[1] IPCC, Global Climate Change, The Scientific Basis (Cambridge University Press, Cambridge) 2014.
[2] Lambers H., Chapin III F. S. and Pons T. L.,Plant Physiological Ecology (Springer
Verlag, New York) 1998.
[3] Schulze E. D., Beck E. andM¨uller-Hohenstein K.,Plant Ecology (Springer Verlag,
[4] Larcher W.,Physiological Plant Ecology, 4th edition (Springer Verlag, Heidelberg) 2003.
[5] German National Academy of Sciences Leopoldina,Bioenergy – chances and Limits
(Halle (Saale)) 2012.
[6] Canadell J. G.andSchulze E. D.,Nat. Commun.,5(2014) 5282.
[7] Schulze E. D., Luyssaert S., Ciais P., Freibauer A., Jannsens I. A., Soussana
J. F., Grace J., Levin I., Thiruchittampalam B., Heimann M., Dolman A. J.,
Valentini R., Bousquet P., Peylin P., Peters W., R¨odenbeck C., Etiope G.,
Vuichard N., Wattenbach M., Nabuurs G. J., Poussi Z., Nieschulze J.andGach
J. H.,Nat. Geosci.,2(2009) 842.
[8] Schulze E. D., Ciais P., Luyssaert S., Schrumpf M., Janssens I. A.,
Thiruchttampalam B., Theloke J., Saurat M., Bringezu S., Lelieveld J., Lohila A., Rebmann C., Jung M., Bastviken D., Abril G., Grassi G., Leip A., Freibauer
A., Kutsch W., Don A., Nieschulze J., B¨orner A., Gash J. and Dolman A. J.,
Global Change Biol.,16(2010) 1451.
[9] Di Lucia L., Ahlgren S.andEricsson K.,Environm. Sci. Policy,16(2012) 9.
[10] Schulze E. D., Aas G., Grimm G. W., Denk T., Gossner M. M., K¨uhn I.,
Scherer-Lorenzen M., Walentowski H., Bouriaud O. andLuyssaert S., submitted toEur.
J. For. Res.(2014).
[11] Global carbon Project (2013) Global Carbon Altas, CSIRO, Canberra
http:www.globalcarbonatlas.org.
[12] Schulze E. D.andSchulze I.,AFZ-Der Wald,6(2013) 7.
[13] Bouriaud L., Nichiforel L., Nunes L., Pereira H. and Bajraktari A., Biomass
Bioen.,67(2014) 425.
[14] Schulze E. D. and K¨orner C. h., “Nettoprim¨arproduktion und Bioenergie”, in:
Leopoldina Statement: Bioenergy – Chances and Limits. (2012) pp, 90-101, ISBN 978-3-8047-3081-6.
[15] Schulze E. D., Bouriaud L., Bussler H., Gossner M., Walentowski H.,
Hessenm¨oller D., Bouriaud O. andGadow K. von,Web Ecol.,14(2014) 3.
[16] Schulze E. D., Bouriaud O., W¨aldchen J., Eisenhauer N., Walentowski H., Seele
C., Heinze E., Pruschitzki U., D˘anil˘a G., Marin G., Hessenm¨oller D., Bouriaud
L. and Teodosiu M., Ann. For. Res., 57 (2014) http://dx.doi.org/10.15287/
afr.2014.273.
[17] Papen H.andButterbach-Bahl K.,J. Geophys. Res.,104(1999) 18487.
[18] Edenhofer O., Pichs-Madruga R., Sokona Y., Seyboth K., Matschoss P.,
Kadner S., Zwickel T., Eickemeier P., Hansen G., Schl¨omer S.andvon Stechow
C.(Editors),Renewable energy sources and climate change mitigation (SRREN), Special Report of IPCC, (Cambridge University Press, Cambridge) 2011.
[19] Haakonsen G.andKvingedal E.,Utslipp til luft fre vedfyring I Norge – utslippsfaktorer,
ildstedsbestand og fyringsvaner(Statistics Norway, Oslo, Kongsvinger) 2010, ISBN 82-537-4994-5.
[20] Hemmerling U.,Deutsch. Bauernkur.,9/12(2012) 4.
[21] Carrasco L. R., Larosa C., Milner-Gulland E. J. and Edwards D. P., Science,
346(2014) 38.
[22] Schulze E. D.,Polit. ¨Okol.,132(2013) 63.
[23] Schulze E. D.,AFZ-Der Wald,17(2013) 31.
![Fig. 2. – Light absorption and photochemical use at different wavelengths [3].](https://thumb-us.123doks.com/thumbv2/123dok_us/8172187.1364536/4.482.131.342.69.360/fig-light-absorption-photochemical-use-dierent-wavelengths.webp)
![Fig. 6. – CO2the top indicate C fluxes to the atmosphere, while arrows pointing to the bottom indicate C fluxes at the ecosystem level, for explanation see text [7, 8]](https://thumb-us.123doks.com/thumbv2/123dok_us/8172187.1364536/8.482.97.383.66.417/indicate-uxes-atmosphere-pointing-indicate-uxes-ecosystem-explanation.webp)
![Fig. 7. – Demands on biomass from multiple sectors: Conservation, Greenhouse-gas mitigationand part of energy production would contribute to climate mitigation, while food productionand bioeconomics cause greenhouse-gas emissions and thus enhance climate change [6].](https://thumb-us.123doks.com/thumbv2/123dok_us/8172187.1364536/9.482.114.372.56.255/conservation-greenhouse-mitigationand-production-mitigation-productionand-bioeconomics-greenhouse.webp)
![Fig. 8. – Fluxes of global greenhouse-gas fluxes as averaged for the period 2003 to 2012 [6].](https://thumb-us.123doks.com/thumbv2/123dok_us/8172187.1364536/10.482.86.397.69.234/fig-fluxes-global-greenhouse-gas-uxes-averaged-period.webp)
![Fig. 9. – Pros and cons of various options of land-based biological climate mitigation activities [6].](https://thumb-us.123doks.com/thumbv2/123dok_us/8172187.1364536/11.482.74.409.62.320/pros-various-options-based-biological-climate-mitigation-activities.webp)
![Fig. 10. – Who demands what from a forest enterprise [12].](https://thumb-us.123doks.com/thumbv2/123dok_us/8172187.1364536/12.482.69.409.69.309/fig-demands-forest-enterprise.webp)
