July, 1967
Measured Crop Performance
SMALL GRAIN
1967
JOHN C. RICE, Professor
R. WALTON MOZINGO, Research Assistant E. L JONES, Agricultural Research Supervisor G. C. OLIVER, Agricultural Research Assistant
Department of Crop Science NORTH CAROLINA STATE UNIVERSITY
TABLE OF CONTENTS
Page
INTRODUCTION. . . • . . . • • . • . • • • . • . • . • • . • . . . • . . • • • . • • 3 \
\
EXPERI~NTAL PROCEDURE •..•..•..•••.•.••••••••••••.••.••.••••••••
Agencies Sponsoring Entries .••••..•.••.••.•••• , .•••••••••••••.
Te s t Locat ions ...•...•...••••••••.••••.•••••••••••••••
Cultural Practices .•..•...••.•••••.••.••.••••••.••••••.•••
Seasonal Conditions ....•...•.•..••...•••••••..••••••••••••••••
RESULTS AND DISCUSSION ...•..••••••••••••••.•••••••••••••.•••
Barley ..•...•..••...•....••••••••••••.•••••••••••
Oats ...•...••••.••...••••••••••••••••••••
Wheat ...••..•....•••.•••••••••.•••..•••••••••
Lodging ...•••...•••••••••••••••••••••••.•••
TABLE AND FIGURES
4
4
4
6
7
9
9
10 10 11
Location of t e s t s . . . 5 Cultural p r a c t i c e s . . . 12
Characteristics of varieties ...•....•.••.•.•••.•.••••••••••••• 13
Barley performance in the Piedmont .•••..•••.••....•••••••••••• 15
Barley performance in the Coastal Plain ••••••••••.••.•••..•••• 16
Oat performance in the Piedmont •.••.•••..•••••••••••..•••••••• 17
Oat performance in the Coastal Plain •••.••.••••••••••••••••••• 18
Wheat performance in the Piedmont •••.•.•••.••••••.•••••••••••• 19
Wheat performance in the Coastal Plain ••••••••••••••••••••••.• 20
PERFORMANCE OF SMALL GRAIN VARIETIES IN NORTH CAROLINA 1/ John C. Rice, R. W. Mozingo, E. L. Jones, G. C.
Oliver-INTRODUCTION
The Official Variety Test on Small Grain varieties in North Carolina is conducted annually by locating evaluation trials throughout the small grain producing area of the state. These tests are conducted to determine the value and suitability of commercially available and prospective varieties of wheat, oats and barley for planting in North Carolina. The results of these tests are intended to aid the growers and agricultural workers in the selection of a 'variety best suited for their particular area of the state.
Information on varietal performance is presented from seven test locations in the state, four in the Piedmont and three in the Coastal Plain Area. In comparing the performance of varieties, data from the area which most nearly represents the growers condition should be used. Seasonal conditions differ from year to year; therefore a variety which looks superior fo~ one year may not be consistently good, hence, varieties should be evaluated on the basis of performance over several years. All
2/
available data- were used in determining the pathologic and agronomic characteristics of the varieties.
1/
Professor in Charge of Variety Testing, Research Assistant, Agricultural Research Supervisor and Agricultural Research Assistant, Department of Crop Science, North Carolina State University at Raleigh, respectively. 2/
EXPERIMENTAL PROCEDURE
Commercial varieties and experimental lines developed by public and private agencies are included in these tests. Any individual or firm may make application for having entries included by writing the Department of Crop Science, North Carolina State University at Raleigh. A fee is charged on an entry basis for all private entries. Personnel of the testing program may include entries about which further infor-mation is desired.
Agencies Sponsoring Entries Arkansas Agricultural Experiment Sta. Coker's Pedigreed Seed Company Georgia Agricultural Experiment Sta. Indiana Agricultural Experiment Sta. McNair Seed Company, Inc.
North Carolina Agricultural Experiment Sta. South Carolina Agricultural Experiment Sta.
Test Locations
Fayetteville, Arkansas
Hartg~ille, S.
t.
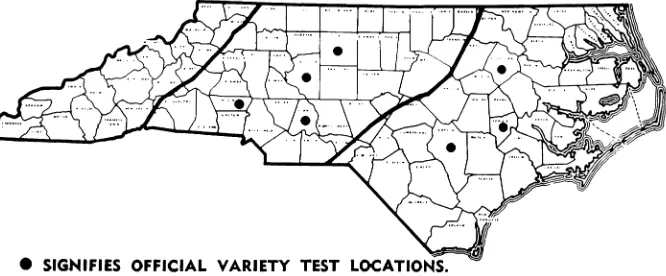
Experiment, Georgia Lafayette, Indiana Laurinburg, N. C. Raleigh, N. C. Clemson, S. C.Seven locations were used in 1961 with four in the Piedmont and three in the Coastal Plain as shown in Figure 1. All tests were located
1/
on private farms.- A randomized block design with four replications was 2/
used at each
location.-l/
The cooperative spirit and civic-minded service rendered by the farmers who provided land and the necessary cultural practices for these trials and the cooperation of the county agents are gratefully acknowledged.
~/
FIG. 1
LOCATION OF SMALL GRAIN PERFORMANCE TRIALS
• SIGNIFIES OFFICIAL VARIETY TEST LOCATIONS.
CO-OPERATORS
PIEDMONT
Davidson County: C. A. Smith, Route 7, Lexington, N. C. County Extension Chairman, C. E. Barnhardt.
Guilford County: Paul &Carson Ingle, Route 1, Burlington, N. C. County Extension Chairman, W. H. Kimrey.
Stanly County: D. G. Harwood, Route 1, New London, N. C. County Extension Chairman, V. A. Huneycutt
Lincoln County: W. C. Jetton, Route 1, Vale, N. C. County Extension Chairman, George A. Stoudemire
COASTAL PLAIN
Lenoir County: Joel Sutton, Route 6, Kinston, N. C. County Extension Chairman, F. J. Koonce
Edgecombe County: Jesse Summerlin, Route 1, Tarboro, N. C. County Extension Chairman, C. H. Lockhart
Cultural Practices
Cultural practices, such as seed bed preparation, date of planting, fertilization and topdressing were in accord with good farming practices and were uniform for all entries at a given location, Table 1. Several months prior to planting each test location, soil samples were obtained for the test field and fertilizer requirements made in accordance with the soil analysis report. Lime was applied, if needed, to raise the pH to a desirable level.
Starting in 1966, all tests have been mechanized for planting with a tractor-mounted Planter Jr. Planter. Tests were seeded in a small furrow with a Planter Jr. Planter mounted behind a tractor at the rate of one gram of seed per foot of row. The rows were spaced one foot apart. Each plot consisted of seven rows, 12 feet long with the two outside rows used as borders. The border rows were removed prior to harvest and only the five center rows were harvested. The date of planting and fertilization at planting is shown in Table 1 for each test location.
Seasonal Conditions
The seasonal conditions for the 1967 Small Grain Official Variety
Test were considered to be less than satisfactory. The Coastal Plain
Locations were planted late in October as a result of continuous wet
weather. The Piedmont Tests were planted in early November due to the
extreme wet conditions of the soil at the test locations. All locations
had a fairly good seed bed and the planting dates are listed on Table 1,
page 12. At most locations, the entries looked good in January but a
warm period during early March gave lush growth and a severe freeze in
March resulted in damage to many of the less hearty winter varieties.
The degree of winter damage on oats and wheat was corrulated to some
extent with the early growth of 'varieties when the extreme cold occurred.
The Edgecombe County Test had an excellent stand with good growth
and color throughout most of the growing period. This was a very uniform
test but after heading, the bird damage on the wheat and oat entries was
so severe that the data could not be used. Practically no lodging was
evident at this location.
The Lenoir County Test had a very good stand after planting and in
February the test had good growth with good color. Later in the season,
poor growth resulted on the barley entries due to the soil type and water
damage on one side of the test.
The best growth in the Coastal Plain was evident at the Sampson County
Test. The two successive invasions of cold air from the Great Plains during
the week of March 18 resulted in a minimum amount of winter damage at this
location. As a result of heavy fertilization on good soil, there was some
The Guilford County test was planted late due to the wet weather, but looked good in January with fair growth. No cold damage was evident until March on this location. Winter damage information was obtained on March 24 for each entry in this test.
The most uniform test for the season was located in Davidson County. This test started with a good stand and good color in January and continued to look 'very good until the severe freeze in March. By early April, the winter damage was disappearing and most entries were recovering from the cold weather.
Next to the Davidson County test, the Stanly County location was the most uniform test in the Piedmont. It was planted on November and had good growth by late January. The warm weather during early March continued to push most varieties very rapidly and the severe freeze in late March resulted in some winter damage. Most entries recovered from this damage and a very satisfactory yield was obtained.
With the late planting of the Lincoln County test, there was less lush growth and the March freeze did not damage this test as se'verely as some of the other Piedmont locations. On the other hand, the cold weather resulted in a poor stand of oats and the oat data was not secured for this location.
RESULTS AND DISCUSSION
The performance of the 1967 tests along with the previous four years are presented by crop and area in a tabular form in this report. Since the genetic expression of a 'variety is influenced greatly by the environment, it is best to have several years' data from which to draw conclusions. For example, if a variety appeared in the two-year average but not in the three-year average, then it must be compared only within the two years and not with the data in the three-year average since it is possible that the third year could have been extremely good or poor and not comparable.
The 1967 data presented in this report have been analyzed statis-tically and the least significant difference (L.S.D.), in terms of bushels per acre and pounds per bushel is given. Unless the difference between two varieties is greater than the L.S.D., the varieties should not be considered as being any different statistically.
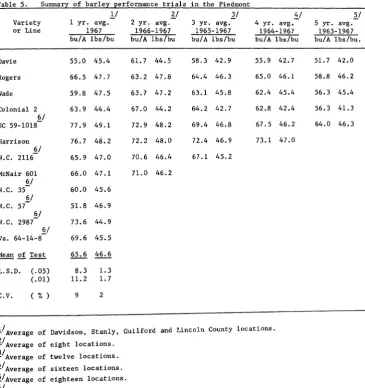
Barley
Table 5 shows the performance of barley in the Piedmont. The yields varied from a high of 77.9 bushels per acre for the experimental line SC 59-1018 to 51.8 bushels for the experimental line, N. C. 57, for the 1967 season. A five-year average also showed the experimental line SC 59-1018 to have the highest yield at 64.0 bushels per acre.
The test weight of 49.1 pounds per bushel for the line, SC 59-1018 was the highest for the 1967 season. This line also had the highest five-year average with 46.3 pounds per bushel, however, Rogers was very close with a 46.2 average for five years.
yielded quite well with an average of 78.9 and 78.2 bushels per acre respectively for the 1967 season. Se'ven of the twelve varieties yielded better than the mean of 72.2 bushels per acre. The Rogers variety had the highest test weight with an average of 49.4 pounds per bushel.
Over the five-year average, the experimental line SC 59-1018 has the highest yield at 67.2 bushels per acre and the highest test weight with an average of 46.2 pounds per bushel.
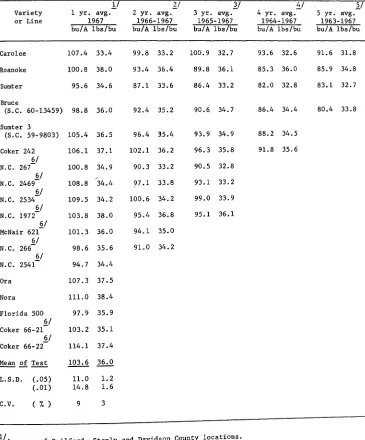
Oats
The data from the oat trials in the Piedmont are presented in Table 7. The yields for 1967 were very good with all but five of the eighteen entries yielding better than 100 bushels per acre. The Coker line 66-22 was the highest yielding with an average of 114.1 bushels per acre. The test weights were generally good with the Nora variety having a top of 38.4 pounds per bushel.
Carolee had the highest five-year yield with 91.6 bushels per acre while Roanoke had the highest test weight of 34.8 pounds per bushel.
In the Coastal Plain area, Table 8, the oat yields varied from a high of 111.7 bushels per acre for Ora to 77.1 bushels for Roanoke. Statistically there was no difference between varieties due to the differences between locations. Ora and Nora had the highest test weights of 37.5 pounds per bushel each. Over a five-year average, Sumter had the highest yield and Roanoke the highest test weight.
Wheat
per acre. Knox 62, with an average of 61.4 pounds per bushel, had the highest test weight.
Over a five-year period, Ga. 1123 had the highest yield and Knox 62 the highest test weight.
The Coastal Plain data are presented in Table 10. Blueboy led the test with an average of 62.6 bushels per acre. However, some entries as noted in Table 10 suffered bird damage in Sampson County. The damage was rated as follows: Slight - 16-25%, Moderate - 25-50% and Heavy above 50% damage. Riley had the best test weight with 61.4 while Andnox followed with 61.0 pounds per bushel.
Wakeland and Ga. 1123, the only two varieties tested for five years, had very little difference in yield and no difference in test weight.
Lodging
Area and Fertilizer Topdress
1/
Date of Date ofcooperator lbs./A Lbs , /A and date planting harvesting
Piedmont Area
Davidson Co. 600 50 N Nov. 1 Barley - June 20
C. A. Smith 5-10-10 Feb. 16 Oats &Wheat - June 26
Lincoln Co. 800 100 N Nov. 16 Barley - June 13
w.
C. Jetton 5-10-10 Feb. 16 Oats - DiscardedWheat - June 27
Stanly Co. 600 60 N Nov. 1 Barley - June 14
D. G. Harwood 5-10-10 Feb. 16 Oats &Wheat - June 20
Guilford Co. 500 50 N Nov. 17 Barley - June 20
Paul &Carson Ingle 2-12-12 Feb 16 Oats &Wheat - July 4
r-Coastal Plain Area r-..>
Edgecombe Co. 800 60 N Oct. 31 Barley - June 12
Jesse Summerlin 5-10-10 Feb. 24 Oats &Wheat - June 16
Lenoir Co. 800 60 N Oct. 28 Barley - Discarded
Joel Sutton 5-10-10 Feb. 24 Oats &Wheat - June 15
Sampson Co. 800 50 N Oct. 26 Barley - June 12
Maxton Bass 5-10-10 Feb. 24 Oats &Wheat - June 15
Loose Leaf
Variety smut Mildew rust Scald Lodging Winter Test
resist- resist- resist- resist- resist- Heartiness Maturity Weight
ance ance ance ance ance lb/bu.
Davie Poor Poor Excellent Fair Fair Good Early Low
Rogers Poor Excellent Good Fair Fair Excellent Late High
Wade Poor Poor Excellent Fair Good Good Early High
Colonial 2 Poor Poor Fair Poor Poor Good Early Low
Harrison Poor Good Fair Fair Excellent Excellent Early High
McNair 601 Poor Good Fair Fair Good Good Early Med.
Table 3"---_ Characteristics of oat varietieso* ~
w
Crown
Variety rust Smut Blight Mosaic Maturity Winter Lodging Height Test
resist- resist- resist- resist- Heart- resist- of Weight
ance ance ance ance iness ance Straw lb/bu.
Sumter Fair Good Good Good Medo Good Good Medo Med.
Roanoke Fair Poor Good Good Late Good Fair Tall High
Carolee** Fair Good Good Fair Med. Good Good Med. Med.
Coker 242 Good Good Good Fair Med. Fair Good Med. High
Bruce Fair Good Good Good Medo Good Good Med. Med. High
Florida 500 Good Good Good Fair Med. Poor Good Med. Med.
Ora Good Good Good Poor Late Excellent Excellent Med. High
Nora Good Good Good Poor Late Excellent Excellent Med. High
Sumter 3 Fair Good Good Good Med. Good Good Merl. Med. High
Leaf Mildew Mosaic Winter Lodging Height Test Soft Wheat Variety rust resist- resist- Maturity Heart- resist- of Weight Milling
resist- ance ance iness ance Straw lb/bu. Quality
ance
Wakeland Fair Fair Poor Early Fair Poor Short Med. Fair
**Knox 62 Good Fair Good Early Good Poor Med. High Good
Ga. 1123 Fair Poor Good Med. Fair Good Med. Med. Fair
**Coker 65-20 Good Good Fair Med. Fair Good Med. Med. Good
Semi-Blueboy Fair Good Good Med. Good Excellent Dwarf Low Good
Andnox Good Fair Good Early Good Good Short High Good
t-I
**Benhur Good Good Good Early Good Good Short Med. Good ~
Riley Good Fair Good Early Good Good Short High Good
Table 5. Summary of barley performance trials in the Piedmont
II 21 31
Variety 1 yr. avg.- 2 yr. avg.- 3 yr.
avg.-or Line 1967 1966-1967 1965-1967
bu/A 1bs/bu bu/A 1bs/bu bu/A 1bs/bu
!!.I
4 yr. avg. 1964-1967 bulA 1bs/bu
~.1
5 yr. avg. 1963-1967 bu/A 1bs/bu.
Davie 55.0 45.4 61.7 44.5 58.3 42.9 55.9 42.7 51.7 42.0
Rogers 66.5 47.7 63.2 47.8 64.4 46.3 65.0 46.1 58.8 46.2
Wade 59.8 47.5 63.7 47.2 63.1 45.8 62.4 45.4 56.3 45.4
Colonial 2 63.9 44.4 67.0 44.2 64.2 42.7 62.8 42.4 56.3 41.3
61
SC 59-1018- 77.9 49.1 72.9 48.2 69.4 46.8 6·7.5 46.2 64.0 46.3
Harrison 76.7 48.2 72.2 48.0 72.4 46.9 73.1 47.0
61
N.C. 2116- 65.9 47.0 70.6 46.4 67.1 45.2
McNair 601 66.0 47.1 71.0 46.2
61
N.C. 35- 60.0 45.6
2.1
N.C. 57 51.8 46.9
2.1
N.C. 2987 73.6 44.9
61
Va. 64-14-8- 69.6 45.5
Mean of Test 65.6 46.6
L.S.D. C.05) 8.3 1.3
(.01) 11.2 1.7
C.V. ( % ) 9 2
!/Average of Davidson, Stanly, Guilford and Lincoln County locations.
llAverage of eight locations. 31
- Average of twelve locations. ~/Averageof sixteen locations.
Table 6. Summary of barley performance trials in the Coastal Plain
51
5 yr. avg.-1963-1967
bulA lbs/bu
Davie 68.1 45.4 71.2 45.0 61.3 43.0 61.3 43.0 58.2 42.1
Rogers 76.5 49.4 66.4 47.5 62.4 45.8 61.6 45.9 54.0 45.5
Wade 78.9 49.0 76.9 47.3 68.4 45.6 68.3 45 .. 8 63.7 45.5
Colonial 2 72.3 45.0 71.1 44.8 65.3 43.2 64.2 43 .. 0 60.6 42.. 2
61
SC59-1018- 77.1 48.6 77.3 47.4 71.1 46.2 70.0 46.2 67.2 46.2
61
N.C. 2116- 76.9 47.0 78.3 46.1 69.8 44.3
McNair 601 66.8 47.6 75.4 46.2
61
N.C. 35- 66.7 46.3
f!..1
N.C. 57 63.5 48.8
2.1
N.C. 2987 75.5 45.2
61
v«. 64-14-8- 66.2 46.4
Harrison 78.2 48.8
Mean of Test 72.2 47.3
L.S.D. (.05) N.S. 1.1
(.01) N.S. 1.5
c.v.
( % ) 13 2II
- Average of Sampson and Edgecombe County locations.
llAverage of five locations.
llAverage of seven locations.
i/Average of ten locations.
Table 7. Summary of oat performance trials in the Piedmont
11
21
31
Variety 1 yr. avg.- 2 yr. avg.- 3 yr.
avg.-or Line 1967 1966-1967 1965-1967
bu/A 1bs/bu bu/A 1bs/bu bu/A1bs/bu
4/
4yr.
avg.-1964-1967
bu/A 1bs/bu
5/
5 yr.
avg.-1963-1967
bu/A 1bs/bu
Caro1ee 107.4 33.4 99.8 33.2 100.9 32.7 93.6 32.6 91.6 31.8
Roanoke 100.8 38.0 93.4 36.4 89.8 36.1 85.3 36.0 85.9 34.8
Sumter 95.6 34.6 87.1 33.6 86.4 33.2 82.0 32.8 83.1 32.7
Bruce
(S.C. 60-13459) 98.8 36.0 92.4 35.2 ,90.6 34.7 86.4 34.4 80.4 33.8
Sumter 3
(S.C. 59-9803) 105.4 36.5 96.4 35.4 93.9 34.9 88.2 34.5
Coker 242 106.1 37.1 102.1 36.2 96.3 35.8 91.8 35.6
§/
N.C. 267 100.8 34.9 90.3 33.2 90.5 32.8
61
/34.4
N.C. 2469- 108.8 97.1 33.8 93.1 33.2
61
N.C. 2534- 109.5 34.2 100.6 34.2 99.0 33.9
61
N.C. 1972- 103.8 38.0 95.4 36.8 95.1 36.1
61
McNair 621- 101.3 36.0 94.1 35.0
61
N.C. 266- 98.6 35.6 91.0 34.2
61
N.C. 2541- 94.7 34.4
Ora 107.3 37.5
Nora 111.0 38.4
Florida 500 97.9 35.9
61
Coker 66-21- 103.2 35.1
6/
Coker 66-22- 114.1 37.4
Mean of Test 103.6 36.0
L.S.D. (.05) 11.0 1.2
(.01) 14.8 1.6
C.V. ( % ) 9 3
h1/Average of Guilford, Stanly and Davidson County locations. 2/
- Average of seven locations.
llAverage of eleven locations.
41 1 "
- Average of fourteen ocat10ns.
S i l t "
I - Average of fifteen oca 1ons.
Table 8. Summary of oat performance trials in the Coastal Plain
l/
II
1/
~IVariety 1 yr. avg. 2 yr. avg. 3 yr. avg. 4 yr. avg.
or Line 1967 1966-1967 1965-1967 1964-1967
bu/A 1bs/bu bu/A 1bs/bu bu/A 1bs/bu bu/A 1bs/bu
Caro1ee 104.3 34.9 99.6 33.6 95.5 33.4 85.8 34.0
Roanoke 77.1 35.5 75.0 34.6 71.5 34.4 65.9 35.2
Sumter 85.1 34.6 8.?2 33.8 85.2 33.9 83.0 34.0
Bruce
(S.C. 60-13459) 93.4 35.6 85.7 34.0 82.2 34.3 79.9 34.3
Coker 242 100.7 36.8 101.5 36.4 96.0 36.3 92.4 36.0
Sumter 3
(S.C. 59-9803) 97.2 36.3 91.6 35.4 93.0 35.2 89.3 35.3
&.1
33.5
N.C. 267 87.5 34.5 89.9 33.3 90.1
61
N.C. 2469- 97.8 34.9 85.0 33.8 82.4 33.6
61
N.C. 2534- 104.5 35.2 92.4 34.4 90.0 34.6
61
N.C. 1972- 94.5 37.1 85.6 36.1 83.2 35.9
61
McNair 621- 95.6 35.0 92.3 34.2
&./
N.C. 266 96.9 35.5 92.4 34.5
2/
N.C. 2541 89.8 34.7
Ora 111.7 37.5
Nora 108.4 37.5
Florida 500 98.4 36.0
~ of Test 96.4 35.7
L.S.D. (.05) N.S. 1.2
(.01) N.S. 1.7
C.V. ( % ) 11 2
11
- Average of Sampson and Lenoir County locations. 21
- Average of five locations. llAverage of eight locations. 41
- Average of eleven locations.
21Av er age of fourteen locations.
~/Experimentallines.
5/
5 yr.
avg.-1963-1967
bu/A 1bs/bu
80.9 33.4
63.1 34.2
81.6 33.7
Table 9. SUIIDIlary of wheat performance trials in the Piedmont
1/
'1:.1]/
~Iil
Variety yr. avg. 2 yr. avg , 3 yr. avg. 4 yr. avg. 5 yr. avg.
or Line 1967 1966-1967 1965-1967 1964-1967 1963-1967
bu/A lbs/bu bu/A lbs/bu bu/A lbs/bu bu/A 1bs/bu bu/A 1bs/bu
Wakeland 45.8 59.4 46.8 58.4 44.5 58.4 43.3 58.4 43.7 58.5
Ga. 1123 44.3 59.4 49.8 59.0 48.8 59.0 49.0 58.8 48.0 58.7
Knox 62 49.2 61.4 48.4 59.9 48.3 60.0 47.2 59.6 46.6 60.0
Blueboy 60.5 58.8 62.6 57.0 60.1 56.9 58.8 56.8
Andnox
(S.C. 60-9149) 42.2 60.5 45.6 60.4 44.5 60.2
6/
McNair 631- 55.7 59.6 57.4 59.2
Coker 65-20 55.2 59.5 54.9 58.9
Riley 47.9 60.4 50.1 59.8
61
N.C. 4136- 54.2 57.4
6/
N.C. 4719- 48.0 57.7
§/
N.C. 4877 42.6 57.5
Benhur 48.1 59.9
Mean of Test 49.5 59.3
L.S.D. (.05) 7.8 1.2
(.01) 10.4 1.6
c.v.
( % ) 9l/Average of Guilford, Stanly, Davidson and Lincoln County locations. ~/Averageof six locations.
l/Average of nine locations.
i/Average of twelve locations. 5/
- Average of fourteen locations.
6/E • 1 I"
Summary of wheat performance trials in the Coastal Plain Table 10.
1/ 2/ 3/
Variety or 1 yr. avg.- 2 yr. avg.- 3 yr.
avg.-Line 1967 1966-1967 1965-1967
bu/A 1bs/bu bu/A 1bs/bu bu/A 1bs/bu
!::./
4 yr. avg.1964-1967 bu/A 1bs/bu
51
5 yr.
avg.-1963-1967 bu/A 1bs/bu 6/ Wake1and-6/ Ga. 1123-B1ueboy Andnox 6/ (S.C. 60-9149)-6/ *McNair 631-7/ Coker 65-20-*N.C. 4136 8/ *N.C. 4719-*N.C. 4877 6/ Ri1ey-L.S.D. (.05) (.01)
c.V. ( % )
39.7 58.7 38.2 56.6 41.8 57.3 42.1 57.2 42.4 57.5
33.2 59.4 40.2 57.5 42.2 57.5 43.3 57.2 43.6 57.5
62.6 58.7 57.3 56.2 56.2 56.2 56.5 56.0
36.6 61.0 37.6 59.0 38.4 58.9
48.8 57.9 48.6 56.6
41.1 58.9 42.2 56.8
53.1 58.2 42.8 59.9 53.7 57.5 36.8 61.4 44.8 59.2 N.S. N.S. N.S. N.S. 10 1/
- Average of Sampson and Lenoir County locations. 21
- Average of five locations. 3/
- Average of eight locations. 4/
- Average of eleven locations. 5/
- Average of fourteen locations 6/
- Slight bird damage in Sampson County. 7/
- Moderate bird damage in Sampson County.
Table 11. Lodging Data Variety or Line SC 59-1018 Wade Colonial 2 Rogers Davie N.C. 2116 Harrison McNair 601 N.C. 35 N.C. 57 N.C. 2987 Va. 64-14-8 Caro1ee
Bruce (SC 60-13459) Sumter 3 (SC 59-9803) N.C. 2534 N.C. 1972 N.C. 2469 N.C. 267 Sumter Coker 242 Roanoke McNair 621 N.C. 266 N.C. 2541 Ora Nora Florida 500 Co~er 66-j1 Coker 66-22 WHEAT Ga. 1123 Wakeland B1ueboy McNair 631 Coker 65-20 Riley N.C. 4136 N.C. 4719 N.C. 4877 Andnox Benhur Knox 62
1 yr. avg.
II
1967-7.5 10.0 67.5 67.5 37.5 2.5 0.0 13.8 43.8 11.2 10.0 3.8 41 1967-36.5 65.2 15.0 15.0 . 6.6 15.3 13.1 41.2 27.6 60.8 24.9 38.3 29.1 20.7 14.6 32.9 34.4 60.071
1967-15.0 23.8 1.2 42.5 18.8 0.0 5.0 11.2 0.0 13.82 yr. avg ,
2/ 1966-1967-14.0 31.0 80.7 63.4 63.6 24.0 4.7 31.8 5/ 1966-1967-45.6 59.4 42.8 22.0 19.7 16.8 16.3 50.4 37.7 55.4 40.7 36.8
81
1966-1967-14.1 41.4 1.5 31.8 13.8 7.23 yr. avg.
3/ 1965-1967-16.9 24.3 78.1 58.4 58.2 23.9 7.8
61
1965-1967-43.0 49.8 41.6 21.7 20.8 14.9 15.4 50.1 33.1 46.091
1965-1967-12.3 36.6 1.5l/Average of one location. l/Average of three locations. llAverage of seven locations.
i/Average of three locations.
11Average of eight locations.
i/Average of fourteen locations.