ABSTRACT
VANGALA, RAVIKANTH. Dynamic Process/Quality Control System using Structural Equations – Applications in Ring Spinning and Continuous Dyeing. (Under the direction of Dr. Moon W. Suh).
Real-time diagnosis of abnormal variations in processing has always been a challenging task for most manufacturers with continuous/contiguous processing sequences. Despite the rapid advancements in technology in quality monitoring systems, attaining quality as per customer requirements is still a predominant issue for these companies. Hence, there is an urgent need for development of a new and better method for modeling and monitoring of abnormal variations to optimize quality costs in production, and consequently improve profits. This research study is a part in response to this call. A dynamic quality control system was developed, by integrating and enabling three key concepts, namely – concept of bias separation and estimation through structural equations, concept of variance tolerancing, and concept of dynamic control limits. According to this novel system, the changes observed in prior processes update process averages and control limits of the current process through structural relationships that link those two stages. By applying the concept of variance tolerancing, a new set of control limits are obtained, which are functions of dynamic process averages and variances.
( ) ( )
Dynamic Process/Quality Control System using Structural Equations – Applications in Ring Spinning and Continuous Dyeing
by
Ravikanth N Vangala
A dissertation submitted to the Graduate Faculty of North Carolina State University
in partial fulfillment of the requirements for the degree of
Doctor of Philosophy
Textile Technology Management
Raleigh, North Carolina 2013
APPROVED BY:
_____________________________ _____________________________
Dr. Moon W. Suh Dr. Perry L. Grady
Chair of Advisory Committee Committee Member
__________________________ ____________________________
DEDICATION
BIOGRAPHY
Ravikanth Vangala, born and raised in Hyderabad, India received his Bachelor of Technology degree from University College of Technology, Osmania University in Textile Technology in 2006. Aspiring to pursue his education at a highly reputed institution, he joined NCSU, and earned his Master of Science degree in Textile Technology from the College of Textiles with a minor in Statistics in 2008. During the Master’s program, Ravikanth worked on Design of a Dynamic Quality Control System for Textile Processes under the direction of Dr. Moon W. Suh.
In Fall 2009, Ravikanth decided to pursue his Ph.D. in Textile Technology Management. As a graduate student at College of Textiles, NC State, Ravi has been working in the area of Quality Management and Control for the past six years. During his graduate study, he had opportunity to intern at Buhler Quality Yarns, GA as a Process Improvement Specialist and Lean Six Sigma Black Belt Consultant at Arden Companies, Sanford, NC. He received his certification and training in leadership through Graduate Leadership Development Seminar Series, a part of Preparing Future Leaders initiative started by the Graduate School at NC State. Throughout his Doctoral study, he was actively involved in many non-academic initiatives. He served as a Co-President of Textile Entrepreneurs Club, active, volunteered in many community service activities and is currently serving as a Department Ambassador for TATM Department, College of Textiles.
ACKNOWLEDGEMENTS
I would like to take this opportunity to sincerely thank all the people who have been supremely influential in my academic and personal life. Without their patient support and guidance this dissertation research would not have been possible.
Firstly, I would like to express my deepest gratitude to my advisor and mentor Dr. Moon W. Suh, for his excellent guidance, everlasting care and patience and most importantly for providing me with invaluable lessons that helped me grow professionally and personally. I would like to sincerely thank Dr. Marguerite Moore for her continuous encouragement and support and also for her tireless efforts in instilling in me enthusiasm, optimism and strong leadership qualities. I am also thankful to Drs. Perry Grady and Kristin Thoney-Barletta for contributing valuable insights from their humongous experience and
expertise and serving as a member on my committee. I offer great appreciation to Dr. Timothy Clapp and Dr. Erin Powell for supporting my research work and graduate
studies for a period of one year. My genuine appreciation is extended to members of the College of Textiles, the Textile and Apparel Technology and Management department (TATM). Heartfelt thanks to Rob Cooper, Tywanna Johnson and Traci Figura for their patient support.
TABLE OF CONTENTS
LIST OF TABLES ... viii
LIST OF FIGURES ... ix
Chapter 1 Introduction ... 1
1.1 Problem Statement ... 2
1.2 Research Objectives... 5
1.3 Significance of this Research Work ... 6
Chapter 2 Literature Review ... 8
2.1 Definition of Quality, Process Control and Quality Control ... 8
2.2 History of Quality & Quality Management in Textile Industry ...10
2.2.1 History and Evolution of Quality Control in Spinning...11
2.2.2 History and Evolution of Quality Control in Dye Processing ...12
2.3 Evolution of Quality Principles in Textile Industry ...15
2.4 Statistical Quality Control (SQC)/ Statistical Process Control (SPC) ...19
2.4.1 Control Chart Technique ...21
2.4.2 When to Use a Control Chart ...22
2.4.3 Comparison of Control Chart Methods ...23
2.5 Investigation of Quality/ Process control parameters that influence textile processing sequences ...30
2.5.1 Quality/ Process control parameters that influence Spinning process ...31
2.5.2 Quality/ Process control parameters that influence Dyeing process ...33
2.6 Current Scenario of Quality Control Systems in Textiles ...40
Chapter 3 Research Methodology ... 48
3.1 Purpose of the study ...48
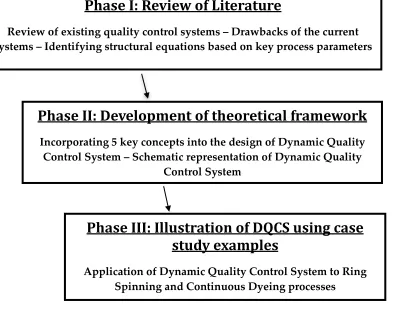
3.2 Research Design ...48
3.3 Definition of a Dynamic Quality Control System ...50
3.4 Development of theoretical framework for Dynamic Quality Control System ...52
3.4.1 Concept of Bias Magnification & Separation through Structural/Functional Relationships ...53
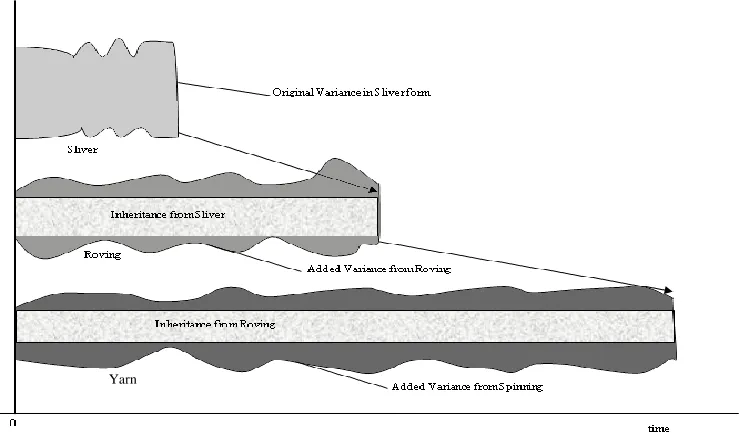
3.4.2 Concept of Additive Biases and Variances ...59
3.4.3 Concept of Variance Tolerancing ...60
3.4.4 Concept of Dynamic Control Limits ...62
3.4.5 Concept of a Combined Feedforward-Feedback system ...64
3.5 Design of Dynamic Quality Control System ...65
Chapter 4 Application of Dynamic Quality Control System ... 69
4.1 Application of Dynamic Quality Control System to Ring Spinning process ...70
4.2 Application of Dynamic Quality Control System to Continuous Dyeing process ..82
Chapter 5 Concept Validation and Graphical Illustration... 88
5.1 Concept Validation using Data Simulation ...89
5.2 Graphical Representation of Dynamic Quality Control System ...93
Chapter 6 Major Results & Future Work ... 99
REFERENCES ... 102
APPENDICES ... 111
Appendix A ... 112
LIST OF TABLES
Table 1 Pros and Cons of most frequently used Control Chart Methods in Textiles ... 29
Table 2 Key fiber parameters that influence pre-spinning process ... 33
Table 3 Typical properties monitored/controlled by control systems in Dyeing ... 36
Table 4 List of Process Parameters that influence Dyeing process ... 40
LIST OF FIGURES
Figure 1 Evolution of Quality Princinples over years ...16
Figure 2 Research Design for Development of Dynamic Quality Control System ...51
Figure 3 Unbiased and Biased Signals ...55
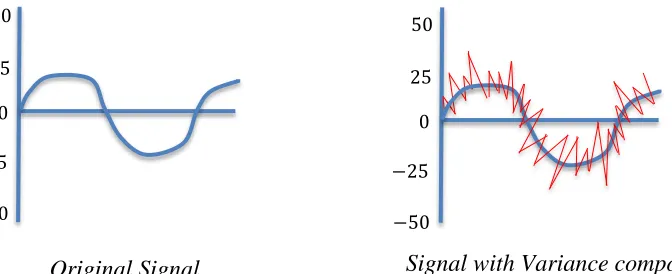
Figure 4 Signals without and with Variance Components ... 55
Figure 5 Schematic Diagram of Inheritance of Variance from Previous Process Stages 60 Figure 6 Schematic Diagram of a Dynamic Control Chart ... 68
Figure 7 Validation steps for Dynamic Control Chart Concept ...87
Figure 8 Framework for Concept Validation ...89
Figure 9a Simulation of Input data using Microsoft Excel Software ...92
Figure 9b Simulation of Output data using Microsoft Excel Software ...93
Figure 10a Comparison of input parameter R with/ without variance components ...95
Figure 10b Comparison of input parameter M with/ without variance components ...96
Figure 11 Output parameter based on input parameters ...97
Chapter 1
Introduction
Analysis of materials, processes, and products is a part of the current emphasis on continuous quality improvement found in many industries worldwide. Textile industry is not an exception to this trend as the concept of quality has become very important within the textile and apparel industry in the recent past. With the advent of fully
automated/computerized modern machinery and emergence of global marketplace, the expectations and demands of consumers have increased at an alarming rate (Hohener, 1990). Although the textile marketing chain is long and complex, globalization of the textile
industry has resulted in closer integration of supply and demand of textile manufacturing and associated dyeing and finishing services, in any region of the world. This increased
competition directly or indirectly affects materials producers, manufacturers, retailers, and consumers.
Quality has definitely become the most predominant factor in determining the
international competitiveness of all industrial products especially as the economic war among nations intensifies globally. Companies that do not meet the international standards such as International Organization for Standardization (ISO), British Standards Institution (BSI), American Society for Testing and Materials (ASTM), International Wool Textile
Because of the large machine –material and human interaction, the textile
manufacturing processes have more variables than any other industrial process and hence, the product qualities and products are highly variable, difficult to define, and expensive to
measure for several reasons. Statistical tools such as histograms, pareto charts, regression analysis, trend charts, control charts, etc. have been in use from a long time in the textile dry and wet processing industry as they are widely employed for monitoring, forecasting and evaluating properties of raw and processed materials. However, as identified by researchers earlier, the most significant factor that limits the value of statistical quality and process control in textile processes is that statistical control is often impracticable owing to the biases and variances (errors) of previous processes and other interacting factors. The statistical control of random components in the complete absence of physical and structural
relationships often generate an endless amount of data that cannot be converted to cost or productivity figures.
Despite the advancements in technology and production-monitoring systems, attaining these quality requirements seem to be a distant task as on-line systems for
monitoring the quality of material at different stages of processing have not yet received due importance. Thus, there is a need and requirement for development of new methods for modeling and automated monitoring of key parameters in the textile dry and wet processing industry in order to optimize quality control in production, which consequently will improve profits. This research study is a part in response to this call.
1.1 Problem Statement
sustainability in profits for all textile operations, the survival and further growth of a manufacturing plant or a dye house depends on their efforts in addressing other key issues such as, reducing total cost of quality, increasing value-added manufacturing such as adaptation of newer technology and improving productivity (both machine and labor) (Lyford; Welch, 2004).
In a complex and dynamically changing production environments such as spinning and dyeing, there is a paramount danger in focusing on just one of the two prerequisites to success: high productivity and high quality. But, in today's business environment, the drive to introduce new technologies has been stimulated mainly by the need for increased production. In the textile industry, the low-cost competitors have forced many manufacturers to
compromise on quality to be more cost competitive in the face of the global competition (Dinsdale, 2004). However, the importance of quality cannot be understated. Better quality products have always been in demand and despite, the production costs being higher, these manufacturers have been able to compete in international markets. For example, the combed Supima cotton yarn from the United States represents high quality product that can compete over low labor cost products from across the globe. With the competitiveness in low-wage countries, products with high quality have made the European manufacturers an example of a major exception in competing with low-price products (Sabanci, 2005).
per item, and therefore, forcing the manufacturers and dyers to ignore more mistakes and imperfections either by offsetting or by widening the existing control limits to the extent that they become irrelevant. Hence, it can be said that contemporary fashion consumption
patterns have a direct correlation with lower garment quality.
According to Ravasio (2012), the average life span of a garment has reduced
significantly in the past few years because of poor quality and if the same trend continues, it can be safely speculated to decrease even further in the years to come-by. Thus, it has become more important than ever to provide an effective system to accurately control and continuously monitor the quality of production. The continuous flow of new innovations in terms of process methods in production in textile industry over the past few decades have definitely led to increased automation and increased speed of operations. However, in order to gain cost competitiveness over the low labor costs in developing countries and to respond quickly to the global customer demand, many spinning mills and dye houses have invested mostly in advancements in technology that yield significant benefits in productivity, and made adjustments in their deficiencies in quality by offsetting or widening the control limits (Dicken, 2003). This certainly leads to a situation where the manufacturer fails to detect a true out-of-control situation resulting in frequent false alarms and unwarranted process calibrations. Hence, despite the widespread use of statistical tools and standard procedures alongside appropriate well advanced equipment and personnel, most manufacturing and processing plants have not been able produce quality products with desirable profits to thrive and compete in domestic as well as international markets (Jordan, 2001).
cost of poor quality (which ranges anywhere between 5% and 20% of sales for most
manufacturing companies) is at an average of 14% of sales for textile and apparel industries. With the aid of the dynamic quality control system, the cost of quality for an average
manufacturer (sales turnover of $20 million USD) can go down to as low as 6% of sales, thus improving profits by almost $1 million USD and as high as 50% (Bheda, 2010). Thus, a small reduction in quality costs at each stage of textile processing may easily double or triple the current profit margins, especially for the U.S. domestic textile industry, which is
currently operating at low profit margins.
As Suh et al., (2006) pointed out the root cause for the failure of existing quality and monitoring systems have to be pointed out accurately and investments have be made in developing newer and efficient methods that can improve the quality in both spinning and dyeing processes. One of key issues for failure that has been identified is the incongruent application of current static control systems in the complex textile production environment, which is dynamic and interactive in nature. This has not only resulted in lower quality products but also in loss of production time, materials and consequently profits. Hence, there is an immediate need to replace the existing static and inflexible control systems with an automated dynamic quality control system.
1.2 Research Objectives
RO I: To develop a working model of dynamic process/quality control system based on known structural equations that predicts process average of the current process from the prior processes.
RO II: To provide a set of dynamic control limits based on the means and variances of the prior processes around the dynamic process average.
1.3 Significance of this Research Work
There is a need to reverse the current trend of shorter processing sequences accompanied by reduced quality safeguards that increase the risk of producing an
unacceptable product. The common assumption in textile industry is that random variation in processing occurs inherently and there is no way it can be controlled. However, the signal that generates these biases is being ignored completely. Valid structural equations can be used to relate the signals to biases and variances generated, thus providing a way to understand the root-causes for out-of-control situations that arise frequently during
continuous/contiguous processing. Need for a dynamic control system in textile processes is evident from the fact that it is one of the only few manufacturing sequences where a static control system is still being used to monitor, control and reduce the amount of variations that occur during processing.
Although, manufacturing sequences currently employ online quality control systems, the static control limits at a given stage of continuous processing sequence mode are fixed and non-reactive to any dynamic changes that occur due to the previous processing stages. Hence, the use of such static target reference in a continuous, dynamic production
environment causes frequent false alarms when the changes in process averages originate from the prior process stages. Moreover, since biases and variances get introduced at each and every processing stage in a continuous process, use of dynamic and flexible control limits is mandatory in a rapidly changing production environment.
This novel dynamic quality control system aims to minimize the unnecessary corrective actions (false positives), loss of production time, materials and profit, and
However, because of incorporation of structural equations, this new system provides a way to back-tracking of the responsible factors and processing conditions that may have produced the specific out-of-control situation, thus providing an effective solution rather than a disappointing guess work. The prototype of this system can also be widely applied for quality control in various other manufacturing environments where the processing sequence is either continuous or contiguous in nature.
By monitoring quality using this novel technique of Dynamic Quality Control System, manufacturers will be able to produce high quality textile products at lowest price. One of the prime functions of a dynamic quality control chart in spinning is the separation of biases and variances generated in the previous stage from the current stage. By separating and acting upon the biases and variances at each stage results in minimization of false positives and unnecessary corrective actions, as root cause of ‘out-of-control’ situations can be easily traced, generating an optimal control strategy at each stage of processing. The feedback and feedforward control schemes used so far in the spinning process have been mechanically driven only. Hence, by incorporating structural equations in the design of a combined feedforward-feedback control scheme over-all control at spinning is achieved. The dynamic control chart technique not only helps to ensure that the over-all quality is
maintained and but also helps the manufacturer to lower his processing costs, minimize the expenditure on testing and produce better quality goods.
Chapter 2
Literature Review
2.1 Definition of Quality, Process Control and Quality Control
The concept of “Quality” has been contemplated throughout history and continues to be a topic of intense interest today. ‘Quality’ presently is the buzz-word among managers and executives in contemporary organizations and according to Feigenbaum (1982), “Quality is the single most important force leading to the economic growth of companies in international markets”. In a survey conducted in the year 1990, executives ranked the improvements of service and product as the most critical challenge facing U.S. business (Zeithaml,
Parasuraman & Berry, 1990).
According to Clapp et al. (2001), a search for definition of ‘Quality’ will yield inconsistent results as it has several definitions given by various researchers during a span of over 50 years. For example, Quality has been defined as ‘Value’ by Feigenbaum in 1951 and Abbott in 1955; as ‘Conformance to Specifications’ by Levitt in 1972 and Gilmore in 1974; as ‘Fitness for Use’ by Juran in 1974; as ‘Conformance to Requirements’ by Crosby in 1979; as ‘Meeting and/or Exceeding Customers Expectations’ by Gronroos in 1983, Parasuraman, Zeithaml & Berry in 1985 and as ‘Loss Avoidance’ by Taguchi, cited by Ross in 1989.
According to Box, et al. (1976), ‘Control’ in industrial/manufacturing environment, refers to “our desire to affect the outcome of some process or set of conditions” and in these environments knowledge of how the process should behave under normal conditions is used to identify and eliminate the process variations. From a purely statistical perspective, we may interpret ‘control’ to mean achievement of control via the quality control techniques. From a control engineering perspective, we may tend to think of ‘control’ in terms of feed-forward and feedback control loops, the dynamics and stability of the system and of particular types of control devices required to carry out the control action.
Box, et al (1976), also defined ‘Process Control’ as “the regulation or manipulation of variables influencing the conduct of a process in such a way as to obtain a product of desired quality and quantity in an efficient manner.” ‘Process Control’ in general terms refers to eliminating the special causes of variation from the process and to achieve desired target values and it is one of the most important and critical aspects of quality assurance. Feigenbaum (1951) gave an excellent definition of ‘Quality Control’ keeping in view the consumer satisfaction aspect long before the concept of customer satisfaction started playing a prominent role in world trade: “Quality Control is an effective system for coordinating the quality maintenance and quality improvement efforts of the various groups in an
organization so as to enable production at the most economical levels which allow for full consumer satisfaction”.
2.2 History of Quality & Quality Management in Textile Industry
Today quality is such an important commodity to both consumers and producers that it has become a goal within many companies. However, Quality Control is not a new concept to the textile industry. Even during the ancient times quality control in the textile industry always had its own importance. The earliest quality engineer was probably the first Homo sapiens who smoothened a wheel or sharpened a tool to free it from blemishes thereby improving its rolling ability or increasing its cutting power (Gunter, 1998). Quality and its management have always been important in human life since ancient civilizations and their standardization policies can be regarded as the first step towards quality. In ancient Rome, a uniform measurement system was introduced for manufacturing bricks and pipes; and regulations were in force for the construction of buildings. Water clocks and sundials were used in ancient Egypt and Babylon (15th century BC). The Chinese Song Dynasty (10th century) had specifications on the quality factors such as shape, size, and length etc., of products in handicrafts. Socrates, Sun-Tzu and Aesop are also among those few prominent people around the world who emphasized the importance of quality management. (Reeves & Bednar, 1994).
The modern quality movement started on May 16, 1924, when Walter A Shewhart, an employee of Bell Labs, sent a one page memo to his higher authorities describing a method for improving the quality of telephone manufacturing using statistics which also included the drawing of probably the first control chart (Brocka & Suzanne, 1992). Prof. Walter
2.2.1 History and Evolution of Quality Control in Spinning
The yarn manufacturing area of the textile industry offers a wealth of data for statistical analysis. Articles on the statistical quality control of textile yarn manufacturing products such as sliver, roving, and yarn date back to the late 1940s and 1950s. In these articles, the emphasis is on product quality and defect detection rather than on defect prevention through process control and quality improvement. Unfortunately, even in those articles which focused on quality control, there has been hardly any usage of the structural equations or relationships between the input and output factors. In spun yarn manufacturing, quality control and quality assurance has been and continues to be, in most cases, a very much-departmentalized function. It is also very much dominated by production concerns for the majority of textile operations. Quality testing has predominantly focused on three areas: 1) end product testing of characteristics such as linear density (sliver weight, hank roving, or yarn count), twist, strength and elongation, short-term evenness, and count variation; 2) inspection (defects such as thick and thin places, slubs, and neps; repeating faults such as mechanical errors or drafting waves); and 3) frequency checks for end breaks during spinning.
For faster feedback, some yarn manufacturers are beginning to move some test
It is however, very costly, and when unacceptable levels are found and lots rejected, losses are great in terms of raw materials, wasted manpower, and improper utilization of processing equipment. Furthermore, the cost of unproductive inspection is far too high. As the focus moves toward process control, defect prevention, and quality improvement, the need of inspection markedly reduces.
Electronic controls and monitoring, when used correctly and effectively, can be a valuable asset in defect prevention and SPC. The problem with most continuous electronic controls (for example, feed-control autolevellers for carding and drawing) is that adjustments are made on predetermined target values. This is in contrast to properly using statistical control limits to determine when to take corrective action. This leads to far more variation through over-control than would occur were the process controlled manually through the use of control charts. Dhillon (2007) states that quality assurance still remains as much a
departmentalized function as it was since its first application, dated back to late 1940’s. He further expressed concerns about the fact that quality control in yarn manufacturing has not changed much in the past 50 years or so as the emphasis still remains on product quality and defect detection rather that defect prevention.
2.2.2 History and Evolution of Quality Control in Dye Processing
1989). For most parts of the 20th century, treating fibers, yarns and fabrics with mordants before dyeing was the process followed dyers from Middle-east, Asia and parts of North Africa used mordants such as Alum, Iron, Copper, Cream of tartar and Common salt as these regions were rich with deposits of these minerals (nicDhuinnshleibhe LS, 2000).
About 150 years ago, W H Perkin unexpectedly discovered the first aniline dye called “mauve” and this incident, best described as the ‘chemical miracle’ was well documented by many researchers (Holme, 2006). This discovery by Perkin had a significant impact on textile and apparel industry as it led to the establishment of the synthetic dye-manufacturing industry worldwide. Soon after this discovery, both manufacturing and educational
institutions put-in huge efforts in researching and developing newer dyestuffs, which later became the characteristic of the industry. Also, research conducted by fiber producers and other industries such as pharmaceuticals and agrochemicals contributed a lot to technology of dye application and formation of dye intermediates, which in turn helped in the growth of other smaller industries (Park and Shore, 2007). As Hauser (2006) points out, economic forces, market demands and environmental concerns have been the key factors that have driven innovation and automation in the wet processing, which still remains a very important component of the textile industry.
Researchers have also discussed quality control of yarn package dyeing based on circulating liquor machines and automation (Gailey, 1975 and Park, 1983). The development of ‘Parallel Sided Dyeing Package’ (PSDP) improved the quality and productivity for yarn package dyeing (Mason, Park, Thompson, 1980). During the mid 90’s, development of circulating-fabric machines and instrumental methods of color assessment helped in
acquiring RFT dyeing production which is considered as a benchmark in quality control by most dye houses. Towards the end of the 20th century, rapid technological developments combined with the advent of globalization necessitated the development of reliable dyeing methods with a high degree of precision to achieve reproducible high standards of levelness. With companies competing globally, there is more demand than ever before to produce the highest quality material in the shortest time possible (Shamey, 1998).
Although, these developments have led to a considerable improvement in dyeing process quality, the dyeing and finishing industry is still desperately in the need of newer and efficient methods of quality monitoring and control in dye processing and functional
treatments of textiles. Controllers for dyeing have been using predetermined set points and not statistically calculated control limits to make adjustments, signal alarms and /or stop the operation. This leads to an over-control situation and increased variation for the process. In order for dye-houses to effectively use the monitoring and controlling equipment available today, the following items must be addressed:
Statistical control of raw materials (including dyes, chemicals, water, fabric) Statistically calculated control limits for key process parameters
Use of spectrophotometers to establish dye formulas, determine color additions, and evaluate the final shade, or color of the fabric.
basis. However, this is a necessary requirement for optimization of the production sequences and therefore it is essential to improve the accuracy by means of statistics. Therefore, there is an urgent need to promote new technologies in textile dyeing and finishing, injecting new thoughts to the industry.
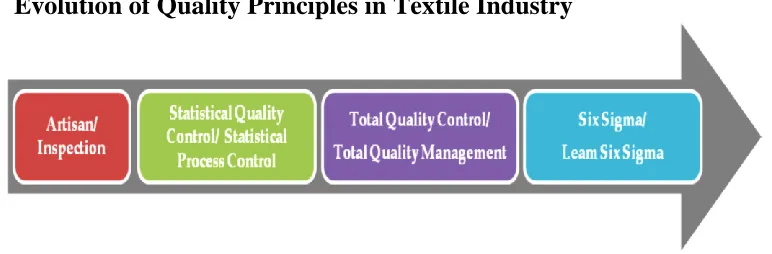
2.3 Evolution of Quality Principles in Textile Industry
Figure 1. Evolution of Quality Principles over the years
Quality Control is not a new concept to the textile industry. Even during the ancient times quality control in the textile industry always had its own importance. Clapp et al (2001) discussed about the earliest standards that were set in quality control for textile industry which date back to about 5000 BC. The paper suggests that the Zhou Dynasty (11th to 8th century BC) in China was so particular about the quality of cotton and silk fabrics produced that it issued a decree that stated “Cottons and silks of which the quality and size are not up to the standards are not allowed to be sold on the market”. The fabric producers who did not meet these standards had to pay hefty fines as a punishment.
Artisan/ Inspection: The age old concept of quality assurance in the textile manufacturing was based on inspection of 100% of product items to sort the good from the bad before the products reached the consumers. According to Kadolph (1998), several companies continued employing the concept of quality assurance until early 80’s, viewing quality as a factor or a group of factors that can be controlled by inspecting finished products. In these inspections the satisfactory or acceptable products that passed were sold at normal prices while
unacceptable products were sold as seconds at a lower price. This process was tedious, time consuming and laborious, and moreover, to guarantee 100% quality through examination is quite impossible for any manufacturing industry and especially for Textile Industry.
Companies then defined a level of quality for any output, a set of inspection procedures and product specification rules, referred to as acceptance sampling which ensures that all efforts are directed toward achieving these specific goals. In simple terms, a set of communication tools between the user and the producer of the product were developed (Dodge & Romig, 1959).
Statistical Quality Control (SQC)/ Statistical Process Control (SPC): The second generation of quality assurance development in textile manufacturing started with the advent of SQC/SPC techniques. The main objectives of the SQC/SPC programs were to keep the variability of a process or product within the customer specification limits. Much progress has been made in the application of SQC/SPC in textiles over the past three decades. The first reports of application of SQC methods in yarn manufacturing products appeared to be during the late-1940s and 1950s (Clapp et al., 2001). These methods focused on defect detection rather than defect prevention. The majority of companies to first practice quality improvement utilized Crosby based principles and many employed the use of quality circles in their organizations. This was followed in the mid-1980s by an increased emphasis on Shewhart control charts, Deming practices for continuous improvement and the Juran’s approach to quality improvement.
point “end product testing of characteristics, count variation and frequency checks for end breaks during spinning” as the key areas in spun-yarn manufacturing where statistical process control was applied predominantly during the last decade. In recent years, almost every sector in textile industry started implementing SPC as technologies in textile machinery and product specifications have been changing rapidly imposing new quality demands. Also, increasing computing power, availability of numerous SPC software programs and the increasing competition at both local and international levels permit real-time control charts. These online quality control systems are used to describe the statistical process control concepts such as control charts, cause and effect diagrams and process capability studies, which led to the successful minimization in rejections.
According to Engin (2004), the latest trends in quality and process control in yarn manufacturing and processing is Offline/Online Process Control, which is implemented either by means of sampling process control (also called offline process control) or by an automatic process control (also called online process control) at every processing stage. Some of yarn quality characteristics such as yarn breaking force, yarn elongation and yarn hairiness, cannot be measured by online process control. The process of dyeing a textile fabric is one of the most monitored and automatically (online) controlled processes in the entire textile manufacturing chain. The finishing processes, however, are at the other end of the spectrum with fewer controls and heavy reliance upon inspection and testing. In fact, most mechanical finishing processes are considered to be much more art than science. This leads to a great deal of subjectivity whenever evaluating finishing processes. Process parameters such as temperature, pH, rate of temperature rise and cooling for the dyeing process have been widely known, documented and monitored through sampling (offline) process control for many years. Hence, even in the most technologically advanced
manufacturing plants, a combination of sampling and automatic process control techniques are employed (El Mogahzy, 1992).
the entire system of providing a quality product or service. Sensing that meeting customer needs, requirements, and expectations involved more than providing a product or service, industry began to integrate quality into all areas of operations. This integrated approach, involving all departments in a company in providing a quality product or service, became known as Total Quality Control (TQC) (Ishikawa and Lu, 1985). Total Quality Management (TQM) is a management approach that places emphasis on continuous process and system improvement as a means of achieving customer satisfaction to ensure long-term company success. From 1981, Milliken & Co. started implementing the flat organization structure to address specific problems and to change and improve processes in all areas of the company. Since then, most of the textile companies have been following the concept of TQM. With the introduction of ISO series of standards in the United States and across the globe, the textile industry has quickly adapted the new quality assurance systems as they found value in using these standards for their quality systems, thus increasing both imports and exports of fiber, textile and apparel from U.S. (Clapp et al, 2001).
Six Sigma / Lean Six Sigma: Six Sigma method is a project-driven management approach to improve the organization’s products, services, and processes by continually reducing defects in the organization (Kwak and Anbari, 2004). There have been two major
perspectives about Six Sigma. First, discusses the origin of Six Sigma from statistics (Hahn et al., 1999; Montgomery, 2001). From a statistical perspective, Six Sigma is defined as ‘having less than 3.4 defects per million opportunities or a success rate of 99.9997% where sigma is a term used to represent the variation and the process average’ (Anony and
Banuelas, 2002). Second, from a business perspective, Six Sigma is defined as a ‘business strategy used to improve business profitability, to improve the effectiveness and efficiency of all operations to meet or exceed customers’ needs and expectations’ (Antony and Banueals, 2001).
followed quality initiatives such as Total Quality Management (TQM) and Continuous Quality Improvement (CQI), is viewed as a more comprehensive method for many companies seeking to improve their performance and effectiveness (Anbari, 2002). It has gained an avid following among executives and managers not only for its ability to reduce cycle time, eliminate product defects, and dramatically increase customer involvement and satisfaction but also since it includes measured and reported financial results, and uses advanced data analysis and project management tools (Pande and Holpp, 2001).
The rapid developments in sensors, microprocessors, and computing storage technologies together with ever-declining costs for these provide the textile industry with both enormous opportunity and a dilemma. Researchers advocate that these new applications call for a new approach to quality based on design aspects. Many companies in industries other than the textile industries started implementing Six Sigma quality programs in their management strategy and reaped the benefits. According to Kumar, R.S (2010), although textile industry being a field dealing with lots of variations and defects in each process was an ideal platform for application of Six Sigma quality programs, many companies in industries other than textiles started implementing Six Sigma quality programs and reaped benefits much before DuPont made Six Sigma a key component of their management strategy. Later on other leading fiber, textile and apparel companies such as Burlington Industries, Unifi, Collins and Aikman, PGI etc., started implementing Six Sigma initiatives. A combination of Lean methods with Six Sigma approach is called Lean Six Sigma, which focuses on reducing costs through process optimization (IBM Institute for Business Value, 2007).
2.4 Statistical Quality Control (SQC)/ Statistical Process Control (SPC)
identify, control and ultimately eliminate special causes of variation in the process, referring to these methods as Statistical Quality Control (SQC).
According to the American Society for Quality (2004), the most frequently used SQC/ SPC methods are:
Cause and Effect – A chart used to examine factors that influence a given condition
Flow Chart – A chart used to delineate the steps in a process
Pareto Chart – A chart used to determine priorities indicating the most significant factors
Trend or Run Chart – A plot of the data used to determine patterns of behavior
Histogram – A chart used to measure the frequency of occurrence
Scatter Diagram – A chart which demonstrates the relationship between two variables
Control Chart – A trend chart with statistically determined upper and lower limits on either side of the process average
Deming identified several different charts to achieve statistical control of a process and most manufacturing companies implement Deming’s SPC/SQC via use of the Control Chart. SPC/SQC assumes that every process has variation and a control chart, which help us to identify, analyze and control variations in each process. A process is said to be in control when no points fall outside the upper and lower control limits and there are no special patterns observed in the points. SPC/SQC seeks to minimize that variation via these control charts by assisting us in identifying and ultimately deciding which control actions should be taken to eliminate the source of that variation. The successful SPC/SQC programs utilize statistics to identify and eliminate special causes of variation, thereby driving the process into a steady state of control. Once control has been achieved, the use of control charts is
continued to monitor the process so that aberrations can be quickly identified and resolved maintaining a steady state or controlled process (Walton, 1986).
the variability in quality, proper screening actions on input variables and other pre-production planning activities and application of industrial experimentation are generally recommended. In other words, the variability in quality that occurs in an actual production process should be either ‘error’ or ‘natural/inherent variability’. Hence, it is very important to monitor this ‘error’ variability and necessary measures should be taken so as to maintain this ‘error’ constant over a time, across various machines.
Over a period of time variations owing to special causes are bound to occur due to changes in raw material or operatives or sudden machine failures. Therefore the process is usually sampled over time, either in fixed or variable intervals. The presence of special causes can be monitored by considering a control statistic such as the mean ( ) of a sample of units taken at any given time. The approximate probability distribution of the control statistic can then be used to define a range for inevitably common cause of variation, known as control limits. This allowable variation can also result in false alarms. That is, even when no special causes are present, we may be forced to look for the presence of special causes. This false alarm probability is usually kept low by using a signal rule for special causes.
2.4.1 Control Chart Technique
Rudnick (1950) defined a Control Chart as a graphic tool, which displays the summary statistic of the characteristics of interest and tests the existence of a state of
The application of the control chart technique in the presentation and interpretation of inspection data has increased the effectiveness of quality control in textile manufacturing. In applied textile research the control chart method can make a valuable contribution. The advantage in the application of this technique lies in increasing the personal efficiency of the research worker. Characteristic of reproducibility can be judged by the establishment of a criterion, which specifies that variation in the data exists due to chance alone or which specifies whether or not a state of controlled conditions has actually been obtained. The knowledge of quality control chart methods facilitates the planning of the comparison. The principles to follow in sampling are emphasized in discussions of the control chart technique, the use of rational subgroups, frequent small samples instead of infrequent large ones and the grouping of data on the basis of the order of production.
Tague (2004) defines control chart as “a graph used to study how a process changes over time”. Further, she states that in any control chart there is always a central line and upper and lower lines for the averages, upper and lower control limits respectively and these lines are obtained by utilizing the historical data. A process can be determined whether it is in control or out of control based on the position of the process average with reference to upper and lower control limits. A process is said to be out of control if the process average is above or below the upper and lower control limits respectively. According to Tague, pairs of control charts are generally used for variable data with the top chart monitoring the average and the bottom chart monitoring the range. However for attribute data, control charts are used singly.
2.4.2 When to Use a Control Chart
(2010) suggests that a control chart can be used to find problems and correct them on a continuous basis, to predict expected range of outcomes from a process. In addition, control charts help determine if the process is in statistical control, analyze special and common causes of variation in process and help determine if there is a need to prevent these problems or make fundamental changes to the process.
2.4.3 Comparison of Control Chart Methods
With rapid advancements in data acquisition and computing technologies in last two decades, many researchers such as Woodall and Montgomery (1999), Stoumbos et al. (2000), Woodall (2000) points that multivariate control charts would play a greater role in
monitoring and improving manufacturing processes. Hence, there is a need for conducting more research to develop new control charts. In order to carry out new research, the available control charts have to be thoroughly studied, compared and analyzed first and developments have to be based on the drawbacks in the existing systems. Reynolds Jr. et al (2011) suggests that large and transient shifts could be effectively and efficiently detected only through the traditional Shewhart control charts and hence, they have widespread applications in manufacturing even today. However, claims made by researchers such as Ben-Gal et al. (2003) clearly indicate that Shewhart control charts are completely ineffective for detecting small changes in process parameters and hence, other types of control charts, such as Exponentially Weighted Moving Average (EWMA) charts, Dynamic EWMA charts, Cumulative Sum (CUSUM) charts, Q-charts came into prominence as they are effective for detecting small parameter changes. In addition, they also state that among these different types of charts, EWMA and CUSUM charts are the most effective for detecting small-sustained shifts.
the most important aspect to be considered. Also, he concluded that the ability of a control chart to provide clues and detect the special causes of variations in a process plays a significant role for its selection and the extent to which a control chart is compatible with corresponding applications has to be considered while selecting control charts. Lucas (1982) declared that beneficial effects can be obtained by adding Shewhart limits to a basic
CUSUM, thus creating a new combination of Shewhart-CUSUM scheme.
However, the use of this combined Shewhart–CUSUM scheme was limited to clinical studies and other non-manufacturing applications. Lucas and Saccucci (1990) stated that it was possible to design a Shewhart–EWMA scheme similar to the Shewhart-CUSUM scheme. However, there was not enough literature available to aid in the design of this new scheme. The effect of pictorial representation of different quality control schemes namely Shewhart, EWMA and CUSUM control charts on human (operator) performance has been evaluated in a study conducted by D’Souza and Greenstein (1999). However, they found no experimental validations to show a clear advantage for different types of SPC charts with respect to operative performance based on graphical characteristics. Thomas (2000) studied the alternatives to Shewhart charts in his book on statistical methods. He mentions that few researchers considered Shewhart charts to be superior to other types of control
charts/procedures. However, he concludes that CUSUM procedures have better overall properties when compared to Shewhart charts and also are not prone to become ARL biased.
According to a study conducted by Ong et al (2004), Shewhart control charts were perceived to be inferior compared to EWMA and CUSUM charts based on their statistical performance. They noted that although Shewhart control charts have been in use for a very long time, EWMA and CUSUM charts gained prominence very rapidly as they had a
statistical advantage in detecting small mean shifts. Moreover, they found a distinction in the way the data points are pointed and the out-of-control points are interpreted amongst
general guidelines for the design of control charts.
Woodall and William (2000) claimed that the use of the classical control charts is not widespread in the industry as expressed or implied by some practitioners. Instead of
Shewhart control charts, there are other customized control charts suitable for requirements of the industry considered. This theory was re-emphasized by Engin (2004), who stated that although classical Shewhart control charts are heavily used in the textile industry, they are generally used in adapted to suit the needs of the manufacturer, with control limits that are varying around generally accepted as + 2% of nominal value of quality characteristic. Whether classical Shewhart charts or some other special charts are used, the application of the control chart technique in the presentation and interpretation of data increased the effectiveness of quality control in textile manufacturing. He claims that, the superintendents and over-seers closely observed the trends several times a week and interpreted the data by giving the percent of “Good,” “Warning Region,” and “Out of Control” points so that the over-all quality records of a department could be compared from week to week.
Yeh et al. (2004) proposed a new control chart model to effectively monitor small changes of variability of multivariate normal processes. For designing the new control chart, they first studied the evolution of multivariate control charts to monitor and analyze the variability of multivariate normal process. In this study, it was found that the first
multivariate control chart originated from the works of Hotelling in 1947. During the 80’s there were only a few researchers who working on Shewhart control chart models detecting various changes in the variance-covariance matrix of the related distribution while others worked in areas related to development of control charts that can monitor small shifts in the process mean (Yeh et al, 2004). It was observed that most of the research on development of Multivariate Cumulative SUM (CUSUM) control charts occurred during the late 80’s and early 90’s (Woodall and Ncube, 1985; Crosier, 1988; Pignatiello and Runger, 1990;
on proposing new and modified CUSUM/EWMA procedures to detect very small/minor shifts in the process mean (Qiu and Hawkins, 2001).
Literature suggests that there have been many studies carried out to compare Shewhart charts with EWMA and CUSUM charts in the past decade. However, it was
observed that most of these comparisons considered only those cases in which a special cause produced sustained shifts in a particular process parameter and ignored sample size ‘n’ and sampling interval ‘d’ values (Reynolds Jr. and Stoumbos, 2004). On the other hand, there is literature available citing works of different researchers who compared control charts based on values of n and d. For example, Hawkins (1992) recommended using n = 1 as a choice of n in a CUSUM chart that is used to detect sustained shifts in µ. Almost after a decade, researcher Montgomery (2001) conducted a similar study and gave recommendations on using n = 1 as a choice of n in the CUSUM charts. Although both these research works had similarities in terms of work conducted and results claimed, both these works did not provide any numerical results to validate their hypothesis. n =1 is the most preferred choice for a CUSUM chart (Hawkins and Olwell, 1998). However a value of n > 1 being a more efficient choice has been stated by Prabhu et al. (1997). In case of CUSUM charts, Stoumbus and Reynolds (1996) suggested various values of n and d that can detect sustained shifts in µ. Reynolds (2004a) recommended using n =1 for both non-normal as well as normal process data after studying choice of n in various CUSUM charts used to detect sustained shifts in µ.
Feng and Kapur (2009) discussed in detail why Shewhart control charts are not effective at all times especially in textile manufacturing. He explained this through an
process parameter defects. He also suggests, as other researchers pointed out earlier, that Shewhart control charts is a memory less process as it ignores the previous information given by a sequence of points and hence, it is insensitive to small shifts in a process.
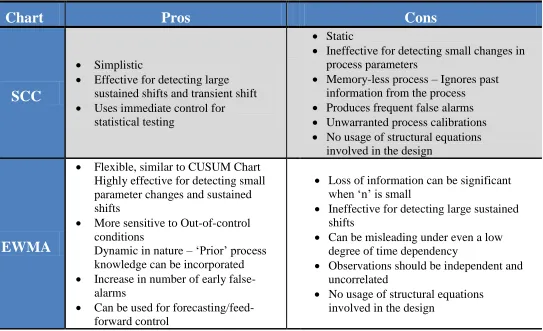
Table 1. Pros and Cons of the most frequently used Control Chart Methods in Textile Manufacturing
Chart
Pros
Cons
SCC
Simplistic
Effective for detecting large sustained shifts and transient shift Uses immediate control for
statistical testing
Static
Ineffective for detecting small changes in process parameters
Memory-less process – Ignores past information from the process Produces frequent false alarms Unwarranted process calibrations No usage of structural equations
involved in the design
EWMA
Flexible, similar to CUSUM Chart Highly effective for detecting small parameter changes and sustained shifts
More sensitive to Out-of-control conditions
Dynamic in nature – ‘Prior’ process knowledge can be incorporated Increase in number of early
false-alarms
Can be used for forecasting/feed-forward control
Loss of information can be significant when ‘n’ is small
Ineffective for detecting large sustained shifts
Can be misleading under even a low degree of time dependency
Observations should be independent and uncorrelated
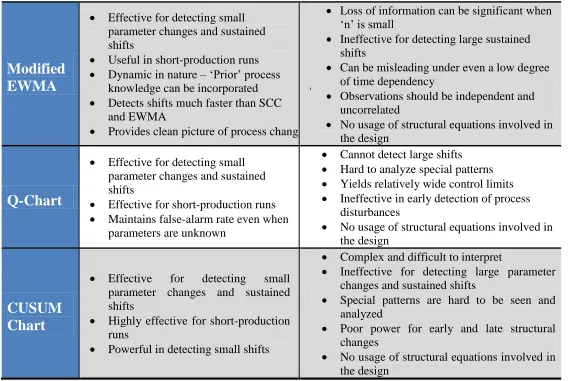
Table 1. Pros and Cons of the most frequently used Control Chart Methods in Textile Manufacturing (cont’d).
Modified
EWMA
Effective for detecting small parameter changes and sustained shifts
Useful in short-production runs Dynamic in nature – ‘Prior’ process
knowledge can be incorporated Detects shifts much faster than SCC
and EWMA
Provides clean picture of process change
Loss of information can be significant when ‘n’ is small
Ineffective for detecting large sustained shifts
Can be misleading under even a low degree of time dependency
Observations should be independent and uncorrelated
No usage of structural equations involved in the design
Q-Chart
Effective for detecting small parameter changes and sustained shifts
Effective for short-production runs Maintains false-alarm rate even when
parameters are unknown
Cannot detect large shifts Hard to analyze special patterns Yields relatively wide control limits Ineffective in early detection of process
disturbances
No usage of structural equations involved in the design
CUSUM
Chart
Effective for detecting small parameter changes and sustained shifts
Highly effective for short-production runs
Powerful in detecting small shifts
Complex and difficult to interpret
Ineffective for detecting large parameter changes and sustained shifts
Special patterns are hard to be seen and analyzed
Poor power for early and late structural changes
2.5 Investigation of Quality/ Process control parameters that influence textile
processing sequences
Several studies have been published in the literature that discuss the influence of quality/process control parameters on processing performance and production capabilities of textile dry and wet textile-processing sequences. However, most of these studies are still far from providing a comprehensive list of all or atleast most significant parameters that have a major influence on dry and wet textile-processing sequences. One of main reasons for this inadequacy is that these studies are generally carried out using empirical models or
regression analysis to describe the influence of a particular quality/process parameter or in some cases, a select few parameters that influence processing. An abundant amount of studies can be found in the literature that demonstrates the relationship between cost of raw material and overall processing costs and/or profits. However, many other parameters such as properties of raw material, level of technology, machinery and skill of machine operators etc. are not covered in the literature extensively as they are considered to be not so significant by many researchers as it is difficult to create an empirical model describing the relationship between these parameters and over all profits.
Quality attributes that define raw material properties significantly influence the overall production costs or profits of entire textile chain as they can lead to yarn
imperfections (neps, thick and thin places), an important yarn parameter that affects both yarn and fabric processing. A yarn with more imperfections will exhibit poor appearance grade, lower strength and poor performance in weaving and is likely to produce fabric with low quality. This leads to inconsistent dye uptake in fabric causing defects such as visible streaks in the final garment (Hebert et al 1986, 1988; Ochola. J et al, 2012). Hence, it is of paramount importance to investigate extensively quality and process parameters such as raw material, level of technology, machinery, skill of machine operators, mass variations,
2.5.1 Quality/ Process control parameters that influence Spinning process
The simplest definition of spinning according to Marsh (1953) is the joining of short fibers by drawing them from a loose fibrous mass and twisting them together. Although the yarn production process differs depending on the spinning system, it primarily involves opening, cleaning, blending, carding, drawing, spinning and winding. Various fiber parameters are of high significance in processing and end use, and hence fibers with the required properties should be selected and processing should accommodate these parameters adequately. For example, fiber diameter is important in dyeing behavior; fiber length
determines the choice and adjustment of machinery and is important in producing uniform; strong yarns with less ends down in spinning from low staple length fibers; fiber immaturity in cotton leads to inferior spinning performance and lower-quality yarns and fabrics; color is important, since the presence of discoloration has a detrimental effect on dyeing etc.
Especially at the mixing stage the fiber properties play a key role during processing. At mixing the basic requirement for implementing a reliable fiber selection technique is the quality of the parameters describing a cotton bale and this quality is determined by several factors, including the measuring technique used, data produced and reliability and
reproducibility of the data. The parameters to be determined at the mixing stage are: fiber fineness (micronaire value), fiber length, length uniformity, strength, break elongation, color and trash. Variability in fiber length, short fiber content, trash particle distribution and nep distribution are also determined. Population variability is a critical factor in determining blend uniformity.
Based on the factors involved, structural equations between the input and output
parameters were identified. Well-known properties of fiber clusters are considered and their changes are traced between any two successive stages through the established relationships.
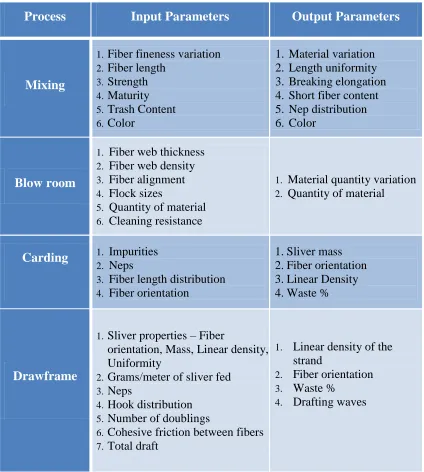
Table 2: Key fiber parameters that influence the spinning processes.
Process Input Parameters Output Parameters
Mixing
1. Fiber fineness variation
2. Fiber length
3. Strength
4. Maturity
5. Trash Content
6. Color
1. Material variation 2. Length uniformity 3. Breaking elongation 4. Short fiber content 5. Nep distribution 6. Color
Blow room
1. Fiber web thickness
2. Fiber web density
3. Fiber alignment
4. Flock sizes
5. Quantity of material
6. Cleaning resistance
1. Material quantity variation
2. Quantity of material
Carding 1. Impurities
2. Neps
3. Fiber length distribution
4. Fiber orientation
1. Sliver mass 2. Fiber orientation 3. Linear Density 4. Waste %
Drawframe
1. Sliver properties – Fiber
orientation, Mass, Linear density, Uniformity
2. Grams/meter of sliver fed
3. Neps
4. Hook distribution
5. Number of doublings
6. Cohesive friction between fibers 7. Total draft
1. Linear density of the strand
2. Fiber orientation
3. Waste %
Table 2: Key fiber parameters that influence the spinning processes (cont’d).
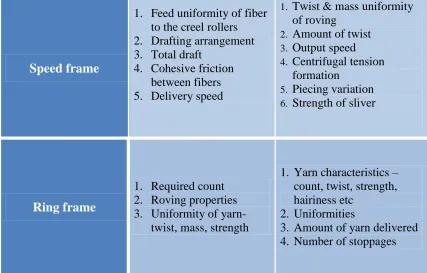
Speed frame
1. Feed uniformity of fiber to the creel rollers 2. Drafting arrangement 3. Total draft
4. Cohesive friction between fibers 5. Delivery speed
1. Twist & mass uniformity of roving
2. Amount of twist
3. Output speed
4. Centrifugal tension formation
5. Piecing variation
6. Strength of sliver
Ring frame
1. Required count 2. Roving properties 3. Uniformity of yarn-
twist, mass, strength
1. Yarn characteristics – count, twist, strength, hairiness etc
2. Uniformities
3. Amount of yarn delivered 4. Number of stoppages
2.5.2 Quality/ Process control parameters that influence Dyeing process
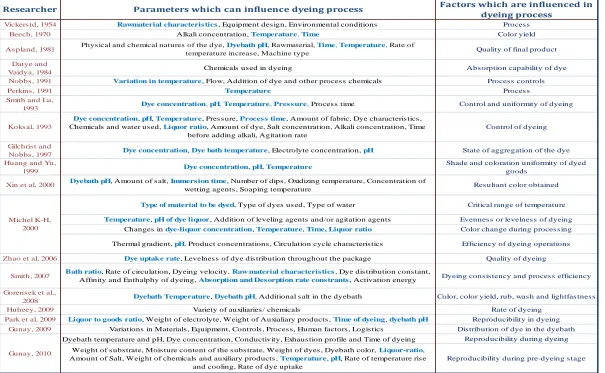
Dyeing is the last stage in the manufacturing of yarns and fabrics, which plays an important role on the final appearance of goods. Process control is highly essential in any continuous processing and more-so in a process as complex and dynamic as dyeing, where several factors could possibly affect the uniform distribution of a shade within a dyed yarn/fabric. Factors such as raw material characteristics, equipment design and environmental conditions influence the process (Vickers, 1954). Also, variations in
materials, equipment, controls, process, human factors, and logistics affect the distribution of dye in the dyebath resulting in a non-uniform yarn/fabric.
Consider the classic case of mass variations in a yarn sample that needs to be dyed. These variations in mass create nonrandom periodic irregularities causing visible streaks on the woven fabric appearance. Limit of each step in the process is reflected in the results of final dyeing and any failure to control the dyeing operation may be disastrous for dyeing.
Therefore, it is critical to monitor and control the dyeing process by identifying and
evaluating the quality and process control parameters that influence dyeing as objectively as possible to achieve uniform and optimum dyeing (Gunay, 2009).
Dyeing process parameters such as temperature, pH, rate of temperature rise and cooling, rate of uptake, dwell time and liquor ratio have been widely known, documented and monitored for many years. Casselman (1980) discussed about the influence of amount of water used, amount of chlorine added to treat water on the pH of dye bath in the dyeing process. Aspland (1981) suggests that the three major variables involved in the complex dyeing process are the physical and chemical natures of the dye, the dyebath (including pH), and the textile material. In addition to these, he remarked that the quality of the final product is also affected by factors such as dyeing time, temperature, rate of temperature increase, and machine type. The chemicals used in the dyeing process are mostly complex organic compounds, which are capable of influencing the absorption capability of a dye. Also, hardness of water and temperature of water used in dye bath have an influence on the pH of dye bath (Datye and Vaidya, 1984).
Nobbs (1991) states that pre-defined variation of temperature, flow, addition of dye and other process chemicals are the essential process controls in a conventional dyeing process. As per Perkins (1991), temperature is the most influential parameter in the dyeing process. He discussed how cotton, rayon, and nylon dye well at temperatures 100°C or lower, while polyester and several other synthetic fibers dye more easily at temperatures higher than 100°C. Structure of the dye used and particle size of the dye can also considered as
Koksal et al. (1993) suggest that the controllable factors for dyeing control include dye concentration, pH, temperature, pressure, process time, amount of fabric, characteristics of dyes, chemical and water. They used the case study approach to propose a method to identify the optimal batch dyeing process parameters and stated liquor ratio, amount of dye, salt concentration, alkali concentration, dyeing temperature, time before adding alkali and agitation rate as the factors that have the most influence on dyeing process and which are controlled by the design engineer. Smith and Lu (1993) discussed about the influence of controllable factors such as dye concentration, pH, temperature, pressure and process time on the control and uniformity of dyeing. Further, they listed the typical properties that were being monitored/ controlled by most control systems listed below in Table 3.
Table 3. Typical properties monitored/ controlled by most control systems
Material Machine
Weight Pump speed
Moisture content Width
Density (cloth/package) Number of actions
Pre-shrinkage Volume of bath
Twist (fabric) Temperature
Liquor ratio Humidity
Tension Flow direction
pH Cycle time
Gilchrist and Nobbs (1997) devised a new method of dyebath analysis in which they studied the factors that affect the measured absorbance of dye. In this study, they concluded that dye concentration, dye bath temperature, electrolyte concentration and pH have a significant influence on state of aggregation of the dye. However, the factors dye concentration, pH, and temperature have the highest effect on the shade and coloration uniformity of dyed goods (Huang & Yu, 1999). Xin et al., (2000) investigated the influence of a number of parameters such as dyebath pH, amount of salt, immersion time, number of dips, oxidizing temperature, concentration of wetting agents, and soaping temperature on the color variation in the dyeing of denim yarn with indigo. They concluded that each of these parameters had varying influence on the resultant color obtained on the samples dyed.
Michel K-H (2000) stated that heat is the catalyst that could hasten the dyeing process. Factors such as type of material to be dyed, type of dyes used and type of water (depending on location of plant) plays a key role in deciding this critical range of
temperature. Temperature, pH of dye liquor, addition of leveling agents and/or agitation agents influences evenness or levelness of dyeing. Also, changes in dye-liquor
concentration, temperature, time and liquor ratio significantly impact the color change during processing. Moreover, process parameters such as thermal gradient, pH product concentrations, and characteristics of the circulation cycles of baths in the presence of builders influence the efficiency of dyeing operations. According to him, when heat is supplied for certain period of time fibers swell allowing better dye penetration and thus the rate of transfer of dye molecules to the substrate is improved. He experimented with effect of varying temperatures on dye-uptake by fibers and concluded that uptake of dyes by textile fibers occurs at temperature called as critical range of temperature.