White Paper
Implementation & Capacity Planning Specification
Release 7.1 October 2014
Yellowfin, and the Yellowfin logo are trademarks or registered trademarks of Yellowfin International Pty Ltd. All other names are trademarks or registered trademarks of their respective companies.
While every attempt has been made to ensure that the information in this document is accurate and complete, some typographical errors or technical inaccuracies may exist. Yellowfin does not accept responsibility for any kind of loss resulting from the use of information contained in this document.
The information contained in this document is subject to change without notice. This text contains proprietary information, which is protected by copyright. All rights are reserved. No part of this document may be photocopied, reproduced, stored in a retrieval system, transmitted in any form or by any means, or translated into another language without the prior written consent of Yellowfin International Pty Ltd.
The incorporation of the product attributes discussed in these materials into any release or upgrade of any Yellowfin software product – as well as the timing of any such release or upgrade – is at the sole discretion of Yellowfin. This document version published April 2012 Copyright © 2012 Yellowfin International Pty Ltd.
Copyright Yellowfin International Pty Ltd 2014 www.yellowfin.bi
Table of Contents
Yellowfin Server Requirements ... 3
Application Server Requirements ... 3
Database Server Requirements ... 4
Client Requirements ... 5
Recommended Application Server Requirements ... 5
Estimating Capacity Requirements... 6
Estimating the Number of Users ... 8
Understanding Report Characteristics ... 9
Report Size ... 9
Analytical Complexity... 9
Report Layout ... 9
Incorporating the Effects of Report Interactions ... 10
Report Browsing and Creation ... 10
Batch Reporting and Delivery ... 10
Report History ... 10
Administering and Monitoring BI Implementations ... 11
Metadata ... 11
Caching ... 11
Monitoring ... 11
Server Configuration ... 12
Basic Single Server Installation ... 12
Medium Separate Application and Db Server Installation ... 12
Advanced Multi Server Installation ... 13
Server Placement Considerations ... 14
Application & Yellowfin Database ... 14
Application Server and Data Sources ... 14
Application Server and Web Server ... 14
Web Servers relative to Web users ... 14
Scalability Testing ... 15
What is Scalability ... 15
Why is Scalability Important ... 15
Testing Procedures & Results ... 15
Goals ... 15
Approach ... 16
Software ... 16
Hardware ... 17
Users ... 17
Vanilla and Tuned Difference...
Error! Bookmark not defined.
Results ... 18
Test Conclusions ... 18
Yellowfin Server Usage – Real World Examples ... 20
Yellowfin Reference Installation 1 ... 20
Yellowfin Reference Installation 2 ... 22
Yellowfin Reference Installation 3 ... 23
Yellowfin Reference Installation 4 ... 25
Copyright Yellowfin International Pty Ltd 2014 www.yellowfin.bi
Yellowfin Server Requirements
From a hardware perspective, it is entirely possible to deploy Yellowfin on a single machine. Though this may be suitable for developing laptop demos or small departmental deployments, large-scale deployments require multiple machines for scalability, security, backup and redundancy.
There are several possible deployment solutions depending on your reporting requirements. These solutions are discussed later in this document:
• Simple deployment, or everything on one machine
• Multi-node deployment, or different servers on different machines
Yellowfin can be installed in a number of configurations - a database server and an
application server are the core requirements. These may be on separate computers, or they may be on the same physical computer. Using a single computer will reduce hardware costs, whereas using separate computers will distribute the server load across the two computers, thus achieving increased performance. The database server needs only to be accessed by the application server and for increased security, it can be placed in a secure DMZ or removed from any other networks. However, the application server needs to be accessible from all client computers.
Application Server Requirements
Requirement Recommended Minimum Specification
Processor 2 x Dual Core 3GHz or faster
RAM Min 4 Gb
Hard Disk 1 Gb Free Space
Operating System Windows 2000 or later
Linux (Red Hat Enterprise Linux, SUSE Linux Enterprise Server, or Ubuntu Server LTS recommended)
Solaris 7 or later Mac OS X
Java JRE 1.6 Minimum
Web Application Server Yellowfin comes with Apache Tomcat, which is a standalone, platform independent application server. Yellowfin can also be used in other application servers such as an existing installation of Tomcat, WebSphere, WebLogic, Oracle
Copyright Yellowfin International Pty Ltd 2014 www.yellowfin.bi
Web Server The default installation uses an embedded web server. However, Yellowfin can optionally be integrated with other web server software such as Apache, Websphere and Microsoft IIS. The web server does not necessarily need to run on the same physical computer as the application server
Database Server Requirements
Requirement Recommended Minimum Specification
Processor 2 x Dual Core 3Ghz or faster
RAM Min 4GB
Hard Disk 10Gb, preferably with RAID disk mirroring
Database Yellowfin can connect to and report from any database that has a JDBC driver and that supports SQL-92 compliant SQL.
Yellowfin requires one of the following databases to use as an application configuration database:
DB2 Universal Database 8.1 or later Oracle Database 9i, 10g, 11g PostgreSQL 8+
Progress 9.1 SQL Server 2000+ Sybase ASE, ASA, IQ Ingres
MySQL 5 Cache’ DB
Copyright Yellowfin International Pty Ltd 2014 www.yellowfin.bi
Client Requirements
Requirement Recommended Minimum Specification
Web Browser Supported browsers include:
Internet Explorer 8+ Firefox 2+
Opera 8+ Safari 2+
PDF Reader A PDF reader such as Adobe Acrobat Reader for viewing PDF files. This reader is only required if users export Yellowfin reports to PDF.
Recommended Application Server Requirements
The following information is given based on benchmarks using Yellowfin in a basic scenario with moderate usage rates. Yellowfin recommends that you conduct your own benchmarking in an initial phase of your deployment to better understand hardware requirements.
Recommended minimum requirements based on number of concurrent users:
Number of users CPU Requirements RAM Requirements
Developer / Demonstration Single 2 GHz Xeon or equivalent 2 Gb
25 or Less Concurrent Users 2 x 2 GHz Xeon or equivalent 4 Gb
50 Concurrent Users 4 x 2 GHz Xeon or equivalent 8 Gb
Copyright Yellowfin International Pty Ltd 2014 www.yellowfin.bi
Estimating Capacity Requirements
A critical step in the planning of your Yellowfin deployment is estimating the capacity
requirements. This task approximates the initial computing resources needed to meet delivery objectives and service level agreements. Capacity estimation can be achieved through either an informal or a structured approach and should include consideration of the key activities undertaken by users:
The main system requirements that should be estimated are:
1. Processing power
Processing power is generally the most critical resource as it is the most expensive. This involves determining the number of physical computer servers, the speed, bit size, and number of CPUs.
2. System memory
The memory requirements of the planned implementation can influence the choice of the operating system and, in turn, the processing power decision. For example, any application process running on a 32-bit Windows platform can use only ~3 GB of system memory. In contrast, 64-bit Windows, UNIX, and Linux operating systems support a theoretical 18 exabyte address space for application use.
3. Hard disk space
In terms of computing resources, hard disk resources represent the cheapest of the three types of system resources and are also the least critical.
Capacity estimation should be an ongoing exercise to ensure that the system infrastructure continues to support and grow with users’ needs. Managing user requests, retrieving data from data sources, adding analytical functionality, formatting and distributing report results, and performing report interactions all use computing resources. Increases in the number of users, the number of reports, the volume of data, and the amount of analytical reporting handled by the Yellowfin servers also increase the amount of computing resources needed to maintain similar levels of performance and report throughput. Capacity estimation gives a reasonable idea of the amount of computing resources needed to power a Yellowfin implementation.
Copyright Yellowfin International Pty Ltd 2014 www.yellowfin.bi
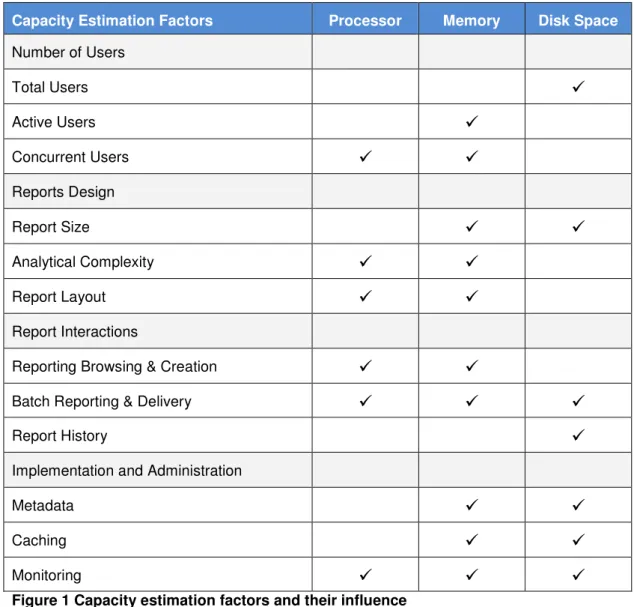
The most important factors in capacity planning include:
• Number of users
• Design of reports
• Interactivity of reports
• Monitoring and administration
Their impact on the three main system requirements can be summarized as follows:
Capacity Estimation Factors Processor Memory Disk Space
Number of Users
Total Users
Active Users
Concurrent Users
Reports Design
Report Size
Analytical Complexity
Report Layout
Report Interactions
Reporting Browsing & Creation
Batch Reporting & Delivery
Report History
Implementation and Administration
Metadata
Caching
Monitoring
Copyright Yellowfin International Pty Ltd 2014 www.yellowfin.bi
Estimating the Number of Users
The total number of users of an application is the easiest factor to estimate. Since user information, audit trails and unique report instance information is stored in the Yellowfin repository, increasing the number of users increases the hard disk requirements. Depending on how they use the application, users also have a secondary impact on the CPU and memory requirements.
At any given time, only 10-20% of all users concurrently use a typical reporting application. The Yellowfin Application Server allocates memory and address space for each active user from a shared pool of system resources. The larger the number of concurrent user sessions, the more memory resources consumed by the Application Server.
Typically, only 30-50% of the users logged into Yellowfin run jobs simultaneously. Thus, Yellowfin has a user activity ratio of 3-10% of the total named users. Active users directly influence the processing and memory resources of the computer servers.
As a rule of thumb, allow a minimum 4 Gb of memory and 2 x 2 GHz processor per 25 concurrent users on the application server.
As an example, if you have 500 named users you could expect 50 active users at any given time (with significantly more for peak usage). This would imply the need for a minimum of a 4 processor server with 8 Gb of memory. Of course, these are only guidelines and resource consumption will vary depending upon several factors – this includes the size and complexity of the database and reports being run, your online vs. background workload characteristics, etc.
Each installation is different. It is highly recommended that performance tests are performed with a workload approximating your desired end-state to ensure that the Yellowfin Software works properly, and meets your performance requirements in a production environment.
Copyright Yellowfin International Pty Ltd 2014 www.yellowfin.bi
Understanding Report Characteristics
The number of reports deployed is an important factor in determining capacity requirements. However, the number of reports alone does not provide an accurate estimation; the size, analytical complexity, and report layouts must also be considered.
Report Size
Recently run reports are stored in cache using memory resources. The amount of memory used depends on the amount of data and data types used, and this can be estimated relatively accurately. In addition, reports where history is kept (i.e. a XML copy of the result set is stored in the Yellowfin repository each time the report is refreshed) will also utilize hard disk resources.
Analytical Complexity
Yellowfin adds analytical capabilities to reports by cross-tabbing data, adding calculations and subtotals, drilling, sorting, pivoting, and managing filter prompts. Reports that require a large amount of analytical processing require more processing power and memory, but the exact amount can be difficult to quantify.
Report Layout
Yellowfin formats reports in many ways such as cross-tab grids, graphs, HTML, PDF, and CSV. Applying formats to report results uses both processing power and memory. The more formatting properties, controls, and report objects contained on a report, the more processing and memory resources are consumed.
Copyright Yellowfin International Pty Ltd 2014 www.yellowfin.bi
Incorporating the Effects of Report Interactions
Users will have varying levels of interaction with Yellowfin from receiving reports via email to complex reporting functions. The effect of these interactions can be categorised as follows:
Report Browsing and Creation
Yellowfin provides a very rich reporting, analysis, and monitoring environment that is centrally maintained. Yellowfin contains a broad range of functionality; from basic activities such as accessing the system, finding, running, and printing reports, to powerful analytical features such as drilling, sorting, pivoting, adding calculations, and exporting. Sophisticated report development capabilities are also available in this platform.
The quantity and variety of report interactions consume both processing power and memory on all tiers on the Web infrastructure – Web Servers, Application Servers, Yellowfin
Repository / Database Server, the data sources, and the Web browser. Capacity should be estimated for all of the tiers.
Batch Reporting and Delivery
Many organisations process commonly used reports and scheduled reports in batches. Ideally, this occurs during off-peak hours and periods of low system usage. The key constraints that govern system resources for batch reporting are the quantity of reports executed and delivered, and the size of the batch window in which the processing occurs. Shorter batch windows and more reports require more processing and memory resources on the Application Server to complete report processing and delivery in the allotted time.
Report History
Report result sets can be stored in the Yellowfin repository for reuse by multiple users – this provides the ability to compare multiple versions of the report. This also reduces the load on the data sources but will increase the hard disk requirements of your Yellowfin installation.
Cleanup processes and deletion policies should be set by your administrators to reduce the total resources needed.
Copyright Yellowfin International Pty Ltd 2014 www.yellowfin.bi
Administering and Monitoring BI Implementations
Yellowfin provides rich application metadata with numerous monitoring and performance enhancing features to ensure successful implementations. Increasing functional richness and continued performance monitoring take up system resources that must be included during capacity estimation.
Metadata
The size of the central Yellowfin repository has an influence on the memory consumption of the Application Server. Upon startup, the Application Server loads metadata configuration information into memory.
Caching
Yellowfin provides comprehensive caching capability to improve throughput, optimize query performance, and reduce end user response times. Intelligence Server caches are stored in memory.
Monitoring
Yellowfin logs statistics and user activity in the Yellowfin repository / Database Server. Storing the usage and performance statistics consumes a negligible amount of processor and
memory resources, but additional hard disk space is required to store the record.
In addition, log files are also created by Yellowfin for errors and server performance. A capacity estimation exercise must account for performance monitoring and usage statistics logging. It is important to note that these monitoring resources should be used to improve future capacity estimation and tuning activities.
Copyright Yellowfin International Pty Ltd 2014 www.yellowfin.bi
Server Configuration
Yellowfin can be installed in different configurations based on your specific needs and projected users volumes. Listed below are three possible configurations and the scenarios in which you may choose to use them. These three options are:
1. Single Server Installation
2. Separated Application and Database Server
3. Multi Server Installation
Basic Single Server Installation
This is an ideal implementation for a small end-user base (up to 10 concurrent users) against small to medium databases. It minimises hardware cost and installation effort to allow a rapid implementation of Yellowfin.
Medium Separate Application and Db Server Installation
Separating the Yellowfin configuration database and the Yellowfin application server will provide a more scalable option to support larger user numbers. It also provides better
capability to tune the reporting server and database management independently. It should be considered for medium to larger installations (i.e upwards of 25 concurrent users or for complex and large reporting requirements).
Copyright Yellowfin International Pty Ltd 2014 www.yellowfin.bi
Advanced Multi Server Installation
For installations with 100 or more concurrent users, high availability or high security
requirements, Yellowfin provides clustering, multi-tier and multi-server configuration options to address these concerns.
The web server component can be separated from the application server to provide greater scalability and to allow failover or distribution of load across the application servers. Load balancing can be achieved in a number of ways - including having dedicated servers for scheduled and background reports to load balancing web requests over a cluster of online servers. This configuration also enables a greater degree of security by placing the web servers in a highly secure DMZ separate from both the application and the database.
At the database end, the Yellowfin application supports connection to an Oracle RAC grid, enabling load balancing and high-availability failover of both the reporting database servers and the Yellowfin configuration database server.
Copyright Yellowfin International Pty Ltd 2014 www.yellowfin.bi
Server Placement Considerations
The geographic spread of users and the resulting placement of the various Yellowfin servers for optimal performance are of particular interest during deployments. This section discusses key considerations with respect to the placement of the various Yellowfin components and interaction with the end user client.
Application & Yellowfin Database
The frequent interaction between the Application Server and the Database Server (metadata repository) mandate that they have close proximity to each other. A dedicated high speed, high bandwidth network greatly increases performance due to reduced network latency.
Application Server and Data Sources
The same reasons cited for the relative placement of Application Server and the Database Server apply to the placement of the organisational data sources (transactional databases or data warehouse). While the Application Server and data sources can be spread out
geographically, a dedicated high speed, high bandwidth network greatly increases performance.
Application Server and Web Server
While a high bandwidth network is desirable between the Application Server and the Web Servers, many performance-enhancing strategies implemented in the Yellowfin platform such as caching, reduce traffic between the Application Server and Web Server.
Web Servers relative to Web users
In general, the network bandwidth between the Web Server and Web browser is the most unreliable and least controllable by the organisation. For this reason, when users are highly distributed and high bandwidth networks do not exist, it is common to place Web Servers closer to remote users.
Copyright Yellowfin International Pty Ltd 2014 www.yellowfin.bi
Scalability Testing
This section documents scalability testing performed on Yellowfin. Results of this testing process show that Yellowfin can scale to support large user installations.
Test cases were designed to simulate a real world, enterprise-reporting environment in which users conduct a variety of business intelligence reporting activities concurrently.
What is Scalability
Scalability refers to the ability of a system to perform well in the face of increasing user demands. For example, a system with a high degree of scalability will behave predictably when the number of users increases from 100 to 1000 to 10,000 and more. Performance refers to the amount of time it takes to complete a particular task.
Why is Scalability Important
As the number of individuals using a reporting system grows, and the number of queries and reports generated increases, performance can become an issue. Additionally, as users learn how BI reporting helps them make better business decisions, they tend to generate more sophisticated reports and queries that put a heavier burden on the system.
A system’s scalability is thus important when considering existing and projected needs. Also important are the unique reporting requirements of different user communities across departments, divisions, and geographic locations, the range of disparate data sources used for reporting, and the languages in which reports must be provided. Scalability should be a key criterion when determining the hardware and software environment in which to run your BI solution.
Testing Procedures & Results
To judge any system’s scalability, a realistic evaluation of system performance in a carefully defined and controlled test situation is needed as a benchmark, or guideline, to use when configuring server environments. The testing described in this section was designed to develop reliable benchmarks for Yellowfin.
Goals
Copyright Yellowfin International Pty Ltd 2014 www.yellowfin.bi
•
increasingly large number of users performing common tasks such as dashboard navigation, report viewing, report execution, and report scheduling (batch reporting).
• To ensure that the test users were truly concurrent, meaning that they were simultaneously stressing the server.
Approach
The hardware and software components used in the testing were designed to simulate an enterprise-reporting environment in which user activities include logging in, viewing dashboards and reports, and logging off.
An important approach to the testing of the Yellowfin application was to uncover any bottlenecks within the application itself and monitor performance during the process of sending and receiving queries, and rendering the results in the application engine. The tests performed are isolated to the Yellowfin application and does not include potential
environmental impacts such as network latency, database server speed and browser rendering performance.
One of the other aims of testing was to try and replicate real world usage by incorporating reasonably short think times or wait times of 2 seconds. The benefits of using short think times are:
• Test results reflect high usage patterns with user behavior mimicked for active concurrency testing.
• Customers are better able to extrapolate from the results based on the level of concurrency in their reporting environment.
The following test scenarios were employed for the concurrent users:
• Logged into Yellowfin
• Navigated the Yellowfin dashboard
• Loaded 6 unique reports (includes KPIs, advanced charts, drilldowns, drillthroughs, drill anywheres, formatters, org reference code usage)
• Logged out of Yellowfin
Software
Copyright Yellowfin International Pty Ltd 2014 www.yellowfin.bi Software
Tested System Yellowfin v7.1 Operating System Ubuntu 12.04.1 LTS
Web Server Tomcat 7
Database Operating System Ubuntu 12.04.1 LTS
Database MySQL 5.5.29 Load Testing JMeter 2.6
Hardware
Both Yellowfin and the JMeter load testing software were run on:
Hardware
Server Commodity Desktop Server
Processor(s) Intel Core i7 920 @ 2.67 (4 Core hyperthreading equiv. 8 Core CPU)
RAM 24 Gb
Users
To accurately judge the number of users that can be supported in a real world scenario based on performance in a test environment, you must distinguish between named, concurrent, and active users.
Named users make up the total population of individuals who can be identified by and potentially use the system. They represent the total user community, and can be active or concurrent at any time. In a real-life BI environment, this is the total number of individuals authorized to use the system. It is the number of most interest when planning a BI
implementation, because it tells you how many users you can expect to support in a given environment with the response times reported in a test environment.
Concurrent users are the number of user sessions logged on to the system at a given time. They include users who are simply viewing the results returned from a query. Although these subset of concurrent users are logged on to the system, they are not necessarily sending requests. Based on Yellowfin’s experience, a good assumption is that 20 percent of named users are concurrent at any given time. Therefore, 200 concurrent users represent an environment with 1,000 named users. Note: this ratio may vary significantly for your BI application.
Copyright Yellowfin International Pty Ltd 2014 www.yellowfin.bi
users who are sending a request or waiting for a response. They are the only users actually stressing the system at any given time. A good assumption is that 50 percent of concurrent users are active users. Therefore as an example, 100 active users represent an environment with 200 concurrent users and 1,000 named users. Therefore the ratio of active user to named user is 10:1. Note: this ratio may vary significantly for your BI application.
Overview
The Yellowfin load testing scenarios were carried out on the demonstration SkiTeam datamart. Testing was performed on a fresh installation of Yellowfin v7.1 with appropriate values for the Yellowfin connection pool, application server max threads, and source
database connections management to match the increased concurrency. This operation was also performed on a single instance of Tomcat – as seen below, clustering options should be implemented as concurrency reaches a certain threshold to ensure low response times.
Results
Report Interaction
Active users 100 200 300 400 500 1000
Average Viewing Response Time (seconds)
1.1 2 2.8 4.3 5.5 10.8
Named Users* 1000 2000 3000 4000 5000 10000
*Estimated named users based on the number of active users on a 10:1 ratio
Test Conclusions
The Yellowfin test results presented in this section are a result of the modern, open, and scalable architecture that was built to provide true enterprise level reporting for global organizations.
The test results show that:
1. Yellowfin demonstrated, that when deployed appropriately, a level of scalability that can meet the needs of extranet reporting deployments that span thousands of users.
2. Yellowfin supports large reporting deployments that span multiple departments in Enterprise deployments.
3. Yellowfin provides high throughput for scheduled reporting (batch reporting) environments.
Copyright Yellowfin International Pty Ltd 2014 www.yellowfin.bi
It is important to note that in a real-world environment, other factors such as the network and database layers could be potential key performance inhibitors. It is recommended to perform clustering on the application and database server layers for high concurrency rates, and is the best approach with high availability and failover requirements in mind.
In conclusion, the results of the Yellowfin benchmark tests indicate that when deployed appropriately, Yellowfin is a high performance solution that can be the basis for enterprise reporting initiatives.
Copyright Yellowfin International Pty Ltd 2014 www.yellowfin.bi
Yellowfin Server Usage – Real World Examples
It can be difficult determining the exact server specifications for a Yellowfin instance as required resources differ greatly with the deployment model, number of concurrent users, report size and complexity, and the use of different reporting components like GIS functionality and Analytic Functions. This document will assist in determining the server specifications for a new instance of Yellowfin, using real installations as a guide.
Yellowfin Reference Installation 1
This Yellowfin deployment provides analytical and historical reporting for a e-commerce company specializing in the property market - the client uses this installation to report off their internal data warehouse.
The reporting suite in this installation is used both internally by sales staff and management, and externally by real estate agents. Internally, staff utilise the internal deployment to
investigate sales performance, pricing, location popularity and geographical density, whereas management and executives refer to KPI reports and dashboards to track overall
organisational performance. The external deployment provides estate price, popularity, and distribution for estate agents.
Model: Single Server Installation
Concurrent Users: 50
Environment: 1 application server, 1 database server. Database server contains both the Yellowfin database and the data warehouse.
Yellowfin Application Server
Nodes 1
Application Server Tomcat 5.5
Virtualisation VMware ESX
Host Server ProLiant BL 460c G6
Copyright Yellowfin International Pty Ltd 2014 www.yellowfin.bi
Host RAM 50 GB
Virtualised Host 4V CPUs
Virtualised RAM 16 GB
Operating System Windows Server 2008 R2
Disk SAN
Yellowfin Database Server
Nodes 1
Database Server SQL Server 2008
Virtualisation VMware ESX
Host Server ProLiant BL 460c G6
Host Processor Intel Xeon E5520 @ 2.27Ghz x 8
Host RAM 50 GB
Virtualised Host 8V CPUs
Virtualised RAM 32 GB
Disk SAN
Source Database Server
Database Server SQL Server 2008
Nodes 1
Database Size 17 GB
Copyright Yellowfin International Pty Ltd 2014 www.yellowfin.bi
Yellowfin Reference Installation 2
This Yellowfin deployment provides analytical reporting to a higher education organization - the client uses this installation to report off their internal data warehouse.
The reporting suite in this installation is used internally by staff to track the performance and quality of research output by its constituents. Such results are analysed with the reporting tool and compared against national/world benchmark values. This deployment is also used for monitoring and evaluating funding sources, staffing levels, current research progress, and applied measures.
Model: Multi Server Installation
Concurrent Users: 20
Environment: 2 web servers, 2 applications servers, and a 5 node database server. The database server contains both the Yellowfin database and the data warehouse.
Yellowfin Web Server
Nodes 2
Application Server Apache
Virtualisation VMware ESX
Host Server Dell Blades (2950)
Virtualised RAM 4 GB
Operating System Oracle Linux
Disk LUN
Yellowfin Application Server
Nodes 2
Application Server Tomcat 5.5
Copyright Yellowfin International Pty Ltd 2014 www.yellowfin.bi
Host Server Dell Blades (2950)
Virtualised RAM 4 GB
Operating System Oracle Linux
Disk LUN
Yellowfin Database Server
Nodes 5
Database Server Oracle 11G
Virtualisation Oracle RAC
Host Server Dell
Virtualised RAM 32 GB
Disk LUN
Source Database Server
Database Server Oracle 11G
Nodes 5
Yellowfin Reference Installation 3
This Yellowfin deployment provides analytical and historical reporting for a corporate travel agency; the client uses this installation to report off their third party travel booking
application’s data warehouse.
The reporting suite is available to internal staff, management, and their clients – staff are able to track air/accommodation bookings and ticketing information, executives often refer to daily KPIs and high level performance across the organization, and clients can log in and view their own travel expenditure. A small portion of the reporting suite utilises the geospatial feature to
Copyright Yellowfin International Pty Ltd 2014 www.yellowfin.bi
or terrorist attacks.
Client-facing staff in sales also use the mobile BI feature of Yellowfin extensively.
Model: Single Server Installation
Concurrent Users: 10
Environment: 1 server containing the application server, database server, and data warehouse.
Yellowfin Application Server
Nodes 1
Application Server Tomcat 5.5
Virtualisation VMware ESX
Host Server ProLiant BL 460c G6
Host Processor AMD Opteron 2352 @ 2.10 GHz x 4
Virtualised RAM 4 GB
Operating System Windows Server 2003 R2
Disk SAN
Yellowfin Database Server
Nodes 1
Database Server SQL Server 2008 R2
Virtualisation VMware ESX
Host Server ProLiant BL 460c G6
Host Processor AMD Opteron 2352 @ 2.10 Ghz x 4
Virtualised RAM 4 GB
Copyright Yellowfin International Pty Ltd 2014 www.yellowfin.bi
Source Database Server
Database Server SQL Server 2008 R2
Nodes 1
Database Size 22 GB
Largest Fact Table 2.5 million rows (only 3 years worth of data)
Yellowfin Reference Installation 4
This Yellowfin deployment provides analytical and historical reporting for a road tolling company – the client uses this installation to report off their internal tolling and billing system.
The reporting suite is used internally to track vehicle and tag logistics, check process and data workflows, assist in road tolling crisis management, and maintain financial integrity of their billing system.
This installation also provides financial reporting for internal staff and externally to the Australian Stock Exchange (ASX).
Model: Multi Server Installation
Concurrent Users: 100
Environment: 2 web servers, 2 applications servers, and a 2 node database server. The database server contains both the Yellowfin database and the data warehouse.
Yellowfin Application Server
Nodes 2
Copyright Yellowfin International Pty Ltd 2014 www.yellowfin.bi
Virtualisation AIX LPAR
Host Server IBM P570
Host Processor 16 POWER6 cores
Host RAM 49 GB
Virtualised Host 4V CPUs
Virtualised RAM 40 GB
Operating System Oracle Linux
Disk SAN
Yellowfin Database Server
Nodes 2
Database Server Oracle 10g EE Release 64bit
Virtualisation AIX LPAR
Host Server IBM P570
Host Processor 16 POWER6 cores
Host RAM 49 GB
Virtualised Host 4V CPUs
Virtualised RAM 40 GB
Disk SAN
Source Database Server
Database Server Oracle 10g EE Release 64bit
Nodes 1
Database Size 1.9 TB
Copyright Yellowfin International Pty Ltd 2014 www.yellowfin.bi
Table: 1.2 billion rows
Yellowfin Reference Installation 5
This Yellowfin deployment provides analytical reporting for an e-commerce company in the telecommunications sector – the client uses this installation to report off their internal data warehouse.
The client offers this reporting suite as a client-facing external feature of their portal. Businesses who sign up with this client are able to track appearances, interactions, and visibility of their online and offline advertisements, thus providing ROI reporting on their investment.
Model: Multi Server Installation
Concurrent Users: 6,000
Environment: 4 web servers, 4 applications servers, and a 4 node database server. The database server contains both the Yellowfin database and the data warehouse.
Yellowfin Application Server
Nodes 4
Application Server Tomcat 6
Virtualisation VMware ESX
Virtualised Host 2.3 Ghz x 32
Virtualised RAM 64 GB
Operating System RedHat 5.5
Disk SAN
Yellowfin Database Server
Copyright Yellowfin International Pty Ltd 2014 www.yellowfin.bi
Database Server Oracle 10g EE Release 64bit
Virtualisation VMware ESX
Host Server Sun X4600
Host Processor 2.3 Ghz x 32
Host RAM 64 GB
Virtualised Host None
Virtualised RAM None
Disk SAN
Source Database Server
Database Server Oracle 10g EE Release 64bit
Nodes 1