ISSN: 2147-611X
International Journal of Education
in Mathematics, Science and
Technology (IJEMST)
www.ijemst.com
Pre-service Middle School Mathematics
Teachers’ Understanding of Students’
Knowledge:
Location
of
Decimal
Numbers on a Number Line
Dilek Girit1, Didem Akyuz2 1
Trakya University
2Middle East Technical University
To cite this article:
Girit, D. & Akyuz, D. (2016). Pre-service middle school mathematics teachers’
understanding of students’ knowledge: Location of decimal numbers on a number line.
International Journal of Education in Mathematics, Science and Technology, 4
(2), 84-100.
DOI:10.18404/ijemst.74290
This article may be used for research, teaching, and private study purposes.
Any substantial or systematic reproduction, redistribution, reselling, loan, sub-licensing,
systematic supply, or distribution in any form to anyone is expressly forbidden.
Authors alone are responsible for the contents of their articles. The journal owns the
copyright of the articles.
Volume 4, Number 2, 2016
DOI:10.18404/ijemst.74290
Pre-Service Middle School Mathematics Teachers’ Understanding of
Students’ Knowledge: Location of Decimal Numbers on a Number Line
Dilek Girit, Didem Akyuz
Article Info
Abstract
Article History
Received: 12 May 2015
Studies reveal that students as well as teachers have difficulties in understanding and learning of decimals. The purpose of this study is to investigate students’ as well as pre-service teachers’ solution strategies when solving a question that involves an estimation task for the value of a decimal number on the number line. We also examined the pre-service teachers’ anticipation of students’ misconceptions and difficulties for the given task. To conduct our analysis, we conducted interviews with three 5th and three 6th grade students, and eight pre-service teachers. During the interviews we asked them to solve the question and explain their solution strategies. The findings of the study indicate that students and pre-service approach this problem in different ways. However, both groups have a tendency to think of decimals successively and indicate precise answers rather than specifying a range of possible values. We also observed the pre-service teachers could only partially anticipate the misconceptions and difficulties faced by the students.
Accepted: 29 September 2015
Keywords
Location of decimals Density
Pre-service teachers Middle school
Introduction
Decimals are used in many places in real life since they indicate precise results of measurement. Although students encounter decimals in early grades, studies show that students have difficulty in understanding and learning decimals (Brousseau, Brousseau, & Warfield, 2007; Glasgow, Ragan, Fields, Reys & Wasman, 2000; Stacey, 2005). This difficulty mostly stems from adults’ own difficulties in understanding decimals (Putt, 1995; Stacey, Helme, Steinle, Batoro, Irwin, & Bana, 2001). Actually, when teachers’ and students’ difficulties are compared, it has been seen that many of them are common. Ubuz and Yayan (2010) show that primary teachers and students have difficulties in reading scale, ordering numbers, finding the closest decimal number and doing operations such as addition and subtraction.
Students generally use their knowledge about whole numbers while answering questions about decimals (Moskal & Magone, 2000; Vamvakoussi & Vosniadou, 2004). There are not any whole numbers between successive whole numbers. It has been widely seen that students apply this principle for solving problems about decimals. For example, most of the students think that there are not any decimals between two decimals, such as 0,63 and 0,64 (Fuglestad, 1996). The other misconception is that students count from 0,412 to 0,419 to order the numbers between 0,41 and 0,42 (Hart, 1981). Neumann (1998) investigated 7th grade students’ conceptions of density about fractions. The students were asked to find the number of fractions between 1/3 and 2/3, and between 0,3 and 0,6. Most of the students stated that there were not any fractions between 1/3 and 2/3, and there were not any common fractions between 0,3 and 0,6. Similarly, Veloo’s (2012) study with 7th graders showed that most of the students could not understand the density of decimals. When considered the progress of conceptions of decimal across grade level, Liu, Zong, Ding and Zhang (2014) studied with 4th, 5th and 6th grade students. They concluded that lower graders used whole numbers knowledge for decimals, while higher graders considered the density of decimals. Additionally, studies show that university students do not have conceptualization of density of real numbers (Merenluoto & Pehkonen, 2002). Besides students, pre-service teachers also have misconceptions about decimal numbers (Merenluoto, 2003; Tsao, 2005). Depeape, Torbeyns, Vermeersch, Janssens, Janssen, Kelchtermans, Verschaffel, and Van Dooren (2015) state that pre-service teachers consider there are limited number of rational numbers between two rational numbers, and their conceptualization of density of decimals do not develop well. Similar to students, pre-service teachers use their whole numbers knowledge for density of rational numbers and they answer incorrectly to the questions. They state that 4/5 comes after 3/5 (Merenluoto & Lehtinen, 2002).
The reasons for these misconceptions about the continuity of numbers are related with density property of decimals. The density property is about the existence of infinite decimals between any two decimals. Gaining the idea of density property is important to conceptualize rational numbers later (Widjaja, Stacey & Steinle, 2008). McMullen, Hannula-Sormunen, and Lehtinen (2015) argued that exposing pre-school children with number sequence skills. Several studies suggested different teaching methods to overcome the misconceptions about density property (Merenluoto & Lehtinen, 2002; Vamvakoussi & Vosniadou, 2004; Veloo, 2012).
When teachers cannot conceptualize decimal representation, they do not emphasize students’ misconceptions while teaching (Steinle & Stacey, 2004). This situation can cause to settle students’ misconceptions about decimals permanently. Especially, misconceptions about density of decimals can be more resident than the misconceptions about operations with decimals (Liu et al., 2014). One of the factors that affect students’ learning, understanding and achievement is teacher’s knowledge (Hill, Rowan & Ball, 2005). At that point, content knowledge and knowing students’ thinking are connected with teachers’ pedagogical content knowledge. Especially, knowing students’ misconceptions, difficulties, and understanding is one of the components of teachers’ pedagogical content knowledge and this knowledge has a positive effect on students’ achievement (An, Kulm & Wu, 2004; Blömeke & Delaney, 2012; Fennema, Carpenter, Franke, Levi, Jacobs, & Empson, 1996; Hill, Rowan & Ball, 2005).
Generally, there are many studies that investigate students’ and pre-service teachers’ understanding of density of decimals and fractions (Depeape et al., 2015; Fuglestad, 1996; Hart, 1981; Liu et al., 2014; Merenluoto & Pehkonen, 2002; Merenluoto, 2003; Moskal & Magone, 2000; Tsao, 2005; Vamvakoussi & Vosniadou, 2004; Vamvakoussi& Vosniadou, 2010; Veloo, 2012; Widjaja et al., 2008). However, one of the aims of this study is to examine the density misconception with a different perspective, which investigates pre-service teachers’ understanding of students’ misconceptions about the location of decimals. Also, different from other studies, the prediction of decimal numbers on a number line is utilized in this study. The location of decimals on a number line can provide an opportunity to seek the conceptions of students and pre-service teachers about the density property. In this regard, the number line can be an appropriate representation for the density property to give a sense of continuity (Widjaja et al., 2008).
In this study, we aim to present students’ conception of location of decimals, pre-service teachers’ conceptions of location of decimals and finally pre-service teachers’ anticipation of students’ misconceptions regarding location of decimals. In this context, our research questions are:
1) What are the students’ conceptions of location of decimals on a number line?
2) What are the pre-service teachers’ conceptions of location of decimals on a number line?
Method
In this study, the participants were asked to determine which decimal and fraction might be indicated by the arrow mark on a number line. Their strategies and possible misconceptions for estimating number(s) for this mark are investigated. In this regard, questions were asked them to explain their opinions. Qualitative research is used to examine their solution methods and conceptions (Fraenkel, Wallen, & Hyun, 2012). For this, participants’ solution strategies were regrouped based on the literature (Creswell, 2007).
Case studies are used to answer why and how questions about a phenomenon from the real life (Yin, 2003). Stake (1995) divides case studies into three categories; intrinsic, instrumental, and multiple case studies. Intrinsic case studies focus on an individual or situation that is unique. In instrumental case studies, the researcher investigates something in a situation. In multiple case studies, the researcher selects different cases to explain the situation within different perspectives. To examine different achievement-level students’ and pre-service teachers’ conceptions, multiple case study is used in this research. Different cases were used to compare and contrast them.
Participants
In a qualitative research, researchers generally prefer sampling for their purpose to examine the situations in more detail (Creswell, 2005). For this study, the participants were selected using the purposive sampling method for getting detailed information (Patton, 1990). This study was conducted with eight pre-service middle school mathematics teachers and six 5th and 6th grades students (three students from each grade). The students were selected from a middle socio-economic level school based on the opinions of their mathematics teachers. Their mathematics teacher explained her opinions based on students’ performance in mathematics classes. Additionally, the students’ mathematics grades were another indicator for their selection. The reason for selecting 5th and 6th grade students was that decimals are taught in these levels according to the curriculum (MoNE, 2013). Since the aim was to examine the solutions in detail, these six students’ solutions were used as cases in this study.
The eight volunteered pre-service teachers were selected from a group of university students who were enrolled in the school experience course. These pre-service teachers were in the fourth year of their education. They had completed mathematics courses such as fundamentals of mathematics, calculus, basic algebraic structures, and method courses about mathematics education. They also had experience with teaching decimals and fractions during their teaching in school experience course. According to their CGPAs (Cumulative Graduate Point Average), three of the pre-service teachers were considered as high achieving (3.50-4.00), three of them as middle achieving (3.00-3.50), and two of them as low achieving (2.50-3.00).
Clinical interviews were conducted with the selected participants. Clinical interview is an important data collection method to analyze participants’ mathematical thinking (Goldin, 2000). These interviews also provide an opportunity to researcher to understand the solutions of participants. The students’ names were coded with letters and numbers that indicate their achievement (high: H, medium: M, low: L) and grade (5 and 6) levels resulting in H5, M5, L5, H6, M6, and L6. Teachers were called T1, T2, T3, T4, T5, T6, T7, and T8. Based on their CGPAs, T1, T4, and T7 were high achieving; T2, T5, and T8 were medium achieving, and T3 and T6 were low achieving.
Data Collection
Data were collected with written responses and interviews from students and pre-service teachers. The question below is adapted from the book entitled “Elementary and Middle School Mathematics” (Van de Walle, Karp, & Bay-William, 2013, p. 346). In the question, the participants were asked to estimate which decimal and fraction might be indicated by the arrow mark and to explain their solutions (see Figure 1).
Next, they were asked to write their solution on a paper and thought loudly during the solution of the problem. The researcher recorded their explanations. The interviews lasted about 10 minutes.
Data Analysis
This study was performed as a multiple case study in order to compare and contrast students’ and pre-service teachers’ solutions (Merriam, 1998). For data analysis, the interviews were transcribed. Basic categories were formed based on the literature (Smith, Solomon, & Carey, 2005; Widjaja et al., 2008) and then the data were coded and classified using these categories. If the data didn’t fall into an existing category, we created tentative categories. Next, these categories were compared within themselves to create new categories. As a result, three categories for students’ solutions and four categories for teachers’ solutions were identified. Finally, the pre-service teachers’ understanding of students’ misconceptions and difficulties were examined.
Students’ Solutions
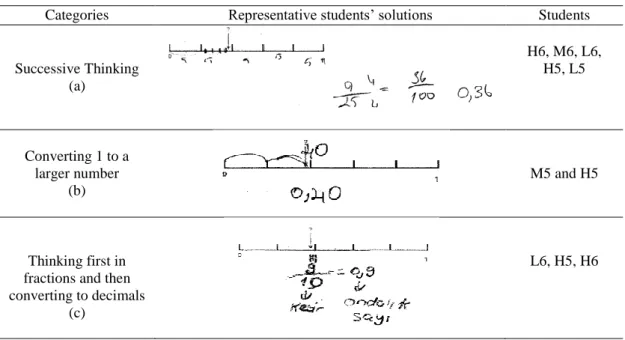
Studies indicate that most of the students consider that there are finite numbers between two decimals or fractions. This stems from their whole number knowledge of comparing two decimals and fractions. For example, when students are asked to state the numbers between 3/8 and 5/8, many students answered that there is only one number that is 4/8. The reason for this misconception is applying the consecutive feature of whole numbers for decimals and fractions. Most of the time, students assume that decimals and fractions continue consecutively as whole numbers. From this viewpoint, the first category in the data analysis is categorized as
successive thinking based on the literature (Fuglestad, 1996; Hart, 1981; Liu et al., 2014; Moskal & Magone, 2000; Vamvakoussi & Vosniadou, 2004; Vamvakoussi & Vosniadou, 2007; Veloo, 2012). In this situation, students mostly ignore the density between the two fractions or decimals. The second category as converting 1 to a larger number is found from the data. According to this category, students have a tendency to convert the number 1, to a larger number such as 25 or 100 that is divisible by 5 (as there were 5 intervals in the number line). The main reason of this conversion is that 5 can divide 100. By doing this, students can write a whole number for each mark, as 20, 40, 60, 80, 100, on the number line. The third category is thinking first in fractions and then converting to decimals (Thompson & Walker, 1996). According to the third category, students first represent the marked location using fractions and then convert this value to decimals. In summary, students’ solutions are grouped under three categories extracted from the data:
1. Successive thinking
2. Converting 1 to a larger number
3. Thinking first in fractions and then converting to decimals
The students’ interviews were transcribed and then the data were compared within themselves to form these categories. After the data were coded regarding to these categories, emerging issues were interpreted based on the related literature. The first and third categories are based on the literature, whereas the second category is found from the data. It is also important to note that some students’ solution strategies belonged to more than one category.
Pre-service Teachers’ Solutions
In general, pre-service teachers’ solutions can be classified into four categories. They used the number line correctly. All of them divided 1 by the number of intervals on the number line and found the fractions that the ticks showed. This strategy is called as dividing 1 by the number of intervalsand identified as the first category. After they determined 1/5 as the first tick and 2/5 as the second tick, three teachers made estimations considering the closeness to the value of the second tick, and gave similar answers. Two of them converted these fractions to decimals and the other pre-service teacher expanded these fractions by multiplying with 20 to get more than one fraction between them. These similar answers formed the second category called as
1. Dividing 1 by the number of intervals
2. Estimation by considering the closeness to 40/100 or 0,4 3. Successive thinking
4. Considering a precise value rather than estimation
The first, second and fourth category were identified from the pre-service teachers’ solutions. The third category, successive thinking, is based on the literature (Merenluoto & Pehkonen, 2002; Merenluoto, 2003; Moskal & Magone, 2000; Tsao, 2005; Widjaja et al., 2008). Similar to the students’ solutions, most of the pre-service teachers’ solution strategies belonged to more than one category. After determining these categories, pre-service teachers’ thinking about students’ possible misconceptions, difficulties, and their suggestions to overcome them were also examined.
Findings
Students’ Solutions
Successive Thinking (Ignoring the density of numbers)
In this category, there are five students (H6, M6, L6, H5, and L5). Three students’ solutions (H6, M6, and L6) were similar at the beginning of the solution. Since the students divided the intervals into 5 units, they assumed that there were a total of 10 units for two intervals. They estimated 9 as one less than 10 for the arrow position. Then, these three students used different ways to represent the fractions and decimals.
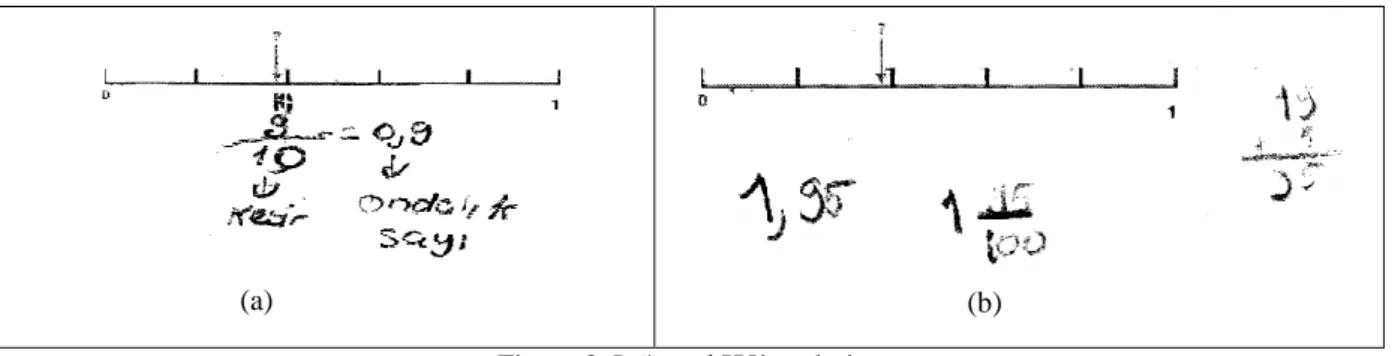
H6 decided to sum up 5 units assuming each part has 5 units and found 25, and she stated 9/25 could be a fraction for the arrow position. Then, she converted this fraction to the hundredth fractions by multiplying both numerator and denominator by 4. She found 0,36 by converting the fraction (36/100) to its decimal version (see Figure 2(a)).
(a)
(b) Figure 2. H6’s and M6’s Solution
M6 solved the problem different than H6. She put ticks to indicate 10 units, and then she counted the ticks as 0.1, 0.2, 0.3, 0.4, 0.5, 0.6, 0.7, 0.8, and 0.9 to reach 0.9. Then, she erased 0.9 and tried to find 100 and then 1000 multiplying 9 with different numbers. She multiplied 9 with 11 first, then 50, 80, 100, 112, 111 correctly. After multiplying 111 and getting 999, she decided to not to getting 10, 100, or 1000. The dialogue between the student and the researcher is given below:
M6: I will equate 9 to 100. Multiply 9 with 11 and 99. It does not equal to 100. Researcher: Can you explain why you multiply?
M6: Because to find the denominator of 9, I must equate 10, 100, 1000. But, it does not get equal to 100, and also to 10.
This student first gave 0,9 as answer and then she wanted to write the denominator as a power of 10. But, here, the student multiplied 9 by different whole numbers assuming that 9 is the denominator. When she was asked about the reasoning of multiplication, she explained that she wanted to find the denominator as power of ten (see Figure 2(b)).
(a) (b) Figure 3. L6's and H5’s solution
Generally the number line was thought as a concrete material and the three students indicated that each interval would be equal to each other and each interval would be five units. Only student H6 considered that the whole as 25 units, and indicated that the number that arrow showed would be 9/25. Other students stated that the number that the arrow indicated would be 9/10. At this point, students thought that the whole is 10. Based on students’ answers, it can be said that only H6 could make a correct estimation by using her reasoning.
One of the fifth graders (H5) considered each interval as 20 units. Although he indicated that the second tick shows 40, he estimated the number the arrow showed as 19 since it was one less than 20. In his explanation he stated that “If the number line had 100 units, the ticks would be 20, 40, 60, 80, and the whole would be 100 units. Since the second tick would be 20, the arrow mark would show number 19, thus the fraction would be 19/20”. Then, to expand the denominator as 100, he thought multiplying both numerator and denominator by 5. But, he wrote 1 95
100 instead of 95/100 while he was converting 19/20 to the fraction where the denominator was
100 (see Figure 3(b)).
Other fifth grader (L5) started to solve the problem with a different strategy. The student stated that a whole number could be written for each tick after 0 and she wrote 1, 2, 3, and 4 for the ticks between 0 and 1. She explained her solution: “First, I think we can write 1, 2, 3, and 4 for the ticks. If we divide the parts up to 2 into four parts, we can say that 1,5 is just before 2. ” (see Figure 4).
Figure 4. L5’s solutions
L5 showed that 1,5 is the number the arrow indicates. When she was asked to represent the number as a fraction, she wrote 2 in the numerator since it is the closest whole number to 1,5. Next, she stated that the denominator would be 4 since it is the biggest number on the given number line. Thus, she indicated that the fraction would be 2/4. It is seen that this student did not use the number line correctly. Although the student recognized this number line would start from zero and finished at one, she wrote 1, 2, 3, and 4 after zero.
When students’ solutions were examined, it was seen that most of the students ignored the density of numbers while they were guessing the number that is marked by the arrow. They thought only one answer for the spot. When estimating the number, mostly they selected the closest number to the second tick that they represented. In other words, for example when they indicated the second tick would be 10, they stated that the number that arrow shows would be 9; when it is 20, the number arrow indicates would be 19; when it is 2, the number the arrow shows would be 1,5.
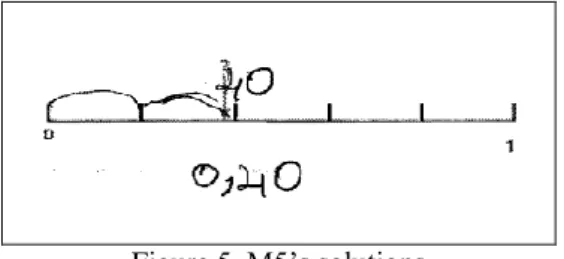
Converting 1 to a Larger Number
M5: This can be... (writing 40)
Researcher: 40 can be. As decimal which number can be? M5: ???
Researcher: As a fraction what would it be? M5: 0,40.
Researcher: How did you find it?
M5: There are 5 intervals. I multiply 5 by 20. It is 100. Since this is a whole, I add 20 to 20 and get 40.
Figure 5. M5’s solutions
M5 first stated 40 as an answer. When the researcher asked what decimal number it represented, M5 was not sure and did not answer. Then, the researcher asked what fraction it represented and he stated that it could be 0,40. When the researcher asked how he found this result, the student said that he multiplied 20 by 2 and got 40, and since the whole was 100, he represented 0,40 as fraction, although 0,40 is decimal representation (see Figure 5). Similar to M5, M6 confused the decimal numbers with fractions. Although M6 found a decimal at the beginning, she tried to find a decimal number again by doing some operations.
M5 and H5 assumed 100 as the whole and each interval has 20 units. M5 explained that he guessed that each interval as 20 and multiplied 20 by 5 to get the whole which was 100. In contrast to M5, H5 assumed the whole number line had 100 units, and he divided 100 by 5 and got 20 units for each interval.
H5: There are 20 units in each interval. The whole is 100. Researcher: Why 20?
H5: If the whole is 100, that is 20, 40, 60, 80, and 100. The whole is 100.
It can be seen that students preferred to think the whole as 100 and divided 100 by 5 instead of dividing 1 by 5 for the correct use of the number line. These two students indicated that each interval would be as 20 units and equal to each other. However, they did not make a correct estimation of the number indicated by the arrow.
Thinking First in Fractions and then Converting to Decimals
During the interviews it was observed that three students (L6, H5, and H6) tended to represent the arrow mark with a fraction instead of a decimal number and then convert the fraction to a decimal number. When the researcher asked L6 which decimal number he estimated, he wrote 9/10=0,9. Next, he explained that 9/10 was the fraction and 0,9 was its decimal representation (see Figure 3(a)). The dialogue between the student and the researcher is given below:
Researcher: As a decimal what would it be? L6: 9 tenth.
Researcher: Can you write? L6: (...writing 9/10)
Researcher: As a fraction what would it be? L6: Sorry, can I do this question again? Researcher: Of course.
L6: This is not a decimal (9/10). If we want to represent it as a decimal, it can be 0.9. Researcher: As a fraction?
L6: 9/10.
H5: Whole is 100, that is 20, 40, 60, 80, 100. When 20, it is 19, 19/20 as fraction. Researcher: As an estimation?
H5: I multiply 20 by 5 and get 100. Then, I must multiply 19 by 5, 95. As decimal, 1,95. (...writing) Researcher: Is this a fraction?
H5: (Showing 195
100 ). As decimal, it is 1,95.
The other student in this category, H6, stated 9/25 for the number that the arrow shows. Then, she multiplied the numerator and the denominator by 4 and obtained 36/100. Finally, she represented it 0.36 as a decimal number (see Figure 2(a)). Except for H6, we observed that many students even did not even take into account that the last tick on the number line was marked as 1. Instead, they counted the ticks and just ordered the numbers from 1 to 5 or they just wrote 5 for each interval. In general, all students’ solutions belonged to one of the three categories in Table 1. Some students’ solutions (H6, L6 and H5) belonged to multiple categories:
Table 1. The categories of students’ solutions
In the first category, we noticed that the students considered the decimals and fractions successive based on their previous experiences with the whole numbers. For example, the students divided each space into 5 units and named the place where the marker was as 9/25 (Table 1a). Since the marker was just before the second tick, the student considered 9 to be the number one less than 10. In the second category, the student took the whole as 100 and since the marker was after the second tick, he thought the place where the marker was as 40 and wrote it in decimals as 0,40 (Table 1b). In the third category, the students wrote the number where marker was as 9/10 and then converted it to decimal as 0,9 without thinking the whole (Table 1c). Here, it is important to note that in order to find the decimal number it is observed that students mostly started from fractions and then wrote that number in decimals. One of the important results was that students tried to find a single precise value although they were asked to make estimation. In other words, none of the students was able to think that there could be more than one answer. Another observation was about the difficulty in using the number line and using the value of 1 shown on the number line.
Pre-Service Teachers’ Solutions
Dividing 1 by the Number of Intervals
All pre-service teachers began to solve the problem by dividing 1 by 5 since there are 5 equal intervals. They took into account the ticks on the number line and they considered each tick as 1/5, 2/5, 3/5, 4/5 respectively. Especially for the second tick, they determined 2/5 as a fraction and they made an estimation using this value. After determining 2/5 for the second tick on the number line, pre-service teachers followed different ways to reach the answer.
Categories Representative students’ solutions Students
Successive Thinking (a)
H6, M6, L6, H5, L5
Converting 1 to a larger number
(b)
M5 and H5
Thinking first in fractions and then converting to decimals
(c)
Estimation by Considering the Closeness to 40/100 or 0,4
Three pre-service teachers (T4, T6, and T8) are in this category regarding their written solutions. One of them (T4) stated that the arrow should be between 1/5 and 2/5, and near 2/5. Then, he noted that the asked value should be near to 40/100; but smaller than it. Then, he answered that it could be 38/100 as it was close to 40/100.
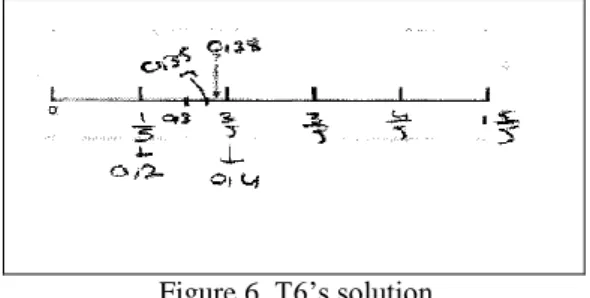
Another pre-service teacher (T6) also estimated 0,38 for the number that the arrow indicated. After she determined the fractions for the ticks, she converted 1/5 to 0,2 and 2/5 to 0,4 for making an estimation. Since 0,3 is the midpoint of 0,2 and 0,4, she stated that the asked point should be bigger than 0,3 and smaller than 0,4. To make a better estimation, she stated that it was bigger than 0,35, which is the midpoint of 0,3 and 0,4. Finally, she estimated the number as 0,38 and converted it to 38/100 (see Figure 6).
Figure 6. T6’s solution
One of the pre-service teachers (T8) also indicated that the answer was 0,37. Similar to T4, he stated that the asked arrow marked should be between 1/5 and 2/5, and close to 2/5. He considered that 1/5 can be written as 0,2 and 2/5 can be written as 0,4. Then, he wrote his answer as 0,37.
Successive Thinking
Two of the pre-service teachers (T1 and T7) made an estimation of the answer as 7/20. After they decided that the number that the arrow shows should be between 1/5 and 2/5, they expanded these fractions. T1 first multiplied numerators and denominators by 2 and obtained 2/10 and 4/10. She estimated 3/10 but she stated this value was not appropriate because this point represented the midpoint of these fractions. She explained that the asked value should be near to 4/10. Thus, she expanded these fractions by multiplying by 4 and obtained 4/20 and 8/20. Then, she decided that 7/20 could be more appropriate for the asked point (see Figure 7(a)). This fraction’s numerator is 7, one less number from 8. On the other hand, T7 directly multiplied the fractions (1/5 and 2/5) by 4. She explained that the asked point should be far to 1/5 and close to 2/5. When she found 4/20 and 8/20, she estimated the number as 7/20. Similar to T1’s answer, the numerator of this fraction is 7, one less number from 8.
(a)
(b)
Figure 7. T1’s and T7’s solution
Considering a Precise Value Rather Than Estimation
(a) (b)
Figure 8. T2’s solution and T3’s solution
In general, pre-service teachers’ solutions shared similarities and differences with the students’ answers. Different from the students, all pre-service teachers considered the whole as 1. But similar to the students, some pre-service teachers also thought the decimals as successive and tried to find a precise value rather than estimation. Table 2 shows the categories of all solutions and the representative examples from the pre-service teachers’ solutions. Except T5, other teachers belonged to two categories.
Table 2. The categories of the pre-service teachers’ solutions
Pre-service Teachers’ Thinking about Students’ Misconceptions and Difficulties
In the interviews, pre-service teachers were asked to reason about what misconceptions and difficulties students can have while solving this question. Pre-service teachers’ anticipation of misconceptions focused on density, the use of number line, and estimation. Table 3 shows these misconceptions and difficulties as well as the pre-service teachers’ response
Categories Representative pre-service teachers’ solutions Teachers Dividing 1 by the
number of intervals
All of them (T1, T2, T3, T4,
T5, T6, T7, T8)
Estimation by considering the closeness to 40/100
or 0,4
T4, T6, T8
Successive thinking T1 and T7
Considering a precise value rather
than estimation
Table 3. The categories of pre-service teachers’ thinking about students’ misconceptions and difficulty
Categories Representative comments
Misco
n
ce
p
tio
n
s
Density
T1: …We assume that students will predict that the answer is between 1/5 and 2/5, but they can say that there are no numbers between them.
T3: Dividing the interval of 0 and 1 can be abstract for students as 0 and 1 are successive.
T4: … The interval between the given numbers (1/5 and 2/5) is so small that students can think that there are no numbers between 1 and 2.
T6: According to students there are not any fractions between 1/5 and 2/5. The fraction that its denominator is 5.
T7: Considering there are not any numbers between 1/5 and 2/5, students can give up to solve. Of course, there are numbers between them.
T8: They can say that there are not any fractions between 1/5 and 2/5, we cannot find any fractions. They can give a wrong answer.
The incorrect use of number
line
Dividing incorrectly
T1: When he realizes 1, he should question if the intervals are equal. If he is sure of the equality, he has difficulty about dividing 1 by 5 or 5 by 1.
T5: For the second tick, they can say 5/2 instead of 2/5 when determining the values for ticks.
Counting ticks
T2: … The most important misconception is the start and end points (0 and 1) cannot be considered so students think that there are four intervals instead of 5 and they take 4 as the denominator instead of 5.
T3: There are 5 equal intervals, but students may think of the ticks (6) instead of the number of intervals (5). Thus, they can say 3/6 for the third tick.
Not considering 1
T1: I think students cannot see 1 on the number line, and count 1,2,3,4 after 0.
T6: Students can forget 0 and 1, and they can count and write 2, 3, and 4 for the ticks.
Estimation
Considering a precise value
T2: Students try to get the precise result. But, they should estimate here. They can think smaller than 2/5 since the asked point is to the left of 2/5. But, they can confuse estimation with the exact result. So, they can think that the answer cannot be found.
Considering midpoint
T7: We assume that the student can expand with multiplying by 2. He says 3/10, between 2/10 and 4/10. It is the midpoint. This consideration is a misconception. Placing between the two fractions does not mean it is the midpoint.
Dif
ficu
lty Estimating
T4: … Only they can comment like this: it is smaller than 2/5, close to 2/5. But, they cannot say it is the estimation, they cannot give a specific value. They can have difficulty in estimating.
T5: … For example, they can think the number line has 5 equal intervals, since this asked point is close to the second tick, 2/5. They cannot give any values for making estimation.
T6: Student can guess that it is between 0,2 and 0,4. I do not think a student can consider the midpoint to make estimation. For example, first, I found 0,3 and then 0,35 for estimation. I do not think a student can make a close estimation.
Most of the pre-service teachers anticipated that students might have problems related to density since they might not find any number between 1/5 and 2/5. When the pre-service teachers were asked what the reasons could be for this misconception, most of them indicated that students could think there were not any numbers between 1/5 and 2/5 because students would think these fractions as having the features of whole numbers. They stated that students would focus numerator, and try to find a fraction whose numerator was a whole number between 1 and 2. However, none of the students considered the whole as 1, so they didn’t divide 1 by 5. In other words, they were not able to think in terms of fractions when they began to solve the question. Instead, many of them used larger numbers such as 100, 25, or 10 as a whole. However, most of the students thought successively in the solving process, as pre-service teachers described.
Another misconception that pre-service teachers indicated was the incorrect use of number line. Dividing incorrectly, such as 5 by 2 or 5 by 1, was not observed in the students’ solutions, because the students did not use fractions to solve this question as indicated above. Additionally, pre-service teachers also stated that students’ difficulty with the ticks and the intervals on the number line. They asserted that the students might count the ticks instead of interval and thus they might determine the fraction for the asked point incorrectly. They stated that students could have a lack of knowledge about the use of the number line. However, the students did not use the number line in this way, but two students (M6 and L6) confused with counting the ticks that they put in interval. They did not count the whole ticks on the number line. They divided each interval into 5 smaller intervals. Then they counted the ticks until the estimated point as 9 and gave an answer of 0,9 ignoring that the rightmost tick indicates 1 as whole. As another misconception related with the use of number line, some teachers anticipated that students might have difficulty to see marker indicated by 1 on the number line. They indicated that students might write 1,2,3,4, and 5 after 0. One teacher explained this misconception with students’ lack of familiarity of decimals on the number line. She indicated that she did not see the location of decimals on the number line while learning decimals. Even though the students had problems considering 1 as a whole; instead of writing 5 for the whole, they wrote larger numbers such as 25 and 100. Only one student (L5) thought like this and wrote 2 for the second tick and gave answer 1,5 not thinking that the end point was 1. Thus, it can be said that teachers’ anticipation of this misconceptions was partially accurate.
On the other hand, pre-service teachers’ anticipation of difficulties focused on estimation. They indicated that students could think that 1/5 and 2/5 are too small and students could not find a number between these fractions. Anticipation of this difficulty was partially accurate as students actually found some values between 1/5 and 2/5. However, they did not consider that their answers are estimations and the actual position of the marker could be different from their answers.
Finally, the pre-service teachers indicated that students would prefer first the fraction to represent the asked point and then they would convert the fraction to decimal. Pre-service teachers stated that the reason behind this was students’ familiarity with fractions. Half of the students used this strategy.
abstract than the other models such as areas, concrete materials, etc. They added that the number line should be used after students learned about fractions and decimals conceptually. According to them, the number line should be used especially for ordering fractions and decimals.
Discussion and Conclusion
The students and pre-service teachers demonstrated somewhat different strategies for solving the question. The students tended to count all the ticks and make the denominator equal to the number of all ticks. Additionally, they tended to use larger numbers for denominators. On the other hand, all pre-service teachers divided 1 by 5, and wrote all ticks by fractions such as 1/5, 2/5, 3/5, and 4/5. Thipkong and Davis (1991) found that pre-service teachers had difficulty with showing less used decimals on a number line such as the numbers less than 10. In contrast with the findings of that study, in our study pre-service teachers could use the number line correctly and could find the decimal numbers correctly for the number line units. When students’ and pre-service teachers’ strategies were compared, it was observed that the students could not think of dividing 1 by 5. Instead of 1, the students preferred to take a larger number such as 100 that can be divided by 5 (i.e. the number of intervals). Some students tended to think fractions as successive numbers similar to whole numbers. They generally answered by subtracting 1 from the number that is on the second tick. Vamvakoussi and Vosniadou (2007) indicated similar thinking of students in their study. In their study, the students considered that decimal numbers and fractions have successive features similar to whole numbers. Two pre-service teachers (T1 and T7) also had similar thinking since they subtracted 1 from 8 like in whole numbers. It is important to note that these pre-service teachers were two of the high achieving ones. They could not think that other numbers such as decimals could be on the numerator. Other studies also showed that pre-service teachers might think successively in decimals (Merenluoto, 2003; Tsao, 2005).
Almost all students tried to find a precise value for the answer instead of an estimation value. Similarly, most pre-service teachers did not make a prediction. It is interesting that although two teachers (T2 and T3) thought that students might try to find an exact result rather than making estimation, the teachers themselves behaved similarly. The reason for this may be that they can pursue their problem-solving approaches that usually ask to find exact values. It is also stated in the literature that teachers’ perspectives and approaches are affected by their previous experiences in their students’ years (Anderson, White, & Sullivan, 2005; Cooney, 1999; Raymond, 1997).
Considering students’ achievement levels, high achieving students used more than one strategy to reach the result. For example, H6 used the first and the third strategy; H5 used all three strategies. This might be an expected result since high achieving students have more experience with different types of problems and develop different strategies in their solutions. However, only H6 could make a correct estimation. H5’s reasoning could also be accepted correct, but he made calculation errors and he could not reach the correct result. From this point, it can be said that high achieving students performed better than the medium and low achieving students. This situation may show that high achieving students conceptualize fractions and decimal numbers better than the other students. Medium achieving students (M5 and M6) could not distinguish fraction and decimal. Finally, we can say that low achieving (L5 and L6) students generally had difficulty with using the number line.
As for the students’ grade levels, it was observed that they use successive thinking regardless of their grades. However, especially fifth graders (M5 and H5) had a tendency to think the whole as 100. They converted 1 to 100 to reach a solution, while all 6th graders assumed each interval has 5 ticks and the whole is 25.
None of the pre-service teachers could anticipate that students would change the whole to a larger number divisible by 5. They predicted that all students would begin to solve this question by dividing 1 by 5, and obtain fractions for the representations of the ticks. But, students used 25 or 100 as a whole, instead of using fractions. Pre-service teachers also stated that students would experience a density misconception for finding a number between 1/5 and 2/5. They indicated that students could not think of any numbers between 1/5 and 2/5. But the students did not use 1/5 and 2/5 and therefore the density misconception was not seen in this situation. However, the students had density misconceptions, but not as indicated by pre-service teachers. The students thought successively, and they judged the asked point to be one less than the determined number of ticks until the second tick (such as stating 9 if the second tick was 10 or 19 if the second tick was 20).
Many pre-service teachers indicated that students can have misconception about using the number line. This misconception was seen in three students’ solutions. Two students (M6 and L6) did not consider all the ticks on the number line and another student (L5) used the number line incorrectly by ignoring 1. In the light of these findings, it can be argued that pre-service teachers can anticipate students’ misconception partially. Türnüklü and Yeşildere (2007) also stated that pre-service teachers have struggles with defining students’ misconceptions about fractions and decimals. Thus, it can be said that pre-service teachers’ pedagogical content knowledge was not adequate. Another reason for the preservice teachers’ inadequacy to anticipate students’ strategies might be the lack of teaching experiences, which is cited as an important factor by Depeape et al. (2015). Finally, two pre-service teachers did not mention about students’ difficulties regarding successive thinking since they also used successive thinking in their own solutions. This is a confusing situation since it is assumed that these pre-service teachers (T1 and T7) have strong content knowledge because of their high CGPA. Another interesting situation about content knowledge is that one of the pre-service teachers who can estimate closer value such as 0,38 by explaining her reasoning is a low achieving pre-service teacher (T6). Thus, it is questionable if their high CGPA is an indicator for strong content knowledge.
According to the findings, students had a difficulty with using the number line. For example, students could divide the intervals into equal parts by ticks, but they did not consider the total ticks during their solutions. The use of the number line to represent decimals is important for recognizing and ordering decimals, and doing operations with decimals (Thompson & Walker, 1996). Bright, Behr, Post, and Wachsmuth (1988, p. 215) describe the number line as “an integration of visual and symbolic information” that the use of the number line model can develop learners’ understanding of more abstract concepts such as spatial reasoning and symbolism. Therefore, teachers should give importance to representing the numbers on the number line (Janvier, 1987). There are many studies that deal with fractions and decimals, however this study had a specific aim as to determine students’ and pre-service teachers’ understanding of locating decimals and fractions on a number line. In this regard, the density property of decimals and fractions is investigated in this research. Considering the importance of density of rational numbers, this study can contribute a different perspective to the discussion of density property in mathematics education with using the number line. The number line model can give learners the sense of continuity that is essential for conceptualization of rational numbers (Widjaja et al, 2008). There are many studies that show how students and pre-service teachers’ have misconceptions about density (Depeape et al., 2015; Fuglestad, 1996; Hart, 1981; Liu et al., 2014; Merenluoto & Pehkonen, 2002; Merenluoto, 2003; Tsao, 2005; Veloo, 2012; Widjaja et al., 2008). With using the number line as a continuity model in this study, we observed that students did not comprehend the density property of decimals. This finding is in line with Michaelidou, Gagatsis, and Pitta-Pantazi’s (2004) research, that the researchers indicated that students did not perceive the number line as a continuous model.
As implications of this work, teachers should give more emphasis on interpreting and correctly using the number line to help students to conceptualize decimals and fractions. Especially, they can use it in ordering decimals and fractions. Teachers may also benefit from the number line to give a sense of continuity of decimals and fractions to prevent misconceptions about the density property of decimals and fractions. Another important issue is the representation of numbers on the number line. When pre-service teachers begin to teach students, they may have difficulties since they do not anticipate students’ thinking about the use of the number line, and representing decimals and fractions on the number line. In this regard, pre-service teachers’ pedagogical content knowledge can be improved using examples from students’ solutions in method courses.
These instruments can be used to conduct a quantitative study and might be applied to a larger population in order to reach more general conclusions. Additionally, mathematics educators might include topics related to decimal numbers in their method courses and emphasize how successive thinking differs when we compare decimal and whole numbers. They can also focus on the importance of estimation and discuss about the possibilities of multiple answers in different types of decimal problems.
References
An, S., Kulm, G. & Wu, Z. (2004). The pedagogical content knowledge of middle school teachers in China and the U.S. Journal of Mathematics Teacher Education, 7, pp. 145-172.
Anderson, J., White, P. & Sullivan, P. (2005). Using a schematic model to represent influences on, and relationships between, teachers’ problem solving beliefs and practices. Mathematics Education Research Journal, 17(2), 9-38.
Blömeke, S., & Delaney, S. (2012). Assessment of teacher knowledge across countries: A review of the state of research. ZDM Mathematics Education, 44, 223-247.
Bright, G. W., Behr, M. J., Post, T. R., & Wachsmuth, I. (1988). Identifying fractions on number lines, Journal for Research in Mathematics Education, 19(3), 215–232.
Brousseau, G., Brousseau, N., & Warfield, V. (2007). Rationals and decimals as required in the school curriculum Part 2: From rationals to decimals. Journal of Mathematical Behavior, 26, 281-300.
Cooney, T. J. (1999). Conceptualizing teachers’ ways of knowing. Educational Studies in Mathematics, 38(1-3), 163-187.
Creswell, J. W. (2005). Educational research: Planning, conducting, and evaluating quantitative and qualitative research (2nd Ed.). Upper Saddle River, NJ: Pearson Education, Inc.
Creswell, J. W. (2007). Qualitative inquiry & research design: Choosing among five approaches (2nd ed.). USA: Sage Publications.
Depeape, F., Torbeyns, J., Vermeersch, N., Janssens, D., Janssen, R., Kelchtermans, G., Verschaffel, L. & Van Dooren, W. (2015). Teachers' content and pedagogical content knowledge on rational numbers: A comparison of prospective elementary and lower secondary school teachers. Teaching and Teacher Education, 47, 82-92.
Glasgow, R., Ragan, G., Fields, W. M., Reys, R., & Wasman, D. (2000). The decimal dilemma. Teaching Children Mathematics, 7(2), 89–93.
Goldin, G., (2000). Affective pathways and representation in mathematical problem solving. Mathematical Thinking and Learning, 2, 209–219.
Fennema, E., Carpenter, T., Franke, M., Levi, L., Jacobs, V. & Empson, S. (1996). A longitudinal study of learning to use children's thinking in mathematics instruction. Journal for Research in Mathematics Education, 27(4), 403-434.
Fraenkel, J. R., Wallen, N. E, & Hyun, H. H. (2012). How to design and evaluate research in education (8th ed.).Mc-Graw Hill Companies, Inc.: New York.
Fuglestad, A. B. (1996). Teaching decimal numbers with spreadsheet as support for diagnostic teaching. In A. Buquet, J. Cabrera, E. Rodriguez & M. H. Sanchez (Eds.), ICME 8 (pp. 79-89). Spain: ICME.
Hart, K. (Ed.). (1981). Children’s understanding of mathematics11-16. London: Murray.
Hill. H. C, Rowan. B. &. Ball. D. L (2005). Effects of teachers' mathematical knowledge for teaching on student achievement. American Educational Research Journal. 42, 371-406.
Janvier, C. (1987). Translation processes in mathematics education. In C. Janvier (Ed.), Problems of representation in the teaching and learning of mathematics (pp. 27-32). Hillsdale, NJ: Lawrence Erlbaum.
Liu, R. D., Ding, Y., Zong, M., & Zhang, D. (2014). Concept development of decimals in chinese elementary students: A conceptual change approach. School Science and Mathematics, 114(7), 326-338.
McMullen, J., Hannula-Sormunen, M. M., & Lehtinen, E. (2015). Preschool spontaneous focusing on numerosity predicts rational number conceptual knowledge 6 years later. ZDM, 1-12.
Merenluoto, K. (2003). Abstracting the density of numbers on the number line a quasi-experimental study. In N. A. Pateman, B. J. Dougherty & J. Zilliox (Eds.), Proceedings of the 2003 Joint Meeting of PME and PMENA (Vol. 3, pp. 285 - 292). Honolulu, HI: CRDG, College of Education, the University of Hawai’i.
Merenluoto, K., & Lehtinen, E. (2002). Conceptual change in mathematics: understanding the real numbers. In M. Lim_on, & L. Mason (Eds.), Reconsidering conceptual change. Issues in theory and practice (pp. 233-258). Dordrecht: Kluwer Academic Publishers.
Merriam, S. B. (1998). Qualitative research and case study applications in education. Jossey-Bass Publishers: San Francisco.
Michaelidou, N., Gagatsis, A., & Pitta-Pantazi, D. (2004). The number line as a representation of decimal numbers: A research with sixth grade students. In M. J. Hoines, & A. B. Fuglestad (Eds.), Proceedings of the 28th conference of the International Group for the Psychology of Mathematics Education (pp. 305–312). Bergen, Norway: PME.
Ministery of National Education (MoNE) (2013). Ortaokul matematik dersi 5-8.sınıflar öğretim programı.
Retrieved February 15, 2013 from http://ttkb.meb.gov.tr/www/guncellenen-ogretim-programlari/icerik/151.
Moskal, B. M., & Magone, M. E. (2000). Making sense of what students know: Examining the referents, relationships and modes students displayed in response to a decimal task. Educational Studies in Mathematics, 43(3), 313-335.
Moss, J. & Case, R. (1999). Developing children's understanding of the rational numbers: A new model and an experimental curriculum. Journal for Research in Mathematics Education, 30(2), 122-147.
Neumann, R. (1998). Students’ ideas on the density of fractions. In Proceedings of the Annual Meeting of the Gesellschaft fur Didaktik der Mathematik (pp. 97-104).
Patton, M. Q. (1990). Qualitative evaluation and research methods (2nd ed.). Newbury Park, CA: Sage Publications, Inc.
Putt, I. J. (1995). Pre-service teacher ordering of decimal numbers: When more is smaller and less is larger!
Focus on Learning Problems in Mathematics, 17(3), 1-15.
Raymond, A. (1997). Inconsistency between a beginning elementary school teacher’s mathematics beliefs and teaching practice. Journal for Research in Mathematics Education, 28(5), 550-576.
Smith, C. L., Solomon, G. E. A., & Carey, S. (2005). Never getting to zero: Elementary school students’ understanding of the infinite divisibility of number and matter. Cognitive Psychology, 51, 101–140. Stacey, K. (2005). Travelling the road to expertise: A longitudinal study of learning. In H. L. Chick &J. L.
Vincent (Eds.), Proceedings of the 29th Conference of the International Group for the Psychology of Mathematics Education, 1, 19-36. Melbourne: PME
Stacey, K., Helme, S., Steinle, V., Baturo, A., Irwin, K., & Bana, J. (2001). Pre-service teachers’ knowledge of difficulties in decimal numeration. Journal of Mathematics Teacher Education, 4(3), 205-225.
Stake, R. (1995). The art of casestudy research. Thousand Oaks, CA: Sage.
Steinle, V. & Stacey, K. (1998). The incidence of misconceptions of decimal notation amongst students in grades 5 to 10. In C. Kanes, M. Goos & E. Warren (Eds.), Teaching mathematics in new times (Proceedings of the 21st annual conference of the Mathematics Education Research Group of Australia, pp. 548-555). Brisbane: MERGA.
Steinle, V., & Stacey, K. (2004). Persistence of decimal misconceptions and readiness to move to expertise.
Proceedings of the 28th conference of the International Groups for the Psychology of Mathematics Education, 4, 225-232.
Thipkong, S., & Davis, E. J. (1991). Preservice elementary teachers’ misconceptions in interpreting and applying decimals. School Science and Mathematics, 91, 93–99.
Thompson, C. S., & Walker, V. (1996). Connecting Decimals and Other Mathematical Content. Teaching Children Mathematics, 2(8), 496-502.
Tsao, Y. L. (2005). The number sense of pre-service elementary school teachers. College Student Journal, 39(4), 647-679.
Türnüklü, E. B., & Yeşildere, S. (2007). The pedagogical content knowledge in mathematics: pre-service primary mathematics teachers' perspectives in Turkey. Issues in the Undergraduate Mathematics Preparation of School Teachers, 1, 1-13.
Ubuz, B. & Yayan, B. (2010). Primary teachers’ subject matter knowledge: Decimals. International Journal of Mathematical Education in Science and Technology, 41(6), 787-804.
Vamvakoussi, X., & Vosniadou, S. (2004). Understanding the structure of the set of rational numbers: a conceptual change approach. Learning and Instruction, 14(5), 453-467.
Vamvakoussi, X., & Vosniadou, S. (2007). How many numbers are there in a rational numbers interval? Constraints, synthetic models and the effect of the number line. Reframing the Conceptual Change Approach in Learning and Instruction.
Van de Walle J. A., Karp K. S., & Bay-William, J. M. (2013). Elementary and middle school mathematics: teaching developmentally (8th Ed.). United States of America: Pearson Education, Inc.
Veloo, P. K. (2012). The Development of Number Sense Proficiency: An Intervention Study with Year 7 Students in Brunei Darussalam. The Mathematics Educator, 13(2), 39-54.
Yin, R. K. (2003). Case study research: Design and method (3rd Ed.). Thousand Oaks, CA: Sage.
Widjaja, W., Stacey, K. & Steinle, V. (2008). Misconceptions about density of decimals: Insights from Indonesian Pre-service Teachers. Journal of Science and Mathematics Education in Southeast Asia, 31(2), 117-131.
Author Information
Dilek Girit
Trakya University, Faculty of Education Edirne, Turkey
Contact e-mail: [email protected]
Didem Akyuz