European Journal of Physical Education and Sport Science
ISSN: 2501 - 1235 ISSN-L: 2501 - 1235 Available on-line at: www.oapub.org/edu
doi: 10.5281/zenodo.2484410 Volume 5 │ Issue 2 │ 2018
THE VIEWS OF PROSPECTIVE
PHYSICAL EDUCATION TEACHERS
ABOUT THE NATURE OF SCIENCE
Kurtuluş Özlü1, Şafak Uluçınar Sağır2, Resul Çekin3, Faruk Yamaner4, Abdusselam Turgut5,
1,4,5Hitit University,
Faculty of Sports Science, Çorum, Turkey
2Amasya University, Faculty of Education,
Department of Primary School, Amasya, Turkey
3Amasya University, Faculty of Education,
Department of Physical Education and Sport, Amasya, Turkey
Abstract:
Keywords: physical education, sport, nature of science
1. Introduction
Concept of science is basically described as the complex process of systematic studies on structure and behaviour of the physical and natural world through observations and experiments. It’s result of systematized knowledge and humankind’s efforts to reach the fact regardless of the era or geography. While Turkish Language Society defines science as a systematic knowledge concerning one part of events or whole universe and the act of approving the results into law through observations and experiments, Çepni (2005) defines “science” as a process of accurate thinking, exploring the truth and knowledge, getting systematic knowledge through scientific research means and efforts to comprehend and describe the universe.
The perception of science as the accumulation of knowledge clustered to change when nature of physical sciences began to be emphasized. A great number of studies on NOS have been performed in last 40 years. Some scientists including Giggens, Lederman, Cleminson, Ryan, Aikenhead have mentioned that a positive approach to science which accepts science as the cumulating knowledge gathered by deduction, observations and experiments should be replaced with a postpositive one which argues that science is a rather dynamic and tentative activity. It cannot be realized through a simple scientific method or cannot be restricted by political, cultural and social factors. They have also asserted that science has interdisciplinary function (Türkmen & Yalçın, 2008).
Nowadays, due to lack of science and scientific literacy insights, it’s hard to raise an individual who has sense of wonder and problem solving ability (Beşli, 2008). Therefore, it should be a matter of priority that pupils must be taught the nature of science as to catch up with developed countries. From this point of view, getting the students adopt a NOS notion, let them deal with science as a human activity and make sense of objective reality just through subjective perception are extremely important for the functionality of science. This principle should be inserted in the goals of education (Çakıcı, 2009). Although there is no a unique NOS definition, McComas (2000) defines the term “…a fertile hybrid arena including the history, sociology philosophy of science combined with research from scientists operate as a social group and how society itself both directs and reacts to scientific endeavours.”
Social sciences refer to the fields of scientific studies concerned with society and relationships among individuals within a society (Duverger, 1990). As a branch of social sciences, physical education can be defined as the studies of movements which shape the students physically, socially, and mentally (Çöndü, 1999). The concept of sport as a social phenomenon at present might be examined as a process of health enhancing exercise habit formation according to certain scientific principals (Açıkada & Ergen 1990; Kuru 2000).
Sports is a multidisciplinary field which involves scientific findings, debates and methods aims to satisfy individuals’ subconscious desires such as beating and winning and is carried out by a set of rules. It interacts with kinesiology, physiology, biomechanics ergonomic, anthropology, sports medicine, orthopedia and rehabilitation (Özbek, 2004). Sports, physical, psychological, social and economic deficiencies from above are also a multi-functional discipline (Mumcu and Çeviker). Sports is an achievement driven process requiring physical, mental, and technical efforts for the participants and activities which appeal sense of aesthetic and amusement. As a scientific domain sports emphasizes the necessity for scientific literacy in order that students can achieve their affective, psychomotor and cognitive goals (Semerci, 2002). It is a known fact that physical capacity alone is not enough in increasing sports performance and success (Sekeroğlu, 2017). All students take physical education and sports lessons since the beginning of primary school. Whilst some of physical education and sports teachers have bachelor degree, the others are college graduates with pedagogical formation. Sports teachers are expected to get specialized both in science literacy and their own field during university education. When reviewed the literature, it is observed that sports teachers’ perception of sports as a scientific domain but there is a lack of investigation about their NOS notions.
2. Purpose of the Study
The aim of this study is to identify and examine NOS notions of university students who attend physical education and sports teaching programme at Amasya University and prospective sports teachers studying pedagogical formation at Hitit University and Amasya University in accordance with certain variables.
For this purpose, the questions below have been tried to be answered
a) Are there any differences between undergraduate sports and physical education students’ and prospective teachers’ NOS notions?
b) Are there any differences between undergraduate sports and physical education students’ and preservice teachers’ NOS notions according to demographic features?
3. Method
3.1 Research Model
The research has been carried out by using survey model. Descriptive survey research model refers to gathering data in a certain period of time by comparing the relations among the variables and identifying the relations among specific events in order to achieve significant goals (Karasar, 1999).
3.2 Population and Sample
The research has been conducted on undergraduate physical education students attending Amasya University during the fall semester in 2015-2016 academic years and prospective teachers or final year university students who have studied coaching, sports management and recreation in sports academies and taking formation education during the same period. Subjects participating in the study were selected by random sampling. Random sampling means the type of the sampling which is capable of representing the whole universe statistically and determined completely randomly.
The participants of the study were 147 university students who were studying at physical education teaching and sports department at Amasya University and 85 prospective teachers who were studying pedagogical formation at Hitit University. 81 of the participants were female prospective teachers (34.9%), and 151 of them were male prospective teachers (65.1%). 31 of the participants were freshmen (13.4%), 33 of them were second year university students (14.2%), 40 of them were third year university students (17.2%), 86 of them were final year university students (37.1% ), and 42 of them were graduate prospective teachers (18.1%). While 43 of them were at and under the age of 20 (18.5%), 82 of them at the age of 21-22 (35.3%), 45 of them were at the age of 23-24 (19.4%), and 62 of them were at and above the age of 25 (26.7%). 42 participants were science, social sciences Anatolian high school graduates (18.1), 128 participants were general high school graduates (55,2%), 40 participants were vocational high school graduates(17.2%), and 22 of them were Art and Sports High School graduates (9.5%).
3.3 Data Collection Tools
In order to collect data a questionnaire was prepared. The questionnaire consists of two parts. In the first part of the form, the items ask for information about participants’ age, gender, grade levels, high school graduation, master programme and their state of following scientific studies, whether they had a course related to science such as science history, science philosophy during their university education, whether they follow developments in their teaching field. In the second part of the form, participants were asked to answer “Nature of Scientific Knowledge Scale” (NSKS).
3.4 Nature of Scientific Knowledge Scale (NSKS)
1. Amoral: Scientific knowledge provides people with some specific abilities but it doesn’t support information about how to use it.
2. Creative: Scientific knowledge is the product of human intelligence. Imagination and Creativity have roles in getting scientific knowledge.
3. Developmental: Scientific knowledge can be changed and developed.
4. Parsimonious: Scientific knowledge tends to be simple and easy rather than being complicated and hard.
5. Testable: Scientific knowledge can be testable and experimental.
6. Unified: Whole systematized knowledge contributes to science by its explanatory and predictive features.
The scale’s validity and reliability were tested by both university and high school students. Reliability coefficient (Cronbach’s α) was conducted between 0.65 and 0.88 (Aslan, 2009; Çilingir et al., 2013).
3.5 Data Analysis
SPSS 15 was employed to analyse the data. Independent variables for prospective teachers were identified as gender, age, grade level, high school they graduated from, and their state of interest in scientific studies.
4. Findings
The score which prospective teachers get from NSKS and subscales are presented in Table 1.
Table 1: General Score Mean of Prospective Teachers According to NSKS and Subscales
Scale Scores Min Max Mean S
Whole General 70.00 204.00 146.84 18.57
Mean 1.46 4.25 3.06 0.39
Amoral General 11.00 36.00 24.16 3.98
Mean 1.38 4.50 3.02 0.50
Creative General 12.00 37.00 24.66 4.00
Mean 1.50 4.63 3.08 0.50
Developmental General 12.00 37.00 24.36 4.46
Mean 1.50 4.63 3.04 0.56
Parsimonious General 11.00 38.00 24.73 4.17
Mean 1.38 4.75 3.09 0.52
Testable General 8.00 36.00 24.58 4.15
Mean 1.00 4.50 3.07 0.52
Unified General 12.00 35.00 24.34 3.96
Mean 1.50 4.38 3.04 0.50
deviation value is 0.39. The value =3.06 pairs up “indecisive” option in five pointed likert scale.
In accordance with this result, it is concluded that prospective teachers are indecisive in terms of nature of scientific knowledge.
The top score taken from subscales is 40.00 and bottom score is 8.00 as each dimension consists of 8 items. Analysed the NSKS subscales it is seen that mean scores of Amoral ( =3.02), Creative ( =3.08), Developmental ( =3.04), Parsimonious ( =3.09), Testable ( =3.07) and Unified ( =3.04) subscales pair up with indecisive option in five pointed likert scale.
The variations in prospective teachers’ nature of scientific knowledge notions regard to the programme they study were analysed according to independent samples t-test and the results are presented below.
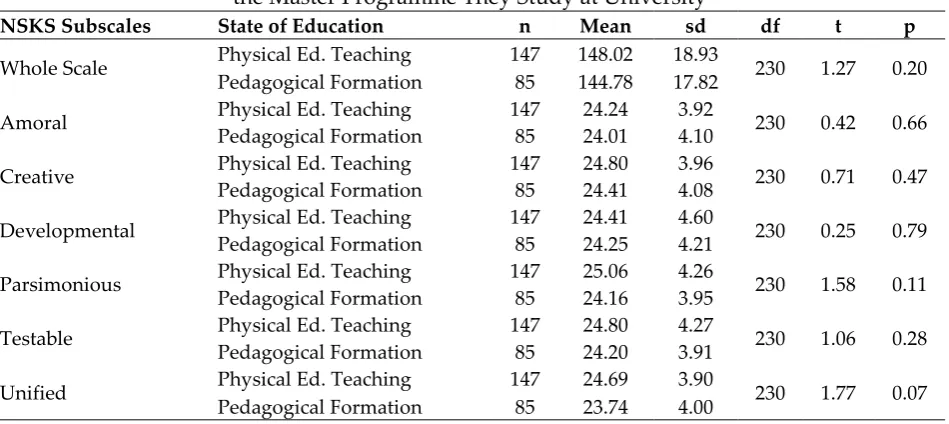
Table 2: T-Tests Results of Prospective Teachers’ NSKS Scores Regard to the Master Programme They Study at University
NSKS Subscales State of Education n Mean sd df t p
Whole Scale Physical Ed. Teaching 147 148.02 18.93 230 1.27 0.20 Pedagogical Formation 85 144.78 17.82
Amoral Physical Ed. Teaching 147 24.24 3.92 230 0.42 0.66 Pedagogical Formation 85 24.01 4.10
Creative Physical Ed. Teaching 147 24.80 3.96 230 0.71 0.47 Pedagogical Formation 85 24.41 4.08
Developmental Physical Ed. Teaching 147 24.41 4.60 230 0.25 0.79 Pedagogical Formation 85 24.25 4.21
Parsimonious Physical Ed. Teaching 147 25.06 4.26 230 1.58 0.11 Pedagogical Formation 85 24.16 3.95
Testable Physical Ed. Teaching 147 24.80 4.27 230 1.06 0.28 Pedagogical Formation 85 24.20 3.91
Unified Physical Ed. Teaching 147 24.69 3.90 230 1.77 0.07 Pedagogical Formation 85 23.74 4.00
It has been seen that the prospective teachers’ studying pedagogical formation or attending physical education teaching department at university causes no difference in terms of their NOS notions ( t230 =1.27; p=0.20>0.05). Also, when subscales are analysed it
is seen that there is no difference between the students attending physical education teaching department and prospective teachers studying pedagogical formation.
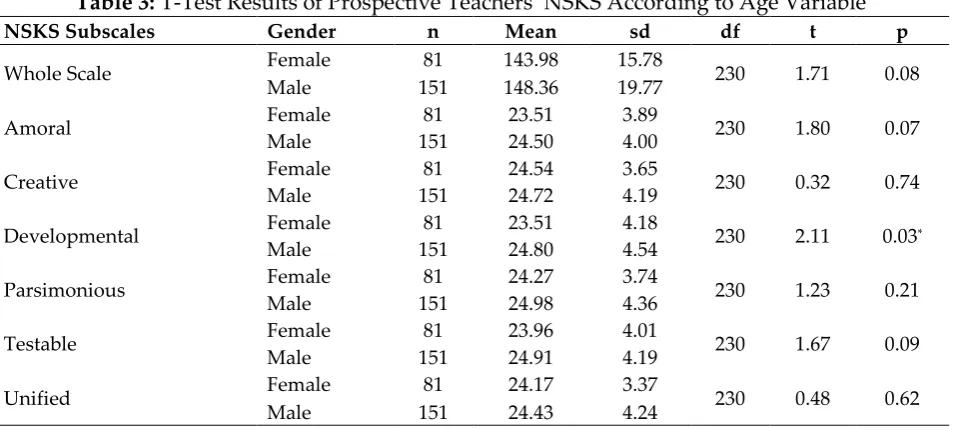
Table 3: T-Test Results of Prospective Teachers’ NSKS According to Age Variable NSKS Subscales Gender n Mean sd df t p
Whole Scale Female 81 143.98 15.78 230 1.71 0.08
Male 151 148.36 19.77
Amoral Female 81 23.51 3.89 230 1.80 0.07
Male 151 24.50 4.00
Creative Female 81 24.54 3.65 230 0.32 0.74
Male 151 24.72 4.19
Developmental Female 81 23.51 4.18 230 2.11 0.03*
Male 151 24.80 4.54
Parsimonious Female 81 24.27 3.74 230 1.23 0.21
Male 151 24.98 4.36
Testable Female 81 23.96 4.01 230 1.67 0.09
Male 151 24.91 4.19
Unified Female 81 24.17 3.37 230 0.48 0.62
Male 151 24.43 4.24
(*p<0.05)
According to Table 3 in terms of gender variable there is no statistically difference in physical education prospective teachers’ NSKS scores. Female participants’ mean score is X Female= 143.98, and male participants’ mean score is X Male= 148.36. Similarly there is
no statistical difference in prospective teachers’ NOS notions according to parsimonious, testable, unified subscales (p>0.05)
There is a difference on behalf of male participants according to developmental subscale (t230=2.11; p=0.03). The mean score of male participants is X Male= 24.80 and
mean score of female participants is X Female= 23.51.
The descriptive statistics of physical education teachers’ NSKS scores according to the age variable is presented in Table 4a and results of single factorial analysis of variance (ANOVA) are presented in Table 4b.
Table 4a: Descriptive analysis of physical education teachers’ NSKS scores according to age Age Groups
20 years and under
(n=43)
Between 21-22 (n=82)
Between 23-24 (n=45)
25 years and above
(n=62)
Total (n=232)
Mean sd Mean sd Mean sd Mean sd Mean sd
Table 4b: ANOVA Results of Physical Education Teachers’ NSKS Scores according to Age Variance
Resource
Sum of
Squares sd
Mean of
Squares F p
Whole Scale
Among groups 228.429 3 76.143
0.219 0.88 In group 79397.347 228 348.234
Total 79625.776 231
Amoral
Among groups 12.538 3 4.179
0.261 0.85
In group 3654.561 228 16.029
Total 3667.099 231
Creative
Among groups 15.171 3 5.057
0.313 0.81
In group 3688.928 228 16.180
Total 3704.099 231
Developmental
Among groups 10.915 3 3.638
0.181 0.90
In group 4580.391 228 20.089
Total 4591.306 231
Parsimonious
Among groups 30.566 3 10.189
0.584 0.62
In group 3976.865 228 17.442
Total 4007.431 231
Testable
Among groups 7.953 3 2.651
0.152 0.92
In group 3968.491 228 17.406
Total 3976.444 231
Unified
Among groups 25.815 3 8.605
0.545 0.65
In group 3598.599 228 15.783
Total 3624.414 231
When prospective teachers’ NSKS scores are compared according to age variable scores in whole aspect (F3-231=0.219; p=0.88) and subscales, there has found no difference
(p>0.05).
The descriptive statistics and variance analysis results of physical education teachers’ NSKS scores in whole aspect and subscales according to grade level variable are presented Table 5a and Table 5b.
Table 5a: Descriptive Analysis of Prospective Physical Education Teachers’ NSKS Scores
According to Their Grade Levels Grade Levels
1st Grade
(n=31)
2nd Grade
(n=33)
3rd Grade
(n=40)
4th Grade
(n=86)
Graduate (n=42)
Total (n=232) Mean sd Mean sd Mean sd Mean sd Mean sd Mean sd
Whole Scale 143.35 15.54 151.18 26.31 149.67 15.47 144.91 17.04 147.21 18.82 146.83 18.56
Amoral 22.83 3.90 24.69 4.29 24.80 3.63 24.12 3.73 24.16 4.52 24.15 3.98
Creative 23.80 3.79 25.42 5.09 24.87 3.33 24.54 3.92 24.71 3.98 24.65 4.00
Developmental 23.61 4.27 25.30 5.63 24.80 4.15 23.80 4.37 24.88 3.93 24.35 4.45
Parsimonious 24.64 3.84 24.84 5.48 25.20 4.24 24.48 3.67 24.76 4.23 24.73 4.16
Testable 24.64 4.33 24.93 5.70 24.95 3.57 24.19 3.75 24.69 3.98 24.58 4.14
Table 5b: ANOVA Results of Physical Education Prospective Teachers’ NSKS Scores According To Grade Level
Variance Resource
Sum of Squares sd
Mean of
Squares. F p
Source of Difference
Whole Scale
Among groups 1643.493 4 410.873
1.196 0.31 In group 77982.283 227 343.534
Total 79625.776 231
Amoral
Among groups 80.110 4 20.027
1.267 0.28 In group 3586.990 227 15.802
Total 3667.099 231
Creative
Among groups 44.939 4 11.235
0.697 0.59 In group 3659.160 227 16.120
Total 3704.099 231
Developmental
Among groups 92.537 4 23.134
1.167 0.32 In group 4498.769 227 19.818
Total 4591.306 231
Parsimonious
Among groups 14.584 4 3.646
0.207 0.93 In group 3992.847 227 17.590
Total 4007.431 231
Testable
Among groups 22.953 4 5.738
0.329 0.85 In group 3953.491 227 17.416
Total 3976.444 231
Unified Among groups 150.833 4 37.708
2.464 0.04
1-2 Grade 2-4 Grade 2-Graduate In group 3473.580 227 15.302
Total 3624.414 231
There has found no difference among the grade levels according to whole scale NSKS scores (F4-231=1.196; p=0.31). Mean score of 1st grade students is 143.35, mean score of 2nd
grade students is 151.18. Mean score of 3rd grade students is 149.67, mean score of 4th
grade students is 144.91 and mean score of graduates is 147.21. As it is seen as in Table 5a 2nd grade students’ subscale mean scores are higher than the other grade levels.
When subscales means are compared it is seen that there is only difference in unified subscale (F4-231=2.464, p=0.04) and no difference has been found in other dimensions
(p=0.05). There is a difference in unified subscale of NSKS between 1st and 2nd grade
students (23.80- 25.96), between 2nd and 4th grade students (25.96-23.75) and between 2nd
grade students and graduates (25.96-24.00).
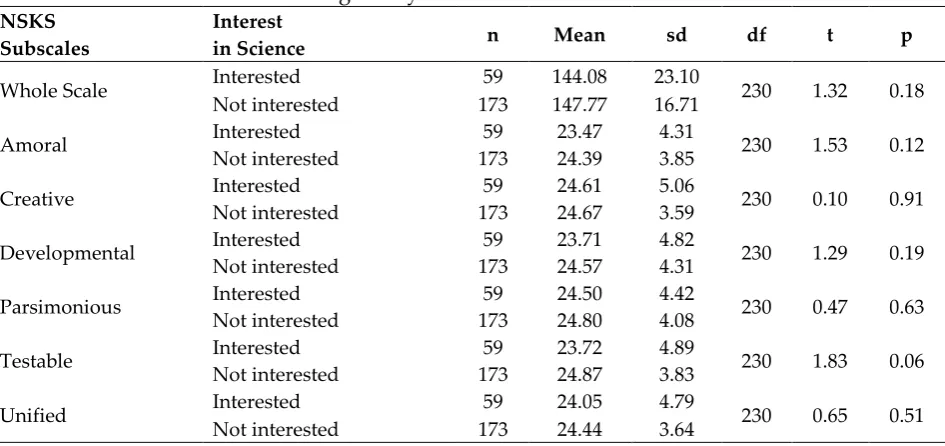
Table 6: T-Test Results According to Physical Education Teachers’ Levels of Science Interest NSKS
Subscales
Interest
in Science n Mean sd df t p
Whole Scale Interested 59 144.08 23.10 230 1.32 0.18 Not interested 173 147.77 16.71
Amoral Interested 59 23.47 4.31 230 1.53 0.12
Not interested 173 24.39 3.85
Creative Interested 59 24.61 5.06 230 0.10 0.91
Not interested 173 24.67 3.59
Developmental Interested 59 23.71 4.82 230 1.29 0.19 Not interested 173 24.57 4.31
Parsimonious Interested 59 24.50 4.42 230 0.47 0.63 Not interested 173 24.80 4.08
Testable Interested 59 23.72 4.89 230 1.83 0.06
Not interested 173 24.87 3.83
Unified Interested 59 24.05 4.79 230 0.65 0.51
Not interested 173 24.44 3.64
According to Table 6, there is no difference among their NSKS scores according to their interests in science and scientific studies. Mean score of prospective teachers who say “I am interested in science and scientific studies” is X İnterested= 144.08, and mean score of
the prospective teachers who say “No, I am not interested in science and scientific studies” is X Not interested= 148.36. Similarly there has found no statistically difference in
subscales such as amoral, creative, parsimonious, testable, unified (p=0.05).
Table 7: T-Test Results According to Taking Related NOS Courses
NSKS Subscales
The state of having taken Nature of science,
science philosophy etc. courses
n Mean sd df t p
Whole Scale Taken 34 149.76 16.07 230 0.99 0.32
Not taken 198 146.33 18.95
Amoral Taken 34 24.44 3.34 230 0.08 0.65
Not taken 198 24.11 4.09
Creative Taken 34 25.32 3.29 230 0.26 0.29
Not taken 198 24.54 4.11
Developmental Taken 34 25.23 4.49 230 0.72 0.21
Not taken 198 24.20 4.44
Parsimonious Taken 34 24.76 3.21 230 0.08 0.96
Not taken 198 24.72 4.31
Testable Taken 34 24.79 3.60 230 0.56 0.74
Not taken 198 24.54 4.24
Unified Taken 34 25.20 4.43 230 0.43 0.17
Not taken 198 24.19 3.86
X taken= 149.76, while the mean score of prospective teachers who haven’t studied
science philosophy and nature of science courses during university education is X not
taken= 146.33. Similarly the findings indicated that there was no statistically significant
difference in amoral, creative, parsimonious testable and unified subscales of scientific knowledge (p>0.05).
Prospective teachers’ whole scale NSKS scores and variations in subscales according to following the developments in their teaching field have been analysed and independent t-test results are presented in Table8.
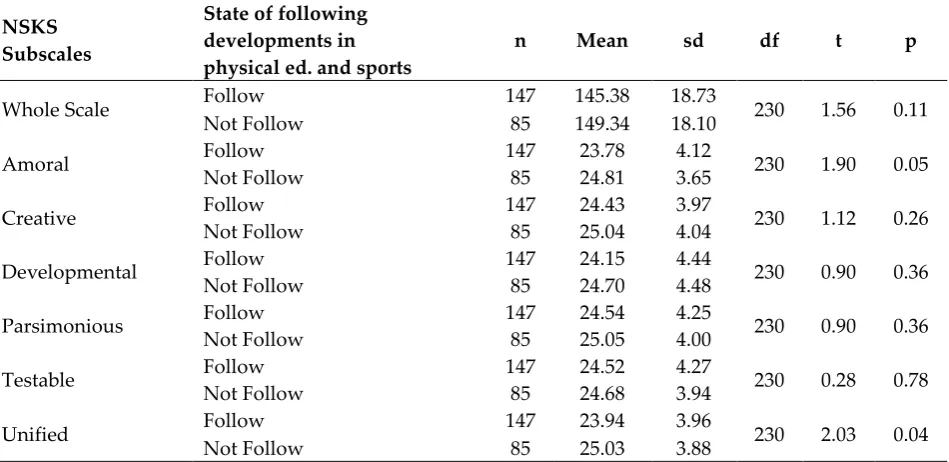
Table 8: T-Test NSKS Results According to Following Developments in Their Field of Study
NSKS Subscales
State of following developments in physical ed. and sports
n Mean sd df t p
Whole Scale Follow 147 145.38 18.73 230 1.56 0.11
Not Follow 85 149.34 18.10
Amoral Follow 147 23.78 4.12 230 1.90 0.05
Not Follow 85 24.81 3.65
Creative Follow 147 24.43 3.97 230 1.12 0.26
Not Follow 85 25.04 4.04
Developmental Follow 147 24.15 4.44 230 0.90 0.36
Not Follow 85 24.70 4.48
Parsimonious Follow 147 24.54 4.25 230 0.90 0.36
Not Follow 85 25.05 4.00
Testable Follow 147 24.52 4.27 230 0.28 0.78
Not Follow 85 24.68 3.94
Unified Follow 147 23.94 3.96 230 2.03 0.04
Not Follow 85 25.03 3.88
As shown in Table 8 prospective teachers’ following developments in their field causes statistically no difference among their NSKS views. Mean scores of the prospective teachers who follow the developments in their field is X Follow= 145.38, and mean score
of prospective teachers who don’t follow the developments is X Not follow=
149.34.Similarly the findings indicates that there is no statistically significant difference in amoral, creative, development, parsimonious testable and unified subscales of scientific knowledge (p>0.05).
There has found out statistically differences in favour of prospective teachers who follow the developments in their field according to unified subscale (t230=2.03;
p=0.04. Mean scores of prospective teachers who don’t follow the developments in their field is X Not follow = 25.03 and mean score of prospective teachers who follow the
developments is X Follow = 23.94.
Table 9a: Comparison of NSKS Scores
According to High School Graduation Kruskal Wallis Results NSKS
Subscales High School Graduation n
Mean of
Rank sd χ2 P Difference
Whole Scale
Science, Social Sciences, Anatolian
High School (1) 42 126.39
3 4.26 0.23 General High School (2) 128 115.91
Vocational High School (3) 40 100.21 Art and Sport High School (4) 22 130.68
Amoral
Science, Social Sciences, Anatolian
High School (1) 42 123.82
3 5.69 0.12 General High School (2) 128 108.61
Vocational High School (3) 40 119.83 Art and Sport High School (4) 22 142.41
Creative
Science, Social Sciences, Anatolian
High School (1) 42 119.05
3 0.17 0.98 General High School (2) 128 116.93
Vocational High School (3) 40 113.30 Art and Sport High School (4) 22 114.95
Developmental
Science, Social Sciences, Anatolian
High School (1) 42 121.42
3 4.07 0.25 General High School (2) 128 120.92
Vocational High School (3) 40 97.30 Art and Sport High School (4) 22 116.32
Parsimonious
Science, Social Sciences, Anatolian
High School (1) 42 108.89
3 2.23 0.52 General High School (2) 128 122.36
Vocational High School (3) 40 108.34 Art and Sport High School (4) 22 111.77
Testable
Science, Social Sciences, Anatolian
High School (1) 42 119.49
3 8.62 0.03 2-3, 3-4 General High School (2) 128 117.93
Vocational High School (3) 40 93.55 Art and Sport High School (4) 22 144.20
Unified
Science, Social Sciences, Anatolian
High School (1) 42 130.63
3 15.32 0.00 1-3, 2-3, 2-4, 3-4 General High School (2) 128 114.36
Vocational High School (3) 40 88.71 Art and Sport High School (4) 22 152.52
As shown in Table 9a graduation high school type doesn’t cause statistically difference for prospective teachers’ NSKS views. χ2 (sd=3, n=232)=4.26, p>0.05.
Yet in Testable (χ2 (sd=3, n=232)=8.62, p>0.05) and unified χ2 (sd=3, n=232)=15.32,
subscale following high schools are science high school, social sciences high school, Anatolian high school, general high school, vocational high school graduates.
Mann Whitney U test results of prospective teachers’ NSKS whole scale scores and subscale scores according to graduate high school variable are presented in Table 9b.
Table 9b: Comparisons of NSKS Scores According To High School Graduation U-Test Results
NSKS
Subscales High School Graduation n Mean Rank Sum Rank U p
Testable General High School (2) 128 88.75 11360.00 2016.00 0.04 Vocational .high School (3) 40 70.90 2836.00
Testable Vocational .high School (3) 40 27.28 1091.00 271.00 0.01 Art and Sport High School (4) 22 39.18 862.00
Unified
Science, Social Sciences,
Anatolian High School (1) 42 48.39 2032.50 550.50 0.00 Vocational .high School (3) 40 34.26 1370.50
Unified General High School (2) 128 89.33 11434.00 1942.00 0.02 Vocational .high School (3) 40 69.05 2762.00
Unified General High School (2) 128 71.75 9183.50 927.50 0.01 Art and Sport High School (4) 22 97.34 2141.50
Unified Vocational High School (3) 40 26.40 1056.00 236.00 0.00 Art and Sport High School (4) 22 40.77 897.00
High school type they graduated from doesn’t cause statistically meaningful difference for physical education prospective teachers’ NSKS views in Testable and Unified Subscales. In consideration of Testable NSKS subscale mean rank, Vocational High School graduates have lower scores than General High School and Art and Sports High School graduates In Unified NSKS subscale Vocational High School Graduates have relatively lower mean rank than Science High School, Social Sciences High School, Anatolian High School, General High School and Art and Sports High School graduates. On the other hand, it can be seen that Art and Sports High School graduates have higher mean rank than General High School graduates.
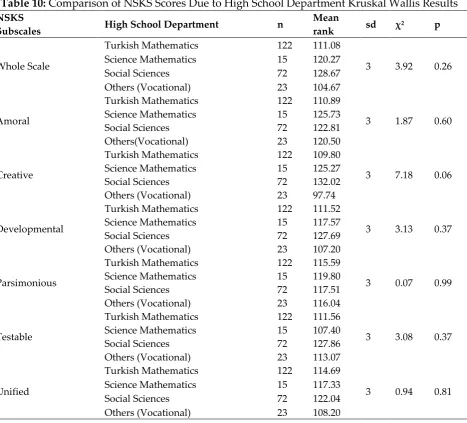
Table 10: Comparison of NSKS Scores Due to High School Department Kruskal Wallis Results NSKS
Subscales High School Department n
Mean
rank sd χ2 p
Whole Scale
Turkish Mathematics 122 111.08
3 3.92 0.26 Science Mathematics 15 120.27
Social Sciences 72 128.67
Others (Vocational) 23 104.67
Amoral
Turkish Mathematics 122 110.89
3 1.87 0.60 Science Mathematics 15 125.73
Social Sciences 72 122.81
Others(Vocational) 23 120.50
Creative
Turkish Mathematics 122 109.80
3 7.18 0.06 Science Mathematics 15 125.27
Social Sciences 72 132.02
Others (Vocational) 23 97.74
Developmental
Turkish Mathematics 122 111.52
3 3.13 0.37 Science Mathematics 15 117.57
Social Sciences 72 127.69
Others (Vocational) 23 107.20
Parsimonious
Turkish Mathematics 122 115.59
3 0.07 0.99 Science Mathematics 15 119.80
Social Sciences 72 117.51
Others (Vocational) 23 116.04
Testable
Turkish Mathematics 122 111.56
3 3.08 0.37 Science Mathematics 15 107.40
Social Sciences 72 127.86
Others (Vocational) 23 113.07
Unified
Turkish Mathematics 122 114.69
3 0.94 0.81 Science Mathematics 15 117.33
Social Sciences 72 122.04
Others (Vocational) 23 108.20
As shown in Table 10 there is no statistically difference among prospective teachers’ NSKS views due to High school department variable.
Descriptive statistics of prospective teachers’ interests in science and scientific studies are presented in Table 11.
Table 11: Prospective Teachers’ State of Following Science and Scientific Studies n %
State of following science and scientific studies Interested 59 25.4 Not interested 173 74.6
Total 232 100
Descriptive statistics are shown in Table 12a, 12b, 12c related to prospective teachers’ states of following developments in their field.
Table 12a: Prospective Teachers’ States of Following Developments in Their Field
n %
State of following developments in sports and physical education
Follow 147 36.6
Not follow 85 63.4
Total 232 100
As it is seen in Table 12a while 147 of prospective teachers (36.6%) are interested in developments in physical education and sports, 85 of them (63.4%) express that they do not follow the developments in physical education and sports.
Table 12b: Number of Sources Prospective Teachers Who Follow
the Developments in Their Field
n %
Sources to follow the developments
One source followers 73 49.7
More than one source followers 74 50.3
Total 147 100
According to Table 12b 73 of prospective teachers (49.7%) follow the developments through a source, 74 (50.3) of them say that they follow more than one source to catch up with the developments.
Table 12c: Sources Used By Prospective Teachers to Follow
the Developments in Their Own Field
n %
Sources to follow the developments in physical ed. and sports
Academic publishing 10 6.7
Federations 2 1.3
İnternet 70 46. 7
course, Seminar, Conference 2 1.3
Visual Media 23 15.3
Social Media 19 12.7
Printed Media 24 16.0
Total 150 100
5. Discussion and Conclusion
Physical education prospective teachers are moderately indecisive in terms of nature of scientific knowledge. Exactly like the whole scale, prospective teachers are indecisive towards the nature of scientific knowledge according to the subscales. Prospective physical education teachers’ being indecisive to nature of science can be associated with low ratio of taking science courses. In literature review, similar studies can be seen with similar results (Kılıç, Sungur, Çakıroğlu, Tekkaya, 2005; Abd-El-Khalick & Lederman, 2000).
Prospective teachers have not studied nature of science at university and also it is seen that they have only studied science philosophy at high school as not a unique course but as a unit of curriculum. Thereby it is not unexpected that they are indecisive about nature of science.
In contrast to our findings, Güneş (2010) found out that science and social science teachers are more decisive and have positive attitudes towards the nature of science more than moderate level. It has been ascertained that there is no difference among the prospective teachers’ NOS notions according to the education program they follow. Yet, when Table 2 is analysed, it is seen that the students who attend physical education and sport teaching department have more positive attitude towards nature of science than prospective teachers studying pedagogical formation. No meaningful difference has been conducted according to whether prospective teachers have taken any similar courses except for vocational courses during their university education in terms of their NOS notions. Güneş (2010) has concluded similar findings with ours in terms of education programme. Education program doesn’t cause meaningful difference in whole aspect of the scale but only causes a difference in Parsimonious subscale.
When prospective teachers’ NOS notions are analysed in terms of gender difference it is concluded that there is no difference between male and female participants. The only subscale which causes a difference between male and female prospective teachers’ NOS notion is Developmental.
The findings show that male prospective teachers have higher level mean scores in Developmental subscale compared to female prospective teachers ( male=24.80> female=23.51). The difference between the scores show that statistically there
is a difference between female and male prospective teachers (p<0.05). In a similar study, it is seen that gender variable doesn’t cause a difference in whole aspect of the scale but it causes a difference in Unified subscale (Güneş, 2010).
When physical education prospective teachers’ NOS notions are analysed according to grade level variable, it has been concluded that there is no difference among the participants’ NOS notions. Yet according to the unified subscale, 2nd grade
students ( =25.96) have relatively more positive attitudes towards nature of science compared to 1st grade students ( =23.80), 4th grade students ( =23.75), and graduates
( =24.00).
Physical education prospective teachers’ interests in science and scientific studies the courses related to science they have attended previously, and the high school type they graduate from don’t cause meaningful difference in their NOS notions.
Prospective teachers’ following scientific developments in their field causes a difference only in unified subscale for the sake of ones who follow.
When physical education prospective teachers’ graduation high school are analysed it seen that there are differences in testability and unified subscales. Vocational high school graduates relatively lower scores in nature of science perception according to testability subscale compared to senior high school, sports and fine art high school graduates. Similarly vocational high school graduates have relatively lower scores in their nature of science perceptions according to unified subscale compared to science, social sciences, Anatolian, sport and fine art high school graduates. Also it is observed that senior high school graduates relatively lower scores in their nature of science perceptions compared to sports and fine arts high school graduates.
While 74.6% of physical education prospective teachers don’t deal with science and scientific studies it is seen that 63.4% of them don’t follow the developments in their teaching field. While 50.3% of physical education prospective teachers follow the developments through more than one source, 49.7% of them only follow one source about field developments. While participants assert that they follow the developments mostly through internet (46.7%), 16.05% of them follow the developments through printed media, 15.3 of them follow through mass media, 12.75 of them follow through social media, 6.7% of them follow through academic journals, 1.3% of them follow through seminars, courses and conferences and 1.35% of them follow through federation. Most of the physical education prospective teachers are not interested in science and scientific studies. Moreover, they don’t follow the developments in their professional teaching fields.
5.1 Suggestions
Teachers’ adoption of a modern education understanding has a significant role to achieve educational goals in terms of the methods and applications selections. Therefore, teachers who have no knowledge beforehand should adopt a modern understanding of science as researchers, trainers and scientists. They should deal with their studies in accordance with this principle.
science, scientific studies, and especially with the developments in their professional field.
References
Abd-El-Khalick, F., & Lederman, N.G. (2000), “Improving science teachers’ conceptions of the nature of science: A critical review of the literature”. International Journal of Science Education, 22, 665–701
Açıkada, C., Ergen, E. (1990). Bilim ve Spor. Ankara: Büro-tek ofset Matbaacılık.
Aslan, O. (2009). Fen ve Teknoloji Öğretmenlerinin Bilimin Doğası Hakkındaki Görüşleri ve Bu Görüşlerin Sınıf Uygulamalarına Yansımaları. Doktora Tezi. Gazi Üniversitesi, Eğitim Bilimleri Enstitüsü, İlköğretim Anabilimdalı. Ankara. Beşli, B., (2008). Fen Bilgisi Öğretmen Adaylarının Bilim Tarihinden Kesitler
İncelemelerinin Bilimin Doğası Hakkındaki Görüşlerine Etkisi. Yüksek Lisans Tezi. Abant İzzet Baysal Üniversitesi, Sosyal Bilimler Enstitüsü, Bolu.
Çakıcı, Y. (2009). Fen Eğitiminde Bir Önkoşul: Bilimin Doğasını Anlama. M.Ü. Atatürk Eğitim Fakültesi Eğitim Bilimleri Dergisi (29), 57-74.
Çepni, S. (2005). Bilim, Fen, Teknoloji ve Eğitim Programlarına Yansımaları. Kuramdan Uygulamaya Fen ve Teknoloji Öğretimi. Çepni, S. (Ed). Ankara: Pegem A Yayıncılık.
Çilingir, L., Aslan, O., Çabanoğlu, E. O., Balcı, F., Sağlam, Y., Nuhoğlu, H.,Aydın, F., Afacan, Ö., Taşdemir, A. ve Hacıeminoğlu, E. (2013). Bilimin Doğası ve Öğretimi. (M. Demirbaş, Dü.) Pegem Akademi.Ankara
Çöndü, A. (1999). Beden Eğitimi ve Sporda Özel Öğretim Yöntemleri. Nobel Yayınları. Ankara
Driver, R., Leach, J., & Millar, R. (1996). Young People’s Images of Science. Mc Graw-Hill Education (UK)
Duverger, M. (1996). Introduction to Social Science. Bilgi Publishing Company, Istanbul Güneş, G., (2010). Öğretmen Adaylarının Temel Astronomi Konularında Bilgi Seviyeleri
İle Bilimin Doğası Ve Astronomi Özyeterlilikleri Arasındaki İlişkinin İncelenmesi. Yüksek Lisans Tezi. Çukurova Üniversitesi, Sosyal Bilimler Enstitüsü, Adana
Karasar, N. (1999). Bilimsel Araştırma Yöntemi. Anı Yayıncılık,Ankara
Kılıç, K., Sungur, S., Çakıroğlu, J., ve Tekkaya, C. (2005). Ninth grade students' Understanding of the nature of scientific knowledge. Hacettepe Üniversitesi Eğitim Fakültesi Dergisi(28), 127-133.
Kuru, E., (2000). Sporda Psikoloj: Sporun İlgilendiren Psikolojik Temel Kavramlar. Gazi Kitabevi,Ankara
Mumcu, H.E., & Çeviker, A. (2018). Investigation of the England and Turkey Amputee Football Teams' success by Several Factors. Sport & Society/Sport Si Societate, 18(1).
Özbek, A., Taşkıran, Y., Meriç, B., Bayazıt, B., v.d. (2004). Spor Bilimlerine Giriş: Spor Multidisipliner Bir Bilim. Yayıncı Yayınları,İstanbul
Rubba, P.A., Andersen, H.O. (1978). Development of an instrument to assess secondary school students understanding of the nature of scientific knowledge.
Science Education 62, 449–458.
Sekeroglu, M.Ö. (2017). Study of the Concepts of Athletic Identity and Continuous Sport Self-Confidence in the Light of Various Variables. Journal of Education and Training Studies, 5(13), 44-51.
Semerci, Ç. (2002). Türk Üniversitelerinde Beden Eğitimi ve Spor Bölümü Öğrencilerinin Okuma Alışkanlıkları. Eğitim ve Bilim (27), 125 (36-43).
Türkmen, L., Yalçın, M. (2001). Bilimin Doğası ve Eğitimdeki Önemi. Afyon Kocatepe Üniversitesi Sosyal Bilimler Dergisi, 3(1), 189-195.
http://www.tdk.gov.tr/index.php?option=com_bts&arama=kelime&guid=TDK.G
Creative Commons licensing terms