MEMBRANE SENSORS FOR STATIC AND HYDRODYNAMIC
POTENTIOMETRIC ASSESSMENT OF CETIRIZINE DRUG IN
PHARMACEUTICAL FORMULATIONS
Saad S. M. Hassan
[a]*, Ayman H. Kamel
[a]*, Heba Abd El-Naby
[a]Keywords: Cetirizine; Potentiometric sensors; Flow injection; Pharmaceutical analysis
The construction and electrochemical response characteristics of poly(vinyl chloride) (PVC) membrane sensors for the determination of cetirizine drug were described. These sensors were based on the use of the ion-association complexes of the cetirizinium cation (Cet+) with
phosphomolybdic acid [H3Mo12O40] (PMA) (sensor I), tetraphenylborate (TPB) (sensor II) and ammonium reineckate
(NH4)2[Cr(NCS)4(NH3)2](sensor III) counter anions as ion-exchange sites in a PVC matrix plasticized with dioctylphthalate (DOP). The
sensors revealed fast, stable and Nernstian response between 9.0x10⁻⁷ - 1.0x10⁻³ mol L-1 and 5.2x10⁻⁶ - 1.0x10⁻³ mol L-1 with slope of
59.3±0.2, 60.6±0.3 and 61.5±0.2 mV and dection limits 5.3x10⁻⁷, 3.8x10⁻⁶ and 5.2x10⁻⁶ mol L-1 for sensor I, II and III respectively. The
intrinsic characteristics of the detectors in a low dispersion manifold under hydrodynamic mode of operation are determined and compared with data obtained under batch mode of operation. Validation of the method reveals good performance characteristics including long life span, good selectivity for Cet+ over a wide variety of other organic compounds, long term stability, high reproducibility, fast response, low
detection limit, wide measurement range, acceptable accuracy and precision. Applications of the sensors for the determination of Cet+ in
pharmaceutical samples were also reported. The sensors offered several advantages over many of those previously described and were amenable for quality control/quality assurance assessment of the homogeneity, stability and purity of ephedrine drug tablets.
*Corresponding Authors Tel.: + 201222162766.
E-mail address: [email protected] (S.S.M.Hassan)
Tel.: +201000743328
E-mail address: [email protected] (A. H. Kamel) [a] Chemistry Department, Faculty of Science, Ain Shams
University, Abbasia, Cairo, Egypt
Introduction
Cetirizine drug is considered as a member of the second generation antihistamines and used for the symptomatic relief of hypersensitivity reactions including rhinitis and chronic urticaria.1,2 Its H1-antagonistactivity is primarily due to its R- enantiomer, levocetirizine which can be considered as the third-generation non-sedative antihistamine, developed from the second-generation antihistamine cetirizine. Chemically, levocetirizine is the active enantiomer of cetirizine, in which it works by blocking histamine receptors.3 It is also reduces asthma attacks in children by 70%4, and slightly crosses the blood-brain barrier only, eliminating the sedative side-effect common with older antihistamines; however it still causes mild drowsiness 5. Several analytical techniques have been reported for the determination of cetirizine which include liquid chromarography6-10, gas chromarography,11 spectrophotometry,12-14 capillary electrophoresis15 and voltammetry.16 Most of these methods, however, utilize expensive instrumentation, suffer from lack of selectivity, involve careful control of the reaction conditions or derivatization reactions, and require time-consuming pretreatment steps which affect their usefulness for routine analysis. On the other hand, application of potentiometric sensors in the field of pharmaceutical and biomedical analysis have been advocated.17-19 The approach provides simple, fast, and selective technique for various drugs.20,21
Some potentiometric sensors for assessment of cetirizine were reported.22-24 Advantages and limitations of these sensors for cetirizine were presented in Table 1.
The present work describes preparation, characterization and application of three potentiometric tubular membrane sensors for static and continuous monitoring of cetirizine in pharmaceutical preparations. The sensors exhibit high accuracy, high analytical throughput and good response stability with short measurement time, low limit of detection and high selectivity in the presence of many interferents.
Experimental
Equipments
Potentiometric measurements were performed at 25±1oC with an Orion digital pH/mV meter (model SA 720) using cetirizine PVC membrane sensors in conjunction with an Orion Ag/AgCl double junction reference electrode (model 90-02) filled with 10% (m/v) KNO3 solution in the outer compartment and Ross glass pH combination electrode (Orion 81-02) was used for pH measurements. The potentials were measured for stirred solutions using the following electrochemical cell Ag/AgCl/10-3 mol L-1 Cet+/membrane/sample test solution/Ag/AgCl double junction reference electrode.
Materials and methods
PVC, tetrahydrofuran (THF) were obtained from Aldrich. Dioctylphthalate (DOP) and sodium tetraphenyl borate (Na-TPB) were obtained from Fluka (Ronkonoma, NY). Phosphomolybdic acid and ammonium reineckate were obtained from Sigma Chemical Co. (St. Louis, MO). Pure grade of cetirizine dihydrochloride was supplied by Drug Control Authority, Al-Haram, Giza, Egypt. A 10-2 mol L-1 stock solution of the drug was freshly prepared by dissolving 0.461 g in 100 mL acetate buffer (0.05 mol L-1) of pH 4.2. Working solutions (10-5- 10-3 mol L-1) were prepared by accurate dilutions.
Sensor preparation and EMF measurements
The ion-exchangers of cetirizinium phosphomolybdate (Cet/PMA) (sensor I), cetirizinium tetraphenylborate (Cet/TPB) (sensor II) and cetirizinium reineckate (Cet/Ren) (sensor III) were prepared by mixing equal volumes of 10-2 mol L-1 cetirizine dihydrochloride with 10-1 mol L-1 phosphomolybdic acid, sodium tetraphenylporate and ammonium renickate, respectively. The precipitate of each ion pair was then filtered, washed thoroughly with double distilled water, dried at room temperature for 24 hour.
The sensors prepared by dissolving 10 mg of each ion-associate with 350 mg of the plasticizer DOP and 190 mg PVC in ca. 4 mL tetrahydrofuran (THF). The solution mixture was poured into a 5 cm Petri-dish. All membrane solutions were left to stand overnight at room temperature to evaporate the solvent slowly. The resulting membrane was peeled off from thePetri-dish and discs of 9 mm i.d were cut out and glued onto a7-mm i.d PVC body using THF. The tube was filled with 10-2 mol L-1 Cet+ as internal solution and 3mm diameter Ag/AgCl coated wire was used as an internal reference electrode. The electrodes were constructed in the conventional mode by the general procedure previously described.25-26 The sensors were conditioned by soaking in a 10-2 mol L-1 aqueous Cet+ solution for at least 3 hr before use and were stored in distilled water between measurements. They were calibrated by immersion with an Ag/AgCl double junction reference electrode into a 25 mL beaker containing 10 mL of 0.05 mol L-1 acetate buffer solution of pH 4.2. Portions (0.5-1.0 mL) of 10-5-10-2 mol L -1 standard Cet+ solutions were successively added and the potential response of stirred solutions was measured after stabilization to ±0.2 mV. A calibration was constructed by plotting the EMF reading against the logarithm of Cet+ concentrations. The plot was used for subsequent determination of unknown cetirizine drug.
Flow injection setup and measurements
The flow injection analysis (FIA) system manifold consisted of a two-channel Ismatech MS-REGLO model peristaltic pump. The manifold was connected with polyethylene tubing (Tygon, 0.7 mm i.d.) and an Omnifit injection valve (Rheodyne, Model 7125) with sample loop of 500 μL volume. A carrier solution consists of 0.05mol L -1 acetate buffer of pH 4.2 was propelled by means of a peristaltic pump through PTEE tubing (1.13 mm i.d.). The length of the tubing from the injection valve to the sensing cell was 35 cm. A tubular detector was constructed as described previously.27 The coating solution was prepared by thoroughly shaken 10 mg of the ion pair with 350 mg
DOP plasticizer and mixed with 190 mg PVC powder and 6 ml THF. This cocktail was deposited, using a micro dropper, three to four times in a hole (3 mm wide×5 mm length) made in the middle of a 15 cm Tygon tube (ALKEM, P/N A003494 red/red 0.071 i.d.). The tube was inserted and sealed with Araldite in 100 µL pipette tip (7 cm long, 0.4 cm diameter).
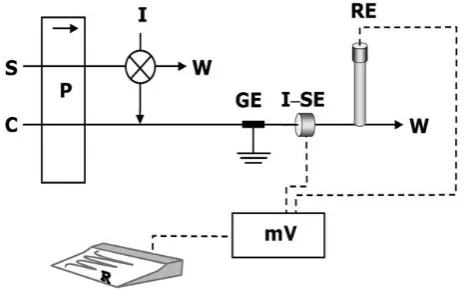
Figure 1. Schematic diagram of the flow injection system. P:
peristaltic pump, S: sample, C: buffer solution carrier, I:injection valve, GE: grounding electrode, ISE: Cetirizine selective electrode, RE: reference electrode, W:waste, mV: deci/milli-voltameter, R:data acquisition system connected to a computer
The tubular sensor was inserted into the flow injection system as schematically shown in Fig. 1. The end of the tube was placed in a Petri dish where a double junction Ag/AgCl reference electrode was placed downstream from the indicator sensor just before the solution went to waste. The sample loop (500 μL) of the injection valve was filled and the valve was rotated to allow the sample to be carried out by 0.05 mol L-1 acetate buffer stream (pH 4.2) to the flow – through cell by a flow rate 6.5 mL min-1. The potential signals were recorded using an Orion pH/mV meter (model SA 720) connected to a PC through the interface ADC 16 (Pico Technology, UK) and PicoLog for windows (version 5.07) software. The average peak height of 3 replicate runs on each sample was measured and compared with a calibration plot under the same condition.
Analytical application
Potentiometric analysis was conducted on oral dosage forms of pharmaceutical preparations, commercially designated as Cetrak syrup (Pharco. pharm.co. Alex.), Alerid syrup (Global Napi pharm. Co., Egypt) and Zyrtec drop (Glaxosmithkline.pharm.co., Egypt). Portions of (0.01-11.5) mL aliquot of the pure sample was diluted with 0.05 mol L-1 acetate solution of pH 4.2 in 25 mL measuring flask. For drug measurements, a 10 mL aliquot of the drug solution was potentiometrically measured.
Results and discussion
Characterization of cetirizine ion–pair complexes
cetirizinum-tetraphenylborate [Cet][TPB] and cetirizinium-reineckate [Cet][Ren] ion associate complexes. The precipitates were isolated and characterized by elemental analysis.
The elemental analysis obtained for the solid complex agree fairly well with the formula 2:1 of Cet:PMA (Calculated, C: 19.36%, H: 2.303%, N: 2.529%, found, C:19.1%, H: 2.304%, N:2.52%), 1:1 of Cet:TPB (Calculated, C: 76.15%, H: 6.48%, N: 3.95 % found, C: 76.27%, H: 5.87%, N: 4.01 %) and with the formula 1:1 of Cet:Reineckate (Calculated, C:41.28%, H: 4.82%, N: 15.41% found, C: 41.15%, H: 4.84%, N: 15.78%).
Response characteristics of the electrode system
The electrochemical response characteristics of [Cet]2[PM], [Cet][TPB] and [Cet][Ren] PVC membrane sensors were evaluated according to IUPAC recommendations.28
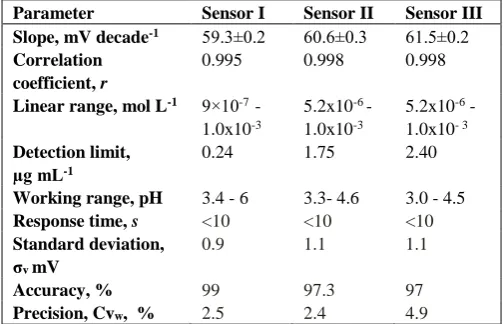
The composition of the sensors was 33% PVC the plastic matrix, 66% DOP the solvent mediator and 2% of the ion pair. The calibration graphs were liner over the concentration rang 9.0x10⁻⁷ - 1.0x10⁻³, 5.2x10⁻⁶ – 1.0x10⁻³ and 5.1x10⁻⁶ – 1.0 x10⁻³ mol L-1 with slopes 59.3±0.2, 60.6±0.3 and 61.5±0.2 mV decade-1 and detection limits 5.3x10⁻⁷, 3.8x10⁻⁶ and 5.2x10⁻⁶ mol L-1for sensors I, II and III, respectively. The potentiometric response characteristics of the electrodes assembled with the different membranes
are shown in Fig. 2. The validity of the proposed potentiometric method for determining cetirizine was assessed by measuring the range, lower limit of detection (LOD), accuracy (recovery), precision or repeatability (CVw), between-day variability (CVb), linearity (correlation coefficient) and sensitivity (slope).27 Data obtained with six batches (six determinations each) of Cet+ solutions are shown in Table 2.
The accuracy (trueness) and precision (relative standard deviation, RSD) of the results obtained by sensors I and II were calculated according to equations 1 and 2.29
where: x, µ and SD are the average measured concentration found, reference-value and standard deviation, respectively. The results obtained are given in Table 1.
Effect of pH and response time
The influence of pH on the potentiometric response of the proposed sensors was examined with standard 10-4 and 10-3 mol L-1 Cet+ solutions over a pH range of 2–9. The pH of
Table1. General performance characteristics of some potentiometric cetirizine sensors.
Ref. Interferents
Response time, s pH
range Detection
limit,
µgmL-1
Linear Range,
mol L-1
Slope
mV decade-1
Sensor
[22] Maltose (-2.7), Lactose (-2.6), Starch (-2.5), K+(-2.5), Li+(-2.5)
<10 1.5–2.8
14.6 3.16x10⁻⁵
-3.1x10⁻³
66.8
Cet./TPB coated wire
[23]
[23] Vitamin
C(-1.1),Glucose(-2.1), Histidine(-2.1)
Vitamin C (1.6),Glucose (-2.1), Histidine (-2.2) 10
10 2 – 4
2 – 4 2.3
3.2 5.0x10⁻⁶
-1.0x10⁻¹
5.0x10⁻⁶
-1.0x10⁻¹
60.2
57.4
β-cyclodextrin PVC electrode
β-cyclodextrin carbon paste electrode
[24] Hydroxyzine (-2.2),
Piperazine (-3.2), Triethylamine (-3.3) 20
1.9 – 4.5 0.32
1x10⁻⁶-
1x10⁻²
28.0
Molecularly imprinted polymer (MIP)
This work This work
This work Quinine(-1.2),Caffeine
(-2.2),Epthedrine (-1.5) Quinine(-1.8), Caffeine (-2.5), Epthedrine (-1.4),
Quinine(-1.6), Caffeine (-2.2), Epthedrine (-1.6) 10
10
10 3.4 - 6.0
3.3 – 4.6
3.0 -4.5 0.24
1.7
2.4 9.0x10⁻⁷
-1.0x10⁻³
5.2x10⁻⁶ -
1.0x10⁻³
5.2x10⁻⁶ -
1.0x10⁻³
59.3
60.57
61.5
Cet./PMA
Cet./TPB
Cet./Ren
Accuracy, % 100 (1)
Precision, % 100 (2)
x
SD
x
Figure 2. Potentiometric response of cetirizine membrane based sensors plasticized in DOP.
the solution was adjusted with either hydrochloric acid and/or sodium hydroxide solutions. It was apparent that sensor I revealed good stability with pH range 3.4 - 6.0 but sensor II, III revealed good stability with pH range 3.3 – 4.6, 3.0 – 4.5 respectively. The potentials of all sensors considerably declined with negative drift at higher pH values due to progressive precipitation of the free cetirizine base. One of the important features of electrochemical sensor is the response time which can be evaluated by measuring the time required to achieve a steady-state potential with in ±0.2 mV of the final equilibrium value after successive immersion in a series of Cet+ solution, each have a10 fold difference from low to high concentrations . The response time was < 10 s for all cetirizine solutions in the linear range of calibration curves indicating fast response to these sensors. After several calibrations for each sensor, low potential drift, long-term stability and negligible change in sensors response were observed. When not in use, the sensors were stored and conditioned in 10-3 mol L-1 Cet+. For all sensors examined, the detection limits, response times, linear range and calibration slopes were reproducible within ±3% of their original values over a period of at least 8 weeks.
Selectivity
The selectivity is the most important characteristic of any sensor, which defines the extent to which it may be used to estimate the particular ionic species in real samples to be selective over all the other ions likely to be present in actual samples along with determined species. Selectivity coefficients of the sensors were determined using the
separate solution method (SSM) and static mode of measurements 28, determined at 1.0x10⁻³ mol L-1 concentration of both Cet+ and the interfering species in 0.05 mol L-1 acetate buffer of pH 4.2, are listed in Table 3. The selectivity order for these sensors were Cet+> Quinine> Ephedrine> fexofenadine > K+>Histidine> Caffeine= Glutamine >Ba2+ (sensor I), Cet+> Ephedrine> Quinine> Fexofenadine = Histidine > Glutamine > Caffiene >K+> Ba2+ (sensor II), Cet+> Quinine> Ephedrine > Fexofenadine > Histidine> Glutamine > Caffeine > K+> Ba2+ (sensor III). The results show, on the one hand, reasonable selectivity by all membranes for Cet+ compared with many other common inorganic and organic cations and on the other hand, slightly better selectivity by sensor II over sensors I and III especially for quinine, caffeine and fexofenadine. For the effect of ephedrine on the response of the sensors, sensor III exhibit better selectivity than sensors I and II.
Hydrodynamic monitoring of cetirizine
For continuous cetirizinium measurements, a tubular-type
detector incorporating a Cet/PMA, Cet/TPB and Cet/Ren based membrane sensors were prepared and used under hydrodynamic mode of operation for continuous Cet+ quantification.
Table 2. Potentiometric response characteristics of cetirizine
membrane based sensors.
Table 3. Selectivity coefficient values for cetirizine selective
electrodes as calculated by separate solution method
Table 4. Potentiometric response characteristics of cetirizine
membrane sensors based on Cet/PMA, Cet/TPB and Cet/Rein ion pairs using FI operation
Parameter Sensor I Sensor II Sensor III
Slope, mV decade-1 59.3±0.2 60.6±0.3 61.5±0.2
Correlation coefficient, r
0.995 0.998 0.998
Linear range, mol L-1 9×10⁻⁷ -
1.0x10⁻³
5.2x10⁻⁶ -
1.0x10⁻³
5.2x10⁻⁶ -
1.0x10- 3
Detection limit,
µg mL-1
0.24 1.75 2.40
Working range, pH 3.4 - 6 3.3- 4.6 3.0 - 4.5
Response time, s <10 <10 <10
Standard deviation, σv mV
0.9 1.1 1.1
Accuracy, % 99 97.3 97
Precision, Cvw, % 2.5 2.4 4.9
lg K pot
Cet, J Interferent
Sensor III Sensor II
Sensor I
0 0
0
Cetirizine
-1.6 -1.8
-1.2
Quinine
-2.2 -2.5
-2.2
Caffeine
-1.6 -1.4
-1.5
Ephedrine
-2.0 -2.0
-2.1
Histidine
-2.1 -2.2
-2.2
Glutamine
-1.9 -2.0
-1.8
Fexofenadine
-2.4 -3
-2.1
K+
-3.5 -4.2
-4
Ba+2
-7 -6 -5 -4 -3
-150 -100 -50 0 50 100
E,mV
log[Cet+
],mol L-1
Parameter Sensor I Sensor II Sensor III
Slope, mV decade-1 65.6±0.6 66.6±0.4 40.9±0.8
Correlation
coefficient, r 0.990 0.977 0.986
Detection limit, mol 1.6x10⁻⁵ 6.3x10⁻⁵ 5.0x10⁻⁵
L-1
Flow rate, ml min-1 6.5 6.5 6.5
Carrier acetate
buffer (pH) 4.2 4.2 4.2
Sample rate, h-1 20-22 28-30 25-28
Table 5.Static determination of cetirizine in some pharmaceutical formulations using the proposed sensors.
Table 6
.
Hydrodynamic determination of cetirizin in some pharmaceutical formulations using the proposed sensors.Pharmaceutical Product and source
Nominal content taken
(mg mL-1)
Sensor I Sensor II Sensor III
Found
(mg mL-1)
Recovery %
Found
(mg mL-1)
Recovery %
Found
(mg mL-1)
Recovery % Cetrak(syrup)
Pharco.pharm.co.,Alex. 1.0 0.96 96.0 ±0.5 0.90 90.0 ±1.0 1.01 101 ±0.9
Alerid(syrup), Global napi
pharm. Co. Egypt 1.0 0.90 90.0 ±0.8 0.96 96 ±0.6 0.84 84.0 ±1.2
Zyrtec(drops),
Glaxosmith-kline Pharm.co., Egypt 10.0 10.50 105 ±0.4
9.12 91.2 ±0.9
10.80 108 ±0.7
Sample
Sensor I Sensor II Sensor III
Nominal
contenta
(µg mL-1) Found (µg mL-1)
Recovery, %
Nominal
contenta
(µg mL-1)
Found,
µg mL-1
Recovery, %
Nominal contenta,
µg mL-1
Found
µg mL-1
Recovery, %
Cetrak (syrup), Pharco. Pharm. Co. Alex.
C1 46 47 102.0 46 50 108.7 50 47 94.0
C2 460 470 102 460 410 89.1 461 371 80.4
Alerid(syrup) Global Napi Pharm. Co.Egypt
A1 46 44 895.6 4.62 4.56 98.7 50 54 108.0
A2 460 470 102 460 432 93.9 460 480 104.3
Zyrtec(drops), Glaxosmithkline.Ph arm. Co., Egypt
Z1 90 80 88.8 4.6 4.1 89.0 92 92 100.0
Z2 460 490 106.5 460 430 93.5 460 510 110.0
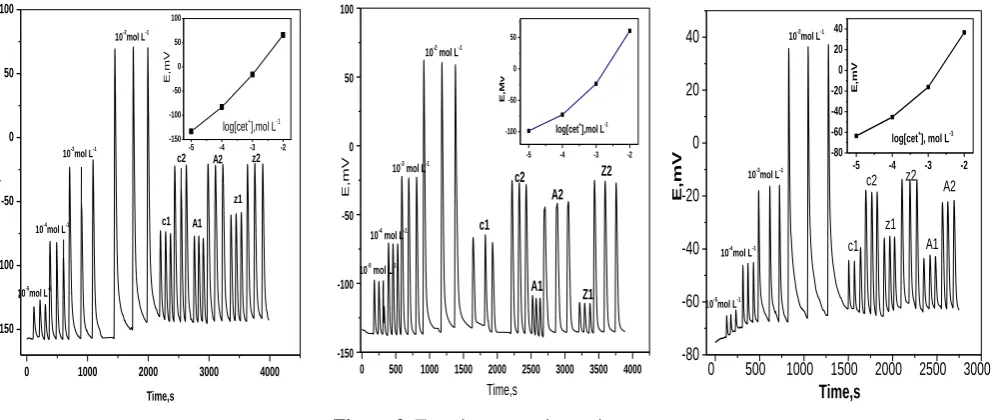
Figure 3. Transient potentiometric
signals obtained in triplicate for: (a) Cet/PMA, (b) Cet/TPB and (c) Cet/Ren membrane based sensor. Conditions: carrier solution, 0.05 mol L−1 acetate buffer pH 4.2 flow rate, 6.5.mLmin−1; sample volume, 500µL
A sample loop (500 µL) for cetirizine solution ranging from 1.0 × 10⁻⁵ to 1.0 × 10⁻² mol L-1 at pH 4.2 with a 0.05 mol L-1 acetate carrier buffer, flow rate 6.5 mL min-1 was chosen to study the potentiometric response (slope in mV decade-1) of the proposed sensors. Main analytical features recorded under optimum flow conditions were presented in Table 4. The Sensors gave slopes of 65.6±0.6, 66.6±0.4 and 40.9±0.8 mV decade-1 with detection limits of 1.6x10⁻⁵, 6.3x10⁻⁵ and 5.0x10⁻⁵ mol L−1 and sampling rate 20-22, 28-30 and 25-28 sample h-1, for sensors I, II and III, respectively. Typical FI-diagrams for the sensors are shown in Fig. 3.
Assessment of cetirizine in Dosage forms
A number of pharmaceutical additives and diluents commonly used in drug formulations have been examined for their effect on the assay method. Amount of sucrose, glucose, lactose, starch and magnesium stearate in far greater excess than normally found in pharmaceutical preparations were added to both Cet+ and the blank. No interferences were noticed.
The contents of cetirizine in various dosage forms were determined with all proposed sensors by both batch and flow injection systems. The results are shown in both Tables 5 and 6. The determinations were made on various types of samples, prepared as described before. The mean results obtained with the proposed sensor on several independent preparations (n=5) which show an average recovery of 97.0% for sensor I, 92.4% for sensor II and 97.6% for sensor III with a mean standard deviation of ±1.5%, ±2.2% and ±1.9%. No interference was caused by active or inactive ingredients and diluents commonly used in drug formulation. Results obtained for determination of cetirizine in some pharmaceutical preparations by FIA show an average recovery of 99.4%, 87.7% and 92.9% with a mean standard deviation of ±2.4%, ±2.2% and± 1.7% for sensors I, II and III, respectively (Table 6).
Conclusions
A fast and simple potentiometric method is used for determination of cetirizine under static (manual) and hydrodynamic (FIA) mode of operations. The potentiometric detection system facilitated the determination of cetirizine with high sampling rates, and a low consumption of sample volume. Tubular membrane sensors are incorporated in flow-through cells and used as detectors for flow injection analysis (FIA) of cetirizine. The electrode methods are more precise and not liable to interferences by the active ingredients, excipients and diluents commonly used in cetirizine drug formation.
References
1The Merck Index Merck research Laboratories. 13th edition, 2001,
Martindale J.O’Neil, Merck & Co., Inc., White house Station, NJ. USA. 6281 and 2030.
2Martindale, The Extra Pharmacopoeia, The Pharmaceutical Press,
London, Ed: J.E.F. Renynolds, 1997.
3Tillement, J. P., Testa, B., Brée, F., Biochem. Pharmacol., 2003,
66, 1123.
4Pasquali, M., Baiardini, I., Rogkakou, A., Riccio, A. M.,
Gamalero, C., Descalzi, D., Folli, C., Passalacqua. G., Clin. & Experim. Aller., 2006, 36, 1161.
5Gupta, A., Chatelain, P., Massingham, R., Jonsson, E. N.,
Hammarlund-Udenaes, M., Drug Metab. Dispos., 2006, 34, 318.
6Dharuman, J., Vasudhevan, M., Ajithlal, T., J. Chromatog. B,
2011,879, 2624.
7Karakus, S., Kucukguzel, I., Kucukguzel,S. G., J. Pharm. &
Biomed. Anal.,2008 ,46, 295 .
8Hadad, G. M., Emara, S., Mahmoud,W. M. M., Talanta,2009, 79,
1360.
0 1000 2000 3000 4000
-150 -100 -50 0 50 100
-5 -4 -3 -2 -150 -100 -50 0 50 100 z2 z1 A2 A1 c2 c1 10-2
mol L-1
10-3mol L-1
10-4 mol L-1
10-5 mol L-1
E ,m V Time,s E ,m V
log[cet+],mol L-1
-5 -4 -3 -2 -100
-50 0 50
0 500 1000 1500 2000 2500 3000 3500 4000 -150 -100 -50 0 50 100 E ,M v log[cet+ ],mol L-1
10-4 mol L-1 10-3
mol L-1 10-2
mol L-1
10-5 mol L-1
Z2 Z1 A2 A1 c2 c1 E,mV Time,s
0 500 1000 1500 2000 2500 3000
-80 -60 -40 -20 0 20 40
-5 -4 -3 -2
-80 -60 -40 -20 0 20 40 A2 A1 z2 z1 c2 c1 10-2 mol L-1
10-3 mol L-1
10-4 mol L-1
10-5 mol L-1
E,mV
Time,s
E
,m
V
9Kang, S. W., Jang, H. J., Moorea, V. S., Parkb, Ji, Kimb, K.,
Youmc, J., Hanc,S. B., J. Chromatog. B , 2010, 878, 3351.
10Morita , M. R., Berton, D., Boldin, R., Barros , F. A. P., Meurer ,
E. C., Amarante , A. R., Campos, D. R., Calafatti, S. A., Pereira, R., Abib Jr., E., , Pedrazolli Jr., J., J. Chromatog. B,
2008, 862, 132.
11Baltes, E., Coupez, R., Brouwers, L., Gobert, J., J. Chromatogr.
Biomed., 1988, 74, 149.
12Prabu, S. L., , Shirwaikar, A. A., Shirwaikar, A., Kumar, C. D., G.
A. Kumar, G. A., Indian J. Pharm. Sci., 2008, 70, 236 .
13Choudhari, V., Kale, A., Abnawe, S., Kuchekar, B., Gawli, V.,
Patil, N., J. Pharm. Tech. Res., 2010, 2, 4 .
14El Walily, A. F. M., Korany, M. A., El Gindy, A., Bedair, M. F.,
J. Pharm. & Biomed. Anal., 1998, 17, 435.
15Bajerski, L., de Silva Sangoi, M., Barth, T., Diefenbach, I. F.,
Simone Gonçalves Cardoso, S. L. D. E., Quim. Nova, 2010,
33, 114 .
16Patil, R. H., Hegde, R. N., Nandibewoor, S. T., J. Colloids and
Surfaces B: Bioint., 2011, 83, 133 .
17Kamel, A. H., J. Pharm. & Biomed. Anal., 2007, 45, 341. 18Hassan, S. S. M., Sayour, H. E. M., Kamel, A. H., Anal. Chim.
Acta, 2009, 640, 75.
19Kamel, A. H., Mahmoud, W. H., Mostafa, M. S., Anal. Meth. ,
2011, 957, 9 .
20Kamel, A. H., Mahmoud, W. H., Mostafa, M. S., Eur. Chem. Bull., 2013, 2, 88-93
21Hassan, S. S. M., Kamel, A. H.,Abd El-Naby, H.,Talanta,2013,
103 ,330–336.
22Shoukry, A. F., Abdel-Ghani, N. T., Issa, Y. M., Ahmed, H. M.,
Electroanalysis, 1998, 11, 443.
23Rizk, N. M. H., Abbas, S. S., EL-Sayed, F. A., Abo-Bakr, A., Int.
J. Electrochem. Sci.,2009, 4, 396 .
24Javanbakht, M., Eynollahi Fard, S., Abdouss, M., Mohammadi,
A., Ganjali, M. R., Norouzi, P., Safaraliee, L.,
Electroanalysis, 2008, 20, 2023.
25Abdel Aziz, A. A, Kamel, A. H., Talanta,2010, 80, 1356. 26Kamel, A. H., Mahmoud, W. H., Mostafa, M. S., Electroanalysis,
2010, 22, 2453 (2010)
27Kamel, A. H., Sayour, H. E. M., Electroanalysis2009, 21, 2701. 28Umezawa, Y., Buhlmann, P., Umezawa, K., Tohoda, K.,
Amemiya, S., Pure Appl. Chem., 2000, 72, 1851.
29Taylor, J. K., Quality Assurance of Chemical Measurements CRC
Press, Florida, 1987