Flow in linearly sheared two-dimensional foams: From bubble to bulk scale
Gijs Katgert, Andrzej Latka, Matthias E. Möbius, and Martin van Hecke
Kamerlingh Onnes Laboratory, Universiteit Leiden, Postbus 9504, 2300 RA Leiden, The Netherlands 共Received 31 March 2009; published 30 June 2009兲
We probe the flow of two-dimensional 共2D兲 foams, consisting of a monolayer of bubbles sandwiched between a liquid bath and glass plate, as a function of driving rate, packing fraction, and degree of disorder. First, we find that bidisperse, disordered foams exhibit strongly rate-dependent and inhomogeneous 共 shear-banded兲velocity profiles, while monodisperse ordered foams are also shear banded but essentially rate inde-pendent. Second, we adapt a simple model关E. Janiaud, D. Weaire, and S. Hutzler, Phys. Rev. Lett. 97, 038302 共2006兲兴 based on balancing the averaged drag forces between the bubbles and the top plateF¯bw and the averaged bubble-bubble drag forces F¯bb by assuming that F¯bw⬃v2/3 and F¯bb⬃共yv兲, where v and 共yv兲 denote average bubble velocities and gradients. This model captures the observed rate-dependent flows for
⬇0.36, and the rate independent flows for ⬇0.67. Third, we perform independent rheological measure-ments ofF¯bwandF¯bb, both for ordered and disordered systems, and find these to be fully consistent with the forms assumed in the simple model. Disorder thus leads to a modified effective exponent. Fourth, we vary the packing fractionof the foam over a substantial range and find that the flow profiles become increasingly shear banded when the foam is made wetter. Surprisingly, the model describes flow profiles and rate depen-dence over the whole range of packing fractions with the same power-law exponents—only a dimensionless number k that measures the ratio of the prefactors of the viscous drag laws is seen to vary with packing fraction. We find thatk⬃共−c兲−1, where
c⬇0.84 corresponds to the 2D jamming density, and suggest that this scaling follows from the geometry of the deformed facets between bubbles in contact. Overall, our work shows that the presence of disorder qualitatively changes the effective bubble-bubble drag forces and suggests a route to rationalize aspects of the ubiquitous Herschel-Bulkley 共power-law兲 rheology observed in a wide range of disordered materials.
DOI:10.1103/PhysRevE.79.066318 PACS number共s兲: 47.15.gm, 47.57.Bc, 83.50.Lh
I. INTRODUCTION
Foams, which are dispersions of densely packed gas bubbles in a liquid, exhibit an intricate mix of elastic, plastic, and viscous behavior reminiscents of the mechanics of other disordered materials such as colloidal suspensions, granular media, and emulsions 关1–6兴. When left unperturbed, foams jam into a metastable state where surface tension provides the restoring force underlying their elastic response for small strains 关1,4,7兴. Under continuous driving the foam starts to flow, and the viscous dissipation that arises in the thin fluid films that surround the gas bubbles becomes important. Mac-roscopically, the steady-state rheology of foams exhibits shear thinning, and the stressas function of strain rate␥˙ is generally nonlinear, often taking a Herschel-Bulkley form: =Y+c1␥˙, whereYdenotes the yield stress and where the viscous stress V⬅−Y scales nontrivially with the strain rate␥˙ 关1,3,8–14兴. In addition, in many situations, the flow is inhomogeneous and localizes in a shear band, which is lo-cated near one of the solid boundaries 关1,12,14–16兴.
In an earlier paper 关14兴 we experimentally probed the flow of disordered, bidisperse two-dimensional 共2D兲 foams which are trapped between the fluid phase and a top plate. The 2D nature allows for direct imaging of the bubble dy-namics and of the shear-banded flow profiles in this system. Combining measurements of the flow profiles with rheologi-cal measurements, we established that the viscous interac-tions between neighboring bubbles scale differently with ve-locity gradients than the effective viscous interactions at the global scale. We captured the rate-dependent shear banding
near the moving boundaries exhibited by our system in a nonlinear drag force balance model. Here we expand on these findings, discuss results for the effect of varying the wetness of the foam, and provide extensive additional evi-dence to support our main conclusions.
To understand the rheology and shear band formation in our system, three ingredients need to be described and com-bined appropriately: 共i兲 interactions with the top plate, 共ii兲 local bubble interactions, and共iii兲disorder.
A. Top plate
In recent years, a variety of studies has addressed the formation of shear bands in 共quasi-兲two-dimensional foams, consisting of a single layer of macroscopic bubbles. Such single layers can be made by freely floating the bubbles on the surface of a surfactant solution 共“bubble raft”兲 关12,17,18兴, by trapping them between a top glass plate and the surfactant solution 共“liquid-glass”兲 关14,18–21兴, or by trapping them between two parallel glass plates共Hele-Shaw cell兲 关15兴.
In a seminal paper by Debrégeaset al.关15兴, a bidisperse foam in Hele-Shaw Couette cell was sheared and narrow shear-banded flow profiles where obtained 关15兴. While ini-tially it was believed that for slow flows, the effect of the viscous drag forces exerted by the confining glass plates would be negligible关1,22兴, these drag forces have turned out to be crucial. First, Couette experiments found broad shear bands, which are well captured by a continuum description 关12兴. Second, in experiments where a monodisperse foam
was linearly sheared with and without confining glass plate on top 关18兴, one observes smooth velocity profiles for the bubble raft but highly shear-banded flows for the liquid-glass geometry. The precise connection between the drag forces due to the confining plates and the occurrence of shear band-ing in confined foams is still a subject of debate关22,23兴.
A simple continuum model that balances the top plate drags and the interbubble drags 共modeled with a Bingham constitutive relation兲captures both the rate independence and exponentially localized shear bands seen in the linear liquid-glass cell 关14,24兴—here we will build on and extend this model to capture the experimentally observed nonlinear rate-dependent rheology of disordered foams.
B. Local interactions
At the microscopic level, bubble interactions are a com-bination of elastic repulsion, typically harmonic for small deformations 关25–27兴, and nonlinear viscous drag forces 关13,14,28–32兴. Such drag forces arise when two bubbles slide past each other or when a bubble slides past a solid boundary. The viscous drag forces originate in the thin films that surround foam bubbles and have recently received re-newed attention关13,28–32兴. Already for a single bubble slid-ing past a solid wall, Bretherton showed that the drag force scales nonlinearly with the bubble velocity 关13,31,33兴, and by analogy one would expect the drag forces arising between sliding bubbles to be nonlinear also—indeed Denkovet al. 关32兴 recently suggested that a similar scaling applies to the viscous drag force between bubbles.
Here we measure the viscous drag forces between bubbles directly by rheological experiments where two rows of or-dered bubbles are sheared past each other.
C. Disorder
Foam flows are disordered and intermittent at the multi-bubble scale 关5,7,13,14,24,34,35兴. For such disordered sys-tems, the affine approach, where one simply scales up local elastic or viscous interactions, often fails to describe the macroscopic behavior—this is by now well established for shear deformations in granular and foamlike systems 关36–38兴, and a similar picture is emerging from simulations of the flow of viscous particles 关34,39–42兴. In the present work we present strong experimental evidence for the failure of the affine approach to describe共interbubble兲viscous drag forces in flowing systems.
II. OUTLINE
In this paper, we describe an experiment in which we have linearly sheared a 2D foam, and we disentangle the roles of the top plate, the local bubble interactions, and the disorder, as well as the role of the wetness of the foam.
In Sec.IIIwe describe our experimental setup. In Sec.IV we present experimental results for flow profiles for a range of strain rates and transverse widths of our system. We find that the flow depends crucially on the applied strain rate␥˙a: disordered bidisperse foams exhibit rate-dependent flow pro-files, which become increasingly shear banded for large ␥˙a.
We capture our findings in a model in which the time-averaged drag forces between bubble and top plate,F¯bw, and between neighboring bubbles F¯bb are balanced. While the continuum limit of our model is similar in spirit to关24兴, the crucial new ingredient is nonlinear scaling laws for the wall drag and the bulk stress—these nonlinear scalings are essen-tial for capturing the observed rate dependence.
In Sec. V, we probe the scaling of both bubble-wall and bubble-bubble drag forces by independent rheological mea-surements. When measuring the bubble-bubble drag forces we directly probe the role of disorder by comparing the rhe-ology of small ordered and larger disordered bubble rafts. We find the averaged drag forces in the disordered foam to scale differently from the local drag forces between individual bubbles, which we have measured at high resolution and analyze in a novel way.
In contrast, for monodisperse ordered foams the local, av-eraged, and top-plate drag forces all scale similarly, causing rate-independent flows similar to those seen by Wang et al. 关18兴, and we discuss these in Sec.VI.
In Sec. VIIwe further probe the connection between the viscous interbubble drag forces at the bubble scale and the bulk viscous forces by performing additional linear shear experiments over a range of packing 共air兲 fractions . We find that the contribution of averaged bubble-bubble drag forces vanishes algebraically as −c when the packing fraction is decreased toward a critical value c, which we identify with the 共un兲jamming density,c⬇0.84. We relate the vanishing of the averaged bubble-bubble drag forces at cto the vanishing overlap between bubbles at unjamming. The simple elastic interaction 共typically harmonic for small deformations关25–27兴兲and the absence of solid friction make static packings of foam bubbles eminently suited to compare to simulations of the popular soft frictionless sphere model 关37,43,44兴. Our work illustrates the great potential of foams to elucidate the flowbehavior of simple systems near jamming 关39–42兴.
III. EXPERIMENTAL DETAILS
In this section we describe in detail an experimental setup to induce linear shear flow in two-dimensional foams. We also detail the analysis techniques used to extract velocity profiles and discuss measurements which show that coarsen-ing and fluid drag can be neglected.
A. Setup
We create foam bubbles on the surface of a reservoir of soapy solution共of depth 3.5 cm兲, consisting of 80% by vol-ume demineralized water, 15% glycerol, and 5% Blue Dawn dishwashing agent 共Proctor & Gamble兲 and by bubbling ni-trogen through the solution via syringe needles of variable aperture. We measure the bath surface tension with the pendant drop method 关45兴 and find = 28⫾1 mN/m. We measure the dynamic viscosity with a Cannon Ubbelohde viscometer and find= 1.8⫾0.1 mPa s.
is leveled with the liquid surface and which supports glass top plates to which the bubbles bridge once they are in place. The top plates consist of three adjacent glass plates with slits to accommodate two polymethyl methacrylate 共PMMA兲 wheels of radius 195 mm and thickness 9.5 mm that drive the flow. The vertical gap between the liquid surface and the glass plates can be varied to control the packing fraction of bubbles.
The wheels, which are grooved to provide a no-slip boundary for the bubbles, can be lowered into and raised out of the bath through the slits. The wheels are connected to two Lin Engineering stepper motors, each driven by microstep-ping driver, and are rotated in opposite directions. At any point along the line where the wheels contact the foam bubbles the horizontal component of the driving velocity is a constant关see Fig.1共b兲兴.
We obtain our data from the central 60 mm of the shear-ing region—marked by the horizontal lines in Fig. 1共a兲—to avoid effects caused by the recirculation of the foam at the edges of the wheels. In this central part no motion is ob-served due to the vertical component of the radial velocity. At the edges of the slits, bubbles do leave the system while being pinned to the wheels. This does not result in holes in the foam layer, either because at high driving velocities the bubbles reenter the system before rupturing while traveling on the wheel or because at low velocities bubbles from out-side the shearing region are pushed inwards due to the bubble surplus at the edges. The resulting driving velocity gives rise to a global strain rate␥˙= 2v0/W, whereWdenotes the gap between the wheels, which we vary between 5 and 10 cm.
B. Imaging and analysis
We wish to characterize the average flow in the x direc-tion as a funcdirec-tion of the transverse coordinatey. The average velocity profiles are obtained from a series of images which we record with an 8 bit Foculus BW 432 charge coupled device共CCD兲camera共1280⫻1024 pixels兲equipped with a Tamron 28–300 telezoom objective. In the images, 1 pixel corresponds to approximately 0.1 mm. To optimize the brightness and obtain images in which the bubbles appear as circles, the foam is lit laterally by two fluorescent tubes, each driven by high-frequency ballasts to prevent flickering in the images. The bottom of the reservoir is covered with a black plate to improve contrast. Typical images are shown in Fig. 2.
The frame rate is fixed such that the displacement at the wheels is fixed at 0.15 mm between frames. Since the flow is strongly intermittent, with large fluctuations in the bubble displacements, we take 1000 frames per run, corresponding to a strain of four for a 5 cm gap, as we are interested in averaged velocity profiles. We preshear the system before taking data so that a steady state is reached.
We obtain the velocity profiles both through particle tracking and a particle image velocimetrylike technique, where for each y value, we calculate the cross correlation 共Cn兲2between the corresponding image line in the Pn共x兲 of length mand the same image linePn+1共x兲in the next frame
shifted by an amount:
关Cn共兲兴2=
兺
i=0m−
Pn共i兲Pn+1共i+兲. 共1兲
We can then proceed in two ways. The first method is to add up all cross correlations from all frames for eachyvalue and calculate the average displacement⌬xper frame by fit-ting a parabola pn共兲 to the resulting sum of cross correla-tions and taking the peak value of that parabola:
FIG. 1.共Color online兲 共a兲Schematic top view of the experimen-tal setup.W represents the gap width and the two horizontal lines indicate the edge of the region over which the velocity profiles are calculated. The solid共red兲curve depicts one such profile.共b兲 Side view of the shearing wheels. The slits in the glass plate are drawn for clarity. That the in-plane component of the motion of the bound-ary is constant can be seen as follows: by trivial geometry, we obtain thatv0=r1cos; but sincer1= r0
cos, at any point along the along the contact line of 230 mm, the layer of bubbles is sheared with a driving velocityv0= r0
coscos=r0.共c兲Experimental im-age of part of the foam, the scale bar represents 5 mm.
⌬x共y兲= max
冉
兺
n=0 999pn共兲
冊
. 共2兲In the second method we fit a parabola to each cross corre-lation separately and obtain the average displacement by av-eraging the maxima of all individual parabolas:
⌬x共y兲=具max关pn共兲兴典. 共3兲
By comparing to average velocity profiles obtained by particle tracking关35兴, we find that the latter procedure gives the closest match to the tracking velocity profiles, and we have employed this procedure throughout. We thus obtain both spatially 共in the x direction兲 and temporally averaged velocity profiles. Despite the intermittent character of the flow, we obtain smooth reproducible velocity profiles.
C. Coarsening and fluid drag
To characterize the amount of coarsening we measure the bubble size distribution by measuring the surface area of the bubbles in the images. We obtain well defined size distribu-tions which show little coarsening over the duration of the runs, which corresponds to about 2 h关Fig.3共a兲兴.
We have checked that the drag on the foam bubbles due to flow of the bulk liquid underneath is negligible by measuring the velocity profile of bubbles floating on a very shallow layer of bulk fluid. In this case the fluid surface velocity is decreased due to the no-slip boundary condition at the reser-voirs’ bottom. We do not, within experimental uncertainty, observe a change in the experimental velocity profiles in this geometry.
We furthermore measure the velocity profile of the liquid surface itself at the same fluid level as in the foam experi-ments by imaging the flow of silver particles that were sprinkled on the liquid surface关see Fig.3共b兲兴. We observe a steeply decreasing velocity profile at the fluid surface, which implies that even if the fluid drag were of the order of the other drags acting on the bubbles it would not significantly alter the flow profiles except near the wheels.
We thus conclude that the bubble size distribution is es-sentially constant during an experimental time frame and that
the dominant drag forces are those between bubbles and top plate and those between contacting bubbles.
IV. LINEAR SHEAR OF TWO-DIMENSIONAL FOAMS
In this section we explore the rate-dependent shear flows in our system experimentally. By fitting our experimental data to a nonlinear drag force balance model, we deduce the dependence of the averaged bubble-bubble and bubble-wall drag forces as function of the local strain rate and velocity.
A. Flow of disordered foams
We measure averaged velocity profiles in disordered two-dimensional foams. These foams are produced by bubbling a fixed flow rate of nitrogen through syringe needles of two different inner diameters, such that bubbles of 1.8⫾0.1 and 2.7⫾0.2 mm result 共at 59–41 number ratio兲. The bubbles are gently mixed with a spoon until a disordered monolayer results. For gap widths of 5, 7, and 9 cm, we drive the foam at 6 different velocities, spanning 2.5 decades: v0= 0.026,
0.083, 0.26, 0.83, 2.6, and 8.3 mm/s.
Note that we perform the sweep in driving velocities from fast to slow and that we preshear the system for one full wheel rotation to start with bubbles covering the wheel 关46兴 and ensure that we have reached a steady state. To fix the packing fraction, we fix the gap between glass plate and liquid surface at 2.25⫾0.01 mm. We have measured 共see Sec. VII兲 that for this gap the packing fraction is = 0.965⫾0.005.
Results are plotted in Figs.4共a兲–4共c兲: the profiles exhibit shear banding, and for all gap widths the profiles become increasingly shear banded at increasing driving velocities. The slowest runs atW= 5 cm yield essentially linear velocity profiles. We suggest that these shapes are due to the small gap width, which results in overlapping shear-banded pro-files resembling a linear profile, and in what follows, we will present a model that supports this conclusion.
Figure4共d兲thus suggests that in this experiment the driving velocity at the edges, instead of the overall shear, sets the velocity profiles, and that the local response to forcing will provide the key toward understanding the shape of these pro-files. Note finally that the profiles do not exhibit significant slip with respect to shearing wheels, except for the fastest runs, where the slip is less than 20%.
B. Model
We now propose a discrete version of a model introduced in关24兴 to account for the shear banding behavior discussed above by considering the balance of the averaged viscous drag forces.
1. Drag forces on individual bubbles
The drag force on a single bubble that slides past a solid wall was first investigated by Bretherton 关33兴 and has re-cently received renewed attention关13,28–31,47兴. The crucial finding is that Fbw, the drag force per bubble sliding past a solid wall, scales as
Fbw=fbw共Ca兲2/3=fbw共v/兲2/3, 共4兲 withis the bulk viscosity,is the surface tension, andfbw is a constant with dimensions of force and Ca is the capillary number. Typically fbw⬀rc, withrcas the radius of the de-formed contact between bubble and wall关47兴. For bubbles in a soapy solution, the 2/3 scaling with Ca only holds for sur-factants that are mobile 关13兴. Results from关48兴 strongly in-dicate that this is indeed the case for our surfactant Dawn, as we will confirm below.
The drag force between two bubbles sliding past each other, Fbb, has not received much attention up to now al-though 关49兴 provides indirect evidence that it scales like Fbb⬀共⌬Ca兲, with⌬Ca⬅⌬v/. In a very recent Letter it is explicitly shown that, for ordered bubble motionFbbscales indeed as共⌬Ca兲关32兴. The authors find= 0.5 although vari-ous physicochemical peculiarities, as well as the range of Ca one measures in, can alter this exponent.
Taking all of this into consideration, it seems reasonable to assume that
Fbb=fbb共⌬v/兲. 共5兲
While the dissipation leading toFbw occurs at the perimeter of the flattened facet 关13兴—hence the prefactor fbw⬀rc −fbbscales⬀c2/R0, wherecis the radius of the deformed contact between bubbles and R0 is the bubble radius, thus
reflecting the different physical mechanism behind this scal-ing关32兴.
2. Stress balance
We divide our shearing region in lanes labeled i and as-sume that on every lane thetime-averagedtop-plate drag per bubbleF¯bw
i
balances with the time-averaged viscous drag per bubble due to the lane to the left共F¯bb
i 兲
and right共F¯bbi+1兲 共see Fig.5兲:
F ¯ bb i+1−F¯
bw i
−F¯bb i
= 0 共6兲
v/v
v/v
FIG. 4.共Color online兲 关共a兲–共c兲兴 Flow profiles for a gap width 共a兲 W= 5, 共b兲 7, and 共c兲 9 cm. From black to light gray, v0= 0.026, 0.083, 0.26, 0.83, 2.6, and 8.3 mm/s. For all gap widths we ob-serve that the localization near the driving wheels increases for in-creasing driving velocity. For clar-ity the profiles are each offset ver-tically by 0.5⫻v/v0. Solid 共red兲 lines: fits to the drag force balance model of Sec.IV B.共d兲Profiles at 2.6 mm/s for all three gap widths. Regardless of the gap width all profiles decay at the same rate.共e兲 Examples of profiles and fits on a log-log plot, highlighting the lin-ear tails of the profiles.v0= 0.026, 0.26, 2.6 mm/s, andW= 5 cm.共f兲 As explained in Sec. IV C 1, the minimum inis found by calcu-lating the variance
冑
具␦k2典/k2ofk over all 18 profiles depicted in 共a兲–共c兲. The minimum in the vari-ance is seen at = 0.36, see Sec.We assume that the averaged drag forces scale similarly to the local drag forces. For the averaged bubble-wall forces we assume
F ¯ bw i
=fbw共vi/兲2/3, 共7兲
while for the averaged bubble-bubble drag forces we assume
F ¯ bb i
=fY+fbb关共/兲共vi−vi−1兲兴, 共8兲
F ¯ bb i+1
=fY+fbb关共/兲共vi+1−vi兲兴. 共9兲
Here fbw andfbbare material parameters with dimension of force, which will be measured by rheometry in Sec.Vbelow. Finally, fYrepresents a yield force in the interbubble drag to remain consistent with rheometrical data presented later on and to reflect the elastic barrier bubbles have to overcome before they slide past each other. Note that the velocitiesvi
denote theaveragedvelocities in thexdirection—the crucial assumption is that the relation between the averaged drag forces and the averaged velocities is simple and can be ex-pressed by a single power law.
We do not know if and how the conjectured forms for the averaged forces can be derived from the nonaveraged forces Eqs.共4兲and共5兲since due to the intermittent and disordered bubble motion, the instantaneous bubble velocities are fluc-tuating and not necessarily pointing in the x direction. For example, there is noa priorireason for the exponentsand to be equal and in fact our data strongly indicate that they are not. The best justification for Eqs. 共7兲–共9兲 is a posteriori—the resulting model describes the data well. Note that the bars in Eqs.共7兲–共9兲express an average over disorder in the sense that these quantities are measured in highly dis-ordered intermittent flows.
Inserting the expressions from Eqs. 共7兲–共9兲 into Eq. 共6兲 and definingk=fbw/fbbwe arrive at
k
冉
v i
冊
2/3
=
冉
冊

关共vi+1−vi兲−共vi−vi−1兲兴. 共10兲
Note that the yield drag contributions fY cancel, which is a particular advantage of the linear geometry we work in. The model predicts flow profiles for arbitrary width and driving rate once the parametersandkare fixed.
C. Fits
1. Procedure
We compare all 18 runs to solutions of the model. We focus on the central part of the data where 兩v兩⬍3/4v0 to
avoid the edge effects near the shearing wheels关for instance the bumps in the low-velocity profiles in Fig. 4共a兲 and the slip with respect to the wheel in the fast runs兴. We numeri-cally integrate Eq.共10兲fromy= 0, wherev= 0, to theyvalue for whichv=共3/4兲v0, while keepingandkfixed. The drag
force balance should govern the shape of the velocity profiles for all driving rates and gap widths. Therefore we determine for fixed the kvalues that fit the flow profiles best. Thek values exhibit a systematic variation that depends on the value of. We quantify this variation by computing the rela-tive variance
冑
具␦k2典/k2, and by repeating the procedure for arange of , we obtain a plot of the variance as a function of 关see Fig.4共f兲兴. From this graph, we determine the value for which the variance is minimized as= 0.36⫾0.05.
2. Results
Fixing nowk= 3.75 and= 0.36, we capture the shape of all data sets with high accuracy. The resulting model profiles are plotted in Figs.4共a兲–4共c兲, and we see that for these val-ues all velocity profiles are adequately fitted except for the slowest runs at W= 5 cm. We attribute these deviations for small W to the observation that edge effects extend further into the shearing region for small gaps.
Note that the model profiles exhibit linear tails 关see Fig. 4共e兲兴 and that the experimental velocity profiles exhibit ap-proximately the same behavior. We conclude that both our experimental and model profiles do not decay exponentially, in contrast with results found in previous studies关15,18兴and the predictions in 关24兴.
D. Continuum limit
The continuum limit of Eq. 共10兲can be written as
fbw
冉
v
冊
2/3
具d典−1=
y, 共11兲
=Y+fbb
冉
具d典␥˙
冊
, = 0.36. 共12兲
Hence, the top plate drag can be considered as a body force and the interbubble drag force as the divergence of a shear stress , whereY is an undetermined yield stress. Equation 共12兲is the constitutive equation for a Herschel-Bulkley fluid 关50兴, and we can now associate the averaged bubble drag force scaling at the local level with the power-law scaling of FIG. 5. 共Color online兲 Illustration of drag balance model. The
the viscous stress in the Herschel-Bulkley model.
Note that = 0.36 is similar to the power-law index n = 0.40 found for the bulk rheology of three-dimensional mo-bile foams 关3,13兴 and to the values n= 0.33 and n= 0.45 found for two-dimensional bubble rafts in a Taylor-Couette geometry in关16兴.
The fact that the yield stress does not play a role for our velocity profiles can now be understood in two ways: at the continuum level, since it is a constant it vanishes after taking the divergence of the shear stress, at the bubble level, even though we include a yield force in Eqs. 共7兲 and 共8兲, the contributions from both neighboring lanes cancel in Eq.共10兲. Finally, notice that the continuum equations can easily be solved in terms of hypergeometric functions关51兴.
V. RHEOMETRICAL DETERMINATION OF VISCOUS FORCES IN TWO-DIMENSIONAL FOAMS
In this section we will investigate the viscous forces that act at the bubble scale by rheometry and test and validate the assumptions for the scaling of the bubble-wall drag and the viscous friction inside the foam expressed in Eqs. 共4兲 and 共5兲. We use an Anton Paar DSR 301 stress controlled rheom-eter, which can also operate in strain controlled mode. We use the rheometer in strain controlled mode to investigate Fbw. Moreover, we compare measurements, which reflect the actual drag force at the single bubble level共Fbb兲, with mea-surements of the averaged viscous drag force on a bubble in a disordered flow of foam共F¯bb兲.
A. Bubble-wall drag
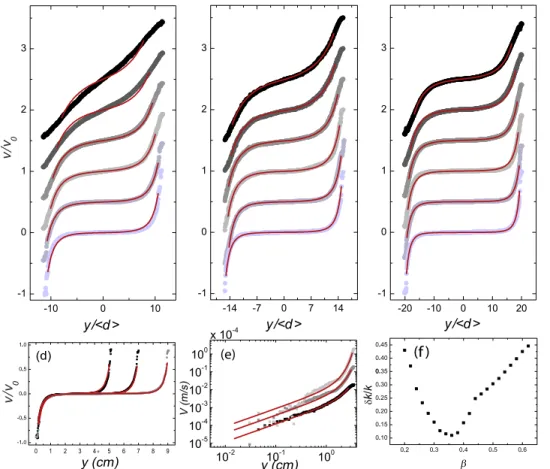
We directly measure the bubble-wall friction for foam bubbles produced from the soap solution presented above with a method that was introduced in关13兴. We load a
mono-layer of bubbles between two PMMA plates of radius RP = 2 cm. The bubbles are pinned to the lower plate by means of a hexagonal pattern of indentations of sizeO共d兲, and can slip with respect to the smooth upper plate which is con-nected to the rheometer head, see lower inset of Fig.6共a兲. We measure the torqueTexerted by the bubbles as a function of the angular velocity of the smooth plate.
We convert T共兲 toFbw共Ca兲 in the following way: each bubble exerts a wall stressw=Fbw/R02on the smooth plate.
We integrate the contribution to the torque of this wall stress over the plate:
T=
冕
0
RP
wr2rdr=
冕
0
RP Fbw
R022r
2dr. 共13兲
If we now assume thatFbw⬀关Ca兴␣=关 r
兴␣, we can immedi-ately read of from the data that ␣= 0.67 关see Fig.6共a兲兴, so inserting this expression in the integral Eq.共13兲yields:
T=2FbwRp
3.67
3.67R02 . 共14兲
Since the bubbles are flattened during the measurement, we can only measureR0through the flattened facetrcby looking at the reflection of the deformed facet, see the upper inset of Fig.6共a兲. We findrc= 1.59⫾0.05 mm. As the bubble radius is smaller than−1we can expressR
0in terms ofrcthrough R02=
冑
32rc−1 关47兴. Note that this derivation ofrcin terms of R0 hinges on the assumption that the bubbles are not toodeformed, which is not obvious in the rheometrical geom-etry, but for lack of a more precise relation we use it. We finally rescale the horizontal axis by multiplying with Rp/. The resulting curve is plotted in Fig. 6共a兲: over our measurement range共more than three decades兲Fbw⬀关Ca兴2/3. FIG. 6. 共Color online兲 共a兲Drag force per bubble exerted on smooth rotated plate as a function of Ca probed by the total drag force of a pinned layer of bubbles on a rotating top plate. The solid line representsFbw=共0.0015⫾0.0001兲共v/兲2/3. The upper inset shows a close-up photograph of the rheometrical tool used to measure the bubble-wall drag: the reflection of the flattened facets of radiusrcused to extract R0can be seen clearly. The lower inset shows a side view of the experimental geometry.共b兲Raw torque for ordered and commensurate lanes of bubbles sliding past each other. Notice the huge fluctuations with respect to the mean indicated by the horizontal line. The average of the raw data corresponds to the data point in共c兲indicated by the arrow.共c兲 Torque averaged over an integer number of rearrangements as a function of⌬Ca for the commensurate case共40 bubbles on inner wheel and 40 bubbles on outer wheel兲 共䊏兲, incommensurate case 41/40 共䉲兲, and incommensurate case 44/40共䉱兲. Dashed lines indicate= 0.67, respectively,= 0.75. Upper inset shows a schematic picture of the rheometrical geometry, lower inset shows a histogram of the extracted values of the exponent. The width of the bin indicates the error in
B. Bubble-bubble drag
1. Drag at the bubble scale
To measure the power-law scaling of the interbubble drag we measure the torque exerted by a foam driven at a strain rate␥˙ in a cylindrical Couette geometry, which consists of an inner driving wheel connected to the rheometer head rotating inside an outer ring. The rheometrical experiments are per-formed with bubble rafts, i.e., foams that are not confined by a top plate, as the additional stresses due to the wall would disturb a clean rheological measurement.
Both boundaries are grooved to ensure a no slip boundary for the bubbles, of which a monolayer floats in the shearing region. We start with measuringF¯bbfor the ordered case by keeping the gap between the cylinders such that exactly two layers of bubbles fit in, see the upper inset of Fig.6共c兲. The inner radius共ri兲is 2.5 cm, and the outer radius共ro兲is 3.0 cm. We deposit bubbles of 2.2 mm diameter in the grooves, make sure that all bubbles are strictly pinned and remain in their groove, and vary the rotation rate of the inner cylinder over 3 decades while measuring the torque averaged over an integer number of rearrangement events 关see Fig.6共c兲兴.
We multiplybyri/to rescale the dimensionless ve-locity difference and we divide the torque byriand the num-ber of bubbles pinned at the inner wheel共e.g., 40兲to obtain the averaged bubble-bubble drag force per bubble in the or-dered case.
We use three different inner wheels: one with 40 grooves, a second with 41 grooves, and a third with 44 grooves. Since the number of grooves in the outer ring is fixed at 40, this allows us to investigate the differences between commensu-rate and incommensucommensu-rate numbers of bubbles in the grooves. For the commensurate case, the result is plotted in Fig. 6共b兲: all bubbles rearrange simultaneously and thus the sig-nal reflects the torque exerted on a single bubble amplified by a factor of 40. The elastic barrier that bubbles have to cross before rearranging is clearly visible in the signal. As a result, the torque oscillates tremendously. Nevertheless, the force per bubble averaged over many such events scales with the dimensionless velocity difference as a power law with index 0.7关see Fig. 6共c兲兴. This value is remarkably close to the exponent found for the bubble-wall drag. For these or-dered lanes, no signs of a yield plateau are observed in the time averaged signal, and we believe this is due to the fact that all elastic energy that is stored in the bubble deformation is released after yielding so that one measures purely the viscous drag.
For the incommensurate runs, the raw signal looks more complex, as rearrangements do not occur simultaneously for all 41 or 44 bubbles. The resulting power-law exponents for the averaged bubble-bubble drag forces are, however, close to the one observed for the commensurate case. In fact, if we repeat the measurements for both commensurate and incom-mensurate bubble numbers a multitude of times and fit Cato the averaged Fbb, we find a distribution of values around = 0.73, see lower inset of Fig.6共c兲. The binsize is similar to the errorbar on each individual measurement.
2. From local to bulk viscous drag
We observe that the scaling exponent for the viscous drag at the bubble scale, , differs markedly from the scaling
ex-ponentof the drag forces inside the bulk foam as extracted from the velocity profiles, e.g., ⬇0.70 vs= 0.36. We hy-pothesize this is due to the disordered flow in the foam and will provide rheological evidence in what follows.
To perform rheological measurements of the average bubble-bubble drag forces, we employ a Couette cell which has an outer ring of radiusr0= 7 cm, such that more layers
of bubbles can fit inside the cell. We first will perform mea-surements on disordered packings of monodisperse bubbles of three different sizes共1, 3, or 5 mm兲. We observe that the foam deviates substantially from hexagonal packing during flow because the inner radius ri= 2.5 cm is small, and the curvature is large. We thus induce disorder through geom-etry.
The resulting measurements show clear yield stress be-havior and can be excellently fit by the Herschel-Bulkley model, yielding for all bubble sizes ⬇0.4, which is mark-edly lower than the 0.70 found for the drag force in ordered lanes above, and close to the 0.36 extracted from the velocity profiles关see Figs.7共a兲and7共b兲兴. The observed stress plateau at low strain rates increases with increasing bubble radius, contrary to the intuition that the yield stress is set by the Laplace pressure and should hence scale inversely to the bubble radius. We tentatively attribute this to the deformation of the bubbles through capillary effects, which are larger for larger bubbles and hence lead to a relatively larger contact size between the bubbles.
In order to further establish a connection between the rheometrical data and the model, we now turn to a geometry with a large inner wheel to increase the measured signal共ri = 5 cm andro= 7 cm兲and measure the torque exerted on the inner wheel by abidispersefoam with the same bubble sizes as in the linear shear experiment. We obtain a clear confir-mation that indeed the disorder changes the power-law scal-ing ofF¯bb: we again reproducibly measure Herschel-Bulkley behavior with power-law index ⬇0.40, as can be seen in Figs.7共c兲.
To convert torques to F¯bb, we divide the torque by the number of bubbles and ri. Since our outer rough boundary forces the bubble velocity to zero, we can rescale the angular frequency to the dimensionless velocity difference ⌬v/
by assuming a linear velocity profile across the gap, decay-ing from rito 0. The gap width is approximately 9具d典and hence we can estimate ⌬v. We extract from the rheological measurements an estimate for the ratio k=fbw/fbb ⬇5.5⫾0.5. This is remarkably close to the value k = 3.75⫾0.5 extracted from the velocity profiles, given the crude estimates used in converting torques to bubble-bubble drag forces in the rheometrical data—we have oversimplified the shape of the velocity profile in the disordered Couette rheometry, which is neither linear, nor rate independent.
C. Interpretation
note that the model yields linear velocity profiles regardless of the exponent if the body force due to the wall drag is zero. This is consistent with earlier measurements by Wang et al.关18兴, where essentially linear flow profiles were found for bubble rafts, i.e., in absence of a top plate.
By comparing the results obtained from the velocity pro-files with the rheometrical measurements, we note a remark-able difference between the scaling of the bubble-bubble drag forces at the bubble level, which we have mimicked by strictly ordered bubble rheology, and the scaling of the aver-aged forces at the bulk level, which we have extracted from the velocity profiles and confirmed by rheometry: we find Fbb⬃共⌬v兲0.70 at the bubble level and F¯bb⬃共⌬v兲0.36 at the bulk level.
We speculate that this is closely connected to the non-affine behavior of the bubbles 关5,34,43兴: close to the jam-ming transition, the effective viscosity of the foam becomes anomalously large due to the fact that bubble motion is much more complicated than if the bubble motion would have been affine, i.e., where the bubbles follow the imposed shear关34兴. This picture is corroborated by recent simulations on the bubble model关5兴, where one recovers this “renormalization” of the drag force exponent 关39,41,42兴. The precise micro-scopic mechanism, though, is far from understood.
One may wonder why the modification of the exponent of the drag force law is strong for the interbubble forces but weak or essentially absent for the bubble-wall drag forces. We have no definite answer although we are fairly confident that the bubble-wall drag forces indeed are not modified. We base this assertion on explorations of the bubble trajectories described below.
If we assume the Bretherton expression 关Eq. 共4兲兴, to be the correct expression that gives the instantaneous bubble-wall drag force as a function of the instantaneous bubble velocity, our claim is that the averaged bubble-wall drag forces scale similar to the individual bubble-wall drag force:
具共vជ/兩v兩兲x兩v兩2/3典 ⬇ 具vx典2/3. 共15兲
Hence we claim that the time averaged bubble wall drag force is proportional to 具vx典2/3, which is the expression we employ in our model to estimateF¯bw. In other words, we can interchange the order of taking time averages and “raising to the power 2/3.”
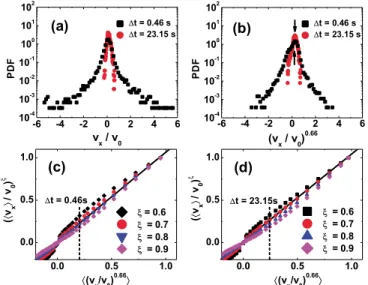
To check this, we have performed accurate bubble track-ing and calculated and compared 具Fbx典⬅具共vជ/兩v兩兲x兩v兩2/3典 and 具vx典2/3 关35,52兴. In Figs.8共a兲 and8共b兲 we show examples of distributions of both 具Fbx典 and 具vx典2/3, based on short and long time velocity estimates at a fixed position in the cell. For long times these distributions are narrower and have less weight around zero. For the examples shown in Figs. 8共a兲 and8共b兲, the averages of the dimensionless velocity distribu-tions equal 具vx/v0典⬇0.125, independent of the time
averag-ing interval. Hence, 具vx/v0典2/3⬇0.248. The averages of the
distributions of共vx/v0兲2/3, taken over different time intervals,
depend now on this time interval and approximate 具vx/v0典2/3⬇0.248 better the longer than the time interval is:
we find 具共vx/v0兲2/3典0.46s⬇0.205 while 具共vx/v0兲2/3典23.15s = 0.245. Since the drag force model deals with 共long兲 time averages, the improvement of the agreement with time is encouraging.
The connection between具Fbx典and具vx典2/3can be probed in more detail by plotting具Fbx典as function具vx典for a range of strain rates and estimating for which value of these two quantities are proportional. The data in Fig. 8共c兲 show that for short times, a value of ⬇0.80, significantly different from 2/3, leads to the best correlation, while for longer times 关Fig. 8共d兲兴, the best value is ⬇0.72. Therefore, the longer the time interval, the closerapproaches 2/3. The underlying reason is that for increasing time intervals, the distribution of
vx/v0 becomes narrower and narrower and peaked away
from zero, and thus we indeed can interchange the order of taking time averages and raising to the power 2/3.
The bubble-bubble drag forces, on the other hand, involve velocity differences, and even at long times we expect their probability distribution to have significant weight around ⌬v= 0. The situation is then qualitatively similar to that shown in Fig.8 for short times, and a change from local to global exponent appears reasonable. Unfortunately, testing this explicitly in our data for the bubble trajectories has proven to be prohibitively difficult, not only because velocity differences are smaller and noisier than velocities but also since bubble contacts are very hard to establish unambigu-ously. The precise mechanism responsible for the renormal-ization that leads to the exponent⬇0.4 remains therefore open.
Finally, the origin of the edge effects that prevent us from fitting our full experimental curves with the model profiles might be due to the fluid drag near the wheels that was dis-cussed in Sec.III C. Alternatively the origin might lie in the absence of a local flow rule near the driving wheels as re-ported in 关53兴. One way to resolve this is accommodating nonlocal behavior in the drag force balance model, for in-stance by incorporating drag terms due to next nearest lanes, similar to the cooperativity length introduced in 关53兴. We have not pursued this avenue.
VI. ORDERED FOAMS
We have postulated that the disordered bubble motion un-derlies the anomalous relation between the local bubble-bubble drag forces and the global viscous stresses. To cor-roborate this conjecture, we shear ordered monodisperse foams in the linear geometry, similar to what was done in 关18兴. In this case the bubbles are expected to move affinely with the global shear, in which case one would expect the global viscous drag forces to scale the same as the local ones. We shear a monodisperse ordered foam with bubbles of size 2.7 mm, produced by blowing nitrogen through one sy-ringe needle at fixed flow rate, at a gap W of 7 cm at v0
= 0.083, 0.26, and 0.83 mm/s. We recover the rate indepen-dent and strongly shear-banded velocity profiles reported in 关18兴 共see Fig.9兲. As in the case of the bidisperse foams, we fit model profiles to our experimental data. For the model to yield rate independent velocity profiles, the drag forces need to balance in the same ratio for all driving velocities. This can only be achieved if = 2/3 since we have already con-firmed with rheometry that the exponent governing bubble-wall drag is 2/3. Indeed we find that the experimental profiles are best fit by model profiles if one fixes k= 0.3 and  = 0.67⫾0.05关54兴, see Fig.9.
Disorder
In our experiment, the complex bubble motion is closely connected to the anomalous scaling of the bubble-bubble drag force, which in turn is reflected in the observed rate dependence of the velocity profiles. We can thus investigate for which levels of disorder the rate dependence of the ve-locity profiles occurs by gradually increasing the disorder, starting from a monodisperse foam.
FIG. 8. 共Color online兲 Dimensionless velocity distributions measured for W= 7 cm, v0= 0.25 mm/s, and for a y-position 19 mm away from the center of the gap. Here the averaged velocity equals 3.1⫻10−2 mm/s and the local strain rate equals 5.6
⫻10−3 s−1. 共a兲 Distribution of v
x/v0for a short time interval 共⌬t = 0.46 s, black squares兲and longer time interval共⌬t= 23.15 s, red circles兲. For the averages of the dimensionless velocity distributions we find具vx/v0典⬇0.125 independent of the time averaging interval. 共b兲 Distribution of共vx/v0兲2/3for a short time interval共⌬t= 0.46 s, squares兲and longer time interval共⌬t= 23.15 s, circles兲. The aver-ages of the scaled dimensionless velocity distributions equal 具共vx/v0兲2/3典
0.46s⬇0.205 and 具共vx/v0兲2/3典23.15s= 0.245. The signifi-cance of this is that具vx/v0典2/3⬇0.248, which is significantly better approximated by the longer time average. 共c兲 Comparison of 具vx/v0典and具vx/v0典2/3along the flow profile for⌬t= 0.46 s and for four values ofas indicated. The best linear relation is obtained for
⬇0.80. Dotted vertical line indicates the averages shown in panel 共b兲.共d兲Same as共c兲, now for⌬t= 23.15 s. The best linear relation is obtained for⬇0.72.
FIG. 9. 共Color online兲 共a兲Velocity profiles for a monodisperse, ordered foam with the crystal axis aligned with the wheels. Gap W= 7 cm andv0= 0.083 共black兲, 0.26 共dark gray兲 and 0.83共light gray兲 mm/s. Solid共red兲curves indicate fits to the model Eq.共10兲
To this end we record velocity profiles in a monodisperse foam made of 2.7 mm size bubbles in which we gradually increase the area fraction of smaller共1.8 mm兲bubbles. After mixing the two species we measure velocity profiles at v0
= 0.083, 0.26, and 0.83 mm/s. We already observe the occur-rence of rate-dependent velocity profiles for small quantities of defects, see inset 共a兲 and 共b兲 of Fig. 9, and by visual inspection, we already see the swirling patterns, typical of our 41/59 bidisperse foam occurring at 2% disorder. These findings indicate that rate independent flows are in fact lim-ited to a narrow region close to the almost singular case of completely ordered foams.
VII. ROLE OF THE PACKING FRACTION
In this section we will discuss linear shear experiments where we will vary both the packing fractions共orwetness兲of our foam as well as the applied strain rate to investigate the flow behavior of these foams as a function of density. In particular, we will closely approach the jamming transition located at c⬇0.84. This allows us to test the drag force balance model over a wide range of experimental situations. Our main findings are that, first, the scaling exponent  ap-pears to be independent of, and, second, that the prefactor k in our model 关Eq. 共10兲兴 varies as 1/共−c兲, where c ⬇0.84.
A. Varying and measuring
In order to vary, we vary the vertical gap between the glass plates and the bulk solution between 3 and 0.2 mm. We do this by adding or retracting fluid from the reservoir. For large gaps the bubbles get stretched in the vertical direction and share large deformed facets—the foam effectively be-comes dry. For small gaps the bubbles acquire a pancakelike shape, close to purely disk like in the horizontal plane, with only small facets between neighboring bubbles—the foam effectively becomes wet.
To create a homogeneous gap between the liquid surface and the glass plate, we place additional supports under the glass plate to prevent sagging of the top plate during the runs. We monitor the gap width with a Mitutoyo digital depth gauge. If the gap becomes smaller than 0.2 mm the bubbles unjam 关55,56兴.
We find that in the linear shear cell the accessible range in is 0.86ⱗⱗ0.97. If we stay between these limits the system we study is jammed and quasi-two-dimensional. It should be noted that for the runs performed at fixed wetness, discussed in the previous sections, we find = 0.965⫾0.005, in reasonable agreement with previous re-ports on the maximumthat can be obtained in our type of setup关57兴.
The concept of packing fraction is problematic for a monolayer of three-dimensional bubbles关58兴. We choose our lighting of the bubbles such that the contacts between adja-cent bubbles are optimally resolved. In other words, we im-age a slice from the packing where the bubbles are the broad-est and calculate a 2D packing fraction from this slice. We then extract through image analysis as illustrated in Fig.
10. We first binarize the images, after which both the bubble centers and the interstices appear bright. We remove the in-terstices by morphological operations. We then invert the bi-narized image and fill up the remaining bubble contours. We have checked that the resulting bright disk optimally matches the original bubble contour, see Fig. 10. We then calculate the ratio of white pixels over the total number of pixels and hence obtain a reasonable estimate of .
Now that we have obtained estimates of the packing frac-tion , we can probe the role of the wetness in setting the flow. We first, in Sec.VII B, briefly discuss a local probe of the nonaffine motion, which shows that the bubble motion becomes increasingly nonaffine when the wetness is in-creased. We then investigate the variation in the flow behav-ior with, using our model关Eq.共10兲兴. We first establish, in Sec. VII C, that the exponent  does not vary with —surprising, give the varying degree of nonaffinity. We then find, in Sec. VII D, that the force prefactor k varies strongly withand vanishes atc⬇0.84 as 1/共−c兲.
B. Local measure of the nonaffine bubble motion:
P(␣)
A crucial feature of deformations found in simulations of packings of frictionless disks near jamming is the strongly nonaffine nature of the particle共bubble兲motion关5,34,36,43兴. Recently, a simple local probe of this affinity was introduced by Ellenbroeket al.关43兴who performed simulations of soft frictionless disks. Defining the displacements of contacting particlesiandjasuជianduជjand the vector that connects the centers of particles i and j as rជij, the relative displacement angle ␣ was defined as the angle between rជij anduជi−uជj. In other words, ␣= 0° corresponds to particles moving away from each other, ␣= 180° corresponds to particles moving closer, and ␣= 90° corresponds to particles sliding past one another.
The probability distribution P共␣兲 was found, for shear deformations in particular, to be well fitted by a共periodically extended兲Lorentzian peaked around 90°关43,59兴. The width of the peak scales with distance to jamming—at jamming, P共␣兲approaches a delta function peaked at␣= 90°.
system is not homogeneous. Nevertheless, as a coarse mea-sure of the degree of nonaffine bubble motion, which we claim underlies the anomalous scaling exponent  in disor-dered systems, we have calculated P共␣兲 focusing on finite time displacement fields 共v0= 0.216 mm/s, W= 5 cm, and ⌬t= 0.46 s兲.
In Fig. 11 we show P共␣兲 averaged over the regions 0 ⬍y⬍W/3 and 2W/3⬍y⬍W where most of the flow takes place, and averaged in the x direction over 50 mm in the center of the cell. We limit ourselves to this region, because, in particular for the wet runs, there is hardly any flow in the center region of the cell and the peaks inP共␣兲 are less pro-nounced in this region. We find that, analogous to what is found in simulations 关43兴, the distributions become increas-ingly peaked around ␣= 90° for increasing wetness. More-over, the distributions are well fit by the same Lorentzian fit that also captures the numerical displacement fields well 关59兴.
Hence, this simple measure of nonaffine motion strongly indicates that the degree of nonaffinity increases for wetter foams. We believe that this is the first experimental measure-ment of this distribution that shows the proximity of the jamming transition. Detailed studies of the role of the local strain rate or the time interval over which displacements are measured are deferred to later work.
C. Variation in the exponentwith
We now investigate the validity of applying the drag force balance model with a fixed= 0.36 for varying . The mi-croscopic exponent 2/3 which governs the flow of a bubble past a wall appears to be independent of the particularities of the foam flow 关29,60兴. On the other hand, it is not at all obvious that , which governs the averaged bubble-bubble drag forces, does not depend on. As we have seen,is set by the disorder in the system and the nonaffine bubble mo-tion that occurs in conjuncmo-tion with that, and as we have shown in the previous section, the degree of nonaffinity var-ies substantially with.
To see if indeed depends on the foam density we per-form two additional scans over the same six shear rates as employed in Sec. III for a bidisperse foam at a gap width W= 7 cm, while first fixing = 0.905⫾0.005 and then = 0.925⫾0.005. We look for a minimum of the variance ink over the six velocity profiles as a function of共see gray and light gray squares in Fig.12兲. We observe that the model fits best to all six runs performed at = 0.905 for ␣= 2/3,  = 0.38⫾0.05 共see Fig. 12兲, and k= 7.5, whereas the model best matches the runs performed at = 0.925 for␣= 2/3, = 0.39⫾0.05共see Fig.12兲, andk= 5.8, thus strongly indicat-ing that within our range of accessible liquid fractions  seems to be constant. For comparison, we include the vari-ance for the runs described in Sec. IV Bthat was plotted in Fig.4共f兲. Remarkably,remains a constant with varying while the degree of nonaffinity varies. While we do not pre-tend to understand this, we do remark that  and P共␣兲 es-sentially encode different routes toward jamming and thus toward increasing nonaffinity:  is renormalized by the in-creasing nonaffinity as one lowers the strain rate ␥˙ toward jamming, while P共␣兲 monitors nonaffinity as a function of density.
D. Scaling of the force prefactorkwith
Now that we have established thatis independent of, we will probe the variation in kwith . We measure aver-aged velocity profiles at gap widths W= 5 cm and W = 7 cm and fixed v0= 0.26 mm/s 共the third slowest driving
velocity兲 for packing fractions varying between = 0.855 and= 0.975. The velocity profiles forW= 5 cm are plotted in Fig.13and are seen to become increasingly shear banded as we approachc关61兴. This trend is reflected in the increase ink as we approachc. We obtain kby fitting solutions of our drag force balance model with ␣= 0.67 and = 0.36 to these profiles. The resulting fits are shown as solid共red兲lines in Fig. 13and fit the data well.
FIG. 11. 共Color online兲Displacement angle distributions P共␣兲 for runs for which v0= 0.26 mm/s,W= 5 cm, and ⌬t= 0.46 s av-eraged over the shear-banded region 共0⬍y⬍W/3 and 2W/3⬍y
⬍W兲for the range of packing fractions as indicated.
In Fig.14we plot kas a function of −c, withcthe theoretically predicted and experimentally measured value of the unjamming packing fraction: c= 0.842 关39,62,63兴. In good approximation we obtain that
k⬀1/共−c兲. 共16兲
We can tentatively explain the observed scaling of kwith a simple argument based on the sizes of the facets in the foam. At fixed, the drag force balance model yields a value ofk that sets the relative influence of the bubble-wall drag with respect to the bubble-bubble drag and which we have con-jectured to be given byk⬀fbw/fbb. As we have already dis-cussed,fbw⬀rcwithrcas the radius of the flattened contact between the bubble and the wall andfbb⬀c
2/R
0, withcas
the radius of the flattened contact between neighboring bubbles. Thus we expect
k⬀rc/c
2
. 共17兲
While rc is set by the buoyancy and hence does not vary strongly with the gap distance between glass plate and liquid surface, only becoming slightly smaller as the bubbles get stretched at large gaps,cis strongly dependent on the gap size and hence on the packing fraction of the foam.
The size of c should depend on the deformation 共also called the overlap兲␦ as关25兴
c⬀共␦兲1/2. 共18兲 Similar to simulations of two-dimensional frictionless disks 关37,43兴we can relate the overlap␦ to the packing fraction :
␦⬀ ⌬. 共19兲 Simple substitution of this result into Eq.共17兲yields
k⬀rc/c2⬀1/␦= 1/共⌬兲, 共20兲 which is fully consistent with our experimental results, see the solid line in Fig.12.
Note that in the above we have only focused on the radius of the deformed facets. A proper analysis would include the size of the Plateau border around the contact, which is where the dissipation also occurs关28,31兴. For instance, in关60兴the bubble-wall drag force scales as Fbw⬀Ca0.64l−0.26 and a proper treatment would entail such analysis even though the functional dependence on the Plateau border size is always weak. Moreover, in all of these works, the functional depen-dence of the drag force with is smooth around c and hence will not influence the observed scaling around that point.
VIII. DISCUSSION AND CONCLUSION
We have measured velocity profiles in linearly sheared quasi-two-dimensional foams in the liquid-glass configura-tion. We find that bidisperse disordered foams exhibit strongly rate-dependent and inhomogeneous 共shear-banded兲 velocity profiles, while monodisperse ordered foams are also shear banded but essentially rate independent. We capture these findings in a simple model that balances the viscous drag forces in our system. The scaling forms for these drag forces are verified by independent rheological measurements. Finally, we apply our model to velocity profiles obtained for foams at varying packing fraction and measure and describe the scaling of the inverse foam consistency with packing fraction.
This work raises several questions. First, can the differ-ence between the local bubble-bubble drag force scaling and the global 共averaged兲 bubble-bubble drag force scaling be understood theoretically? This difference in scaling expo-nents appears similar to the change from local drag forces to global rheological laws observed in simulations of共variants兲 of the bubble model 关5,39,40,42,64兴, but a precise connec-tion is lacking at present. Closely connected, is our scenario FIG. 13. 共Color online兲 Velocity profiles in linearly sheared
foam at fixed driving rate共v0= 0.26 mm/s兲, forvarying between 0.855ⱕⱕ0.975 at W= 7 cm. Solid共red兲 lines are solutions to linear drag force balance model with␣= 0.67 and= 0.36 fixed.kis extracted from the fits and plotted in Fig. 14 as a function of −c.
an example of a general route by which aspects of the ubiq-uitous Herschel-Bulkley共power-law兲 rheology observed for a wide range of disordered materials can be rationalized?
Second, how robust are our experimental results? For ex-ample, would similar flows in Hele-Shaw cells behave dif-ferently as suggested by the results of Debrégeas 关15兴? We also wonder if the drag force balance model is able to cap-ture shear-banded flows in Couette geometries, where the curvature plays an important role, in particular since the foam has a finite flow threshold关65兴. Third, can similar phe-nomena and models as described here be extended to three-dimensional flows of foams and emulsions—where flows in
the latter can be captured by confocal imaging and MRI 关26,53,66,67兴? Fourth, how should our local models be com-pared to the nonlocal effects recently discussed for emulsion flows 关53,66兴?
ACKNOWLEDGMENTS
The authors wish to thank Jeroen Mesman for technical assistance. G.K. kindly acknowledges Nikolai Denkov for illuminating discussions. G.K. and M.M. acknowledge sup-port from physics foundation FOM, and M.v.H. acknowl-edges support from NWO/VIDI.
关1兴R. Höhler and S. Cohen-Addad, J. Phys.: Condens. Matter 17, R1041共2005兲.
关2兴T. G. Mason, J. Bibette, and D. A. Weitz, J. Colloid Interface Sci. 179, 439共1996兲; W. Losert, L. Bocquet, T. C. Lubensky, and J. P. Gollub, Phys. Rev. Lett. 85, 1428共2000兲; P. Coussot, J. S. Raynaud, F. Bertrand, P. Moucheront, J. P. Guilbaud, H. T. Huynh, S. Jarny, and D. Lesueur,ibid. 88, 218301共2002兲; R. Besseling, E. R. Weeks, A. B. Schofield, and W. C. K. Poon,ibid. 99, 028301共2007兲.
关3兴L. Bécu, S. Manneville, and A. Colin, Phys. Rev. Lett. 96, 138302共2006兲.
关4兴A. M. Kraynik, Annu. Rev. Fluid Mech. 20, 325共1988兲. 关5兴D. J. Durian, Phys. Rev. Lett. 75, 4780共1995兲.
关6兴C. Gilbreth, S. Sullivan, and M. Dennin, Phys. Rev. E 74, 051406共2006兲.
关7兴D. Weaire and S. Hutzler,The Physics of Foams 共Clarendon Press, Oxford, 1999兲.
关8兴R. G. Larson,Structure and Rheology of Complex Fluids共 Ox-ford University Press, New York, 1998兲.
关9兴S. A. Khan, C. A. Schnepper and R. C. Armstrong, J. Rheol. 32, 69共1988兲.
关10兴H. M. Princen and A. D. Kiss, J. Colloid Interface Sci. 128, 176共1989兲.
关11兴A. D. Gopal and D. J. Durian, Phys. Rev. Lett. 91, 188303 共2003兲.
关12兴J. Lauridsen, M. Twardos, and M. Dennin, Phys. Rev. Lett. 89, 098303共2002兲.
关13兴N. D. Denkov, V. Subraminian, D. Gurovich, and A. Lips, Colloids Surf., A 263, 129共2005兲.
关14兴G. Katgert, M. E. Möbius, and M. van Hecke, Phys. Rev. Lett. 101, 058301共2008兲.
关15兴G. Debrégeas, H. Tabuteau, and J.-M. di Meglio, Phys. Rev. Lett. 87, 178305共2001兲.
关16兴J. Lauridsen, G. Chanan, and M. Dennin, Phys. Rev. Lett. 93, 018303共2004兲.
关17兴L. Bragg and J. F. Nye, Proc. R. Soc. London, Ser. A 190, 474 共1947兲.
关18兴Y. Wang, K. Krishan, and M. Dennin, Phys. Rev. E 73, 031401 共2006兲.
关19兴C. S. Smith,Metal Interfaces共American Society for Metals, Cleveland, OH, 1952兲.
关20兴M. F. Vaz and M. A. Fortes, J. Phys.: Condens. Matter 9, 8921 共1997兲.
关21兴B. Dollet, F. Elias, C. Quilliet, C. Raufaste, M. Aubouy, and F. Graner, Phys. Rev. E 71, 031403共2005兲.
关22兴A. Kabla, J. Scheibert, and G. Debrégeas, J. Fluid Mech. 587, 45共2007兲.
关23兴I. Cheddadi, P. Saramito, C. Raufaste, P. Marmottant, and F. Graner, Eur. Phys. J. E 27, 123共2008兲.
关24兴E. Janiaud, D. Weaire, and S. Hutzler, Phys. Rev. Lett. 97, 038302共2006兲.
关25兴Martin-D. Lacasse, G. S. Grest, D. Levine, T. G. Mason, and D. A. Weitz, Phys. Rev. Lett. 76, 3448共1996兲.
关26兴J. Brujić, S. F. Edwards, I. Hopkinson, and H. A. Makse, Physica A 327, 201共2003兲.
关27兴S. Zhou, Q. Long, D. Wang, and A. D. Dinsmore, Science 312, 1631共2006兲.
关28兴N. D. Denkov, S. Tcholakova, K. Golemanov, V. Subramanian, and A. Lips, Colloids Surf., A 282-283, 329共2006兲.
关29兴I. Cantat, N. Kern, and R. Delannay, Europhys. Lett. 65, 726 共2004兲.
关30兴A. Saugey, W. Drenckhan, and D. Weaire, Phys. Fluids 18, 053101共2006兲.
关31兴E. Terriac, J. Etrillard, and I. Cantat, Europhys. Lett. 74, 909 共2006兲.
关32兴N. D. Denkov, S. Tcholakova, K. Golemanov, K. P. Anantha-padmanabhan, and A. Lips, Phys. Rev. Lett. 100, 138301 共2008兲.
关33兴F. P. Bretherton, J. Fluid Mech 10, 166共1961兲.
关34兴A. J. Liu, S. Ramaswamy, T. G. Mason, H. Gang, and D. A. Weitz, Phys. Rev. Lett. 76, 3017共1996兲.
关35兴M. E. Mobius, G. Katgert and M. van Hecke, arXiv-:.soft:0811.0534.
关36兴H. A. Makse, N. Gland, D. L. Johnson, and L. M. Schwartz, Phys. Rev. Lett. 83, 5070共1999兲.
关37兴C. S. O‘Hern, L. E. Silbert, A. J. Liu, and S. R. Nagel, Phys. Rev. E 68, 011306共2003兲.
关38兴W. G. Ellenbroek, Z. Zeravcic, W. van Saarloos and M. van Hecke,共unpublished兲.
关39兴P. Olsson and S. Teitel, Phys. Rev. Lett. 99, 178001共2007兲. 关40兴T. Hatano, J. Phys. Soc. Jpn. 77, 123002共2008兲.
关41兴V. J. Langlois, S. Hutzler, and D. Weaire, Phys. Rev. E 78, 021401共2008兲.
关42兴J. Remmers, E. Woldhuis, B. P. Tighe, M. van Hecke and W. van Saarloos,共unpublished兲.
Saar-loos, Phys. Rev. Lett. 97, 258001共2006兲.
关44兴H. A. Makse, D. L. Johnson, and L. M. Schwartz, Phys. Rev. Lett. 84, 4160共2000兲.
关45兴J. M. Andreas, E. A. Hauser, and W. R. Tucker, J. Phys. Chem. 42, 1001共1938兲.
关46兴This is done to ensure the packing fraction remains constant during the strain rate sweep; when the entire circumference of the wheel is covered with bubbles a balance results between bubbles dragged out of the system and injected back in. If we would sweep from slow to fast driving rates, this balance is not achieved, resulting in a packing fraction that decreases during the experiment.
关47兴P. Aussillous and D. Quéré, Europhys. Lett. 59, 370共2002兲. 关48兴S. A. Koehler, S. Hilgenfeldt, and H. A. Stone, Phys. Rev. Lett.
82, 4232共1999兲.
关49兴D. A. Reinelt and A. M. Kraynik, J. Colloid Interface Sci. 132, 491共1989兲.
关50兴W. H. Herschel and R. Bulkley, Kolloid-Zeitschrift 39, 291 共1926兲.
关51兴B. P. Tighe,共private communications兲; D. Weaire, S. Hutzler, V. J. Langlois, and R. J. Clancy, Philos. Mag. Lett. 88, 387 共2008兲.
关52兴One subtlety one encounters is that from the tracking we can only estimate the velocity from ratios of displacements and time intervals, and for the experimentally accessible time scales, the statistics of the velocities thus obtained have been found to depend on the time interval共see关35兴兲.
关53兴J. Goyon, A. Colin, G. Ovarlez, A. Ajdari, and L. Bocquet, Nature共London兲 454, 84共2008兲.
关54兴The value ofkis remarkably small. If we assume that prefactor fbwfor the bubble wall drag remains unchanged for the ordered foam, this means that the bubble-bubble drag prefactor fbbis much larger compared to its value for a disordered foam. Note however, that the power-law exponentgreatly influences the value of the drag force: for instance, if⌬v= 0.001 m/s, then 共v/兲2/3= 1.6⫻10−3, whereas 共v/兲0.36= 3.1⫻10−2, which is more than an order of magnitude larger.
关55兴S. J. Cox and E. Janiaud, Philos. Mag. Lett. 88, 693共2008兲. 关56兴This might be due to the fact that the gap is then of the size of
the plateau borders that connect the flat film between the bubble and the glass plate and the flat film between neighbor-ing bubbles, and hence the latter vanishes. If the gap becomes larger than 3 mm the foam buckles and develops a three-dimensional structure.
关57兴C. Raufaste, B. Dollet, S. Cox, Y. Jiang, and F. Graner, Eur. Phys. J. E 23, 217共2007兲.
关58兴One could try to relate the liquid fraction to the gap between the liquid surface and the glass plate. This distance, however, does not unambiguously setin our experiment: we observe a large hysteresis effect, i.e., increasing or decreasing the gap to a certain value does not yield the same packing fraction . This probably due to the open boundary conditions in the hori-zontal plane. Another measure that has been derived in 关57兴
relates the measured length of the deformed facets of the bubbles just before a T1 event to . In our experiments, though, it is not clear how the occurrence of T1 events can precisely be defined since there is no obvious separation of the deformation scales during and outside of a T1 event. 关59兴W. G. Ellenbroek, M. van Hecke and W. van Saarloos,共
unpub-lished兲.
关60兴C. Raufaste, A. Foulon, and B. Dollet, Phys. Fluids 21, 053102 共2009兲.; http://tel.archives-ouver-tes.fr/docs/00/19/32/ 48/PDF/TheseRaufaste.pdf
关61兴Note that this trend is opposite to what was observed by De-brégeas et al.in 关15兴: there the authors find that the velocity profiles become less shear banded with increasing liquid frac-tion. We cannot explain this result and conclude it to be one of the many open questions surrounding that work.
关62兴F. Bolton and D. Weaire, Phys. Rev. Lett. 65, 3449共1990兲. 关63兴F. Lechenault, O. Dauchot, G. Biroli, and J.-P. Bouchaud, EPL
83, 46003共2008兲.
关64兴N. Xu and C. S. O’Hern, Phys. Rev. E 73, 061303共2006兲. 关65兴M. Dennin, J. Phys.: Condens. Matter 20, 283103共2008兲. 关66兴G. Ovarlez, S. Rodts, A. Ragouilliaux, P. Coussot, J. Goyon,
and A. Colin, Phys. Rev. E 78, 036307共2008兲.