FIRST DETECTION OF GAS-PHASE METHANOL IN A PROTOPLANETARY DISK
Catherine Walsh1, Ryan A. Loomis2, Karin I. Öberg2, Mihkel Kama1, Merel L. R. van’t Hoff1, Tom J. Millar3, Yuri Aikawa4, Eric Herbst5, Susanna L. Widicus Weaver6, and Hideko Nomura7
1
Leiden Observatory, Leiden University, P.O. Box 9531, 2300 RA Leiden, The Netherlands;[email protected]
2
Harvard-Smithsonian Center for Astrophysics, 60 Garden Street, Cambridge, MA 02138, USA 3
School of Mathematics and Physics, Queen’s University Belfast, University Road, Belfast, BT7 1NN, UK 4
Center for Computational Sciences, University of Tsukuba, 1-1-1 Tennodai, Tsukuba 305-8577, Japan 5
Departments of Chemistry and Astronomy, University of Virginia, Charlottesville, VA 22904, USA 6
Department of Chemistry, Emory University, Atlanta, GA 30322, USA 7
Department of Earth and Planetary Science, Tokyo Institute of Technology, 2-12-1 Ookayama, Meguro-ku, 152-8551 Tokyo, Japan
Received 2016 February 13; revised 2016 March 29; accepted 2016 April 4; published 2016 May 13
ABSTRACT
Thefirst detection of gas-phase methanol in a protoplanetary disk(TW Hya)is presented. In addition to being one of the largest molecules detected in disks to date, methanol is also the first disk organic molecule with an unambiguous ice chemistry origin. The stacked methanol emission, as observed with the Atacama Large Millimeter/submillimeter Array, is spectrally resolved and detected across six velocity channels(>3s), reaching a peak signal-to-noise of5.5s, with the kinematic pattern expected for TW Hya. Using an appropriate disk model, a fractional abundance of3´10-12–4´10-11(with respect to H
2)reproduces the stacked line profile and channel maps, with the favored abundance dependent upon the assumed vertical location (midplane versus molecular layer). The peak emission is offset from the source position, suggesting that the methanol emission has a ring-like morphology: the analysis here suggests it peaks at»30 au, reaching a column density»3 6– ´1012cm−2. In the case of TW Hya, the larger(up to millimeter-sized)grains, residing in the inner 50 au, may thus host the bulk of the disk ice reservoir. The successful detection of cold gas-phase methanol in a protoplanetary disk implies that the products of ice chemistry can be explored in disks, opening a window into studying complex organic chemistry during planetary system formation.
Key words:astrochemistry– protoplanetary disks– stars: individual(TW Hya)– stars: pre-main sequence– submillimeter: planetary systems
1. INTRODUCTION
Protoplanetary disks contain the ingredients for building planetary systems. The disk volatile component determines the composition of the atmospheres of forming planets and icy planetesimals (e.g., comets). Whether a planetary atmosphere or icy planetesimal is, e.g., carbon-rich or oxygen-rich, and/or rich in more complex molecules, will depend on radial variations in disk midplane composition, and specifically the locations of snowlines that delineate the boundary beyond which a particular volatile is frozen out onto dust grains (see, e.g., Öberg et al.2011; Walsh et al.2015). The Atacama Large Millimeter/Submillimeter Array (ALMA) can map the radial distribution of cold dust and gas in disks around nearby young stars with unprecedented spatial resolution and sensitivity. Recent discoveries include imaging of N2H+ and DCO+ emission from TW Hya, HD 163296, and IM Lup that show ring-like structures that may be tracing the CO gas distribution
(Qi et al.2013,2015; Öberg et al.2015a), thefirst detection of a complex organic molecule, CH3CN, in MWC 480 (Öberg et al.2015b), and spatially resolved observations of dust gaps potentially carved by forming planets (Walsh et al. 2014a; ALMA Partnership2015; Nomura et al. 2016).
Disk snowlines are also important for the formation of complex organic molecules (COMs) in disks and thus their incorporation into nascent planets. Methanol, CH3OH, is a COM of particular interest because it is an important parent species of larger and more complex molecules in the gas and ice(e.g., Charnley et al.1992; Bennett et al.2007; Öberg et al. 2009a; de Barros et al.2011; Chen et al.2013; Chuang et al. 2016). COMs are commonly detected in the earlier, protostellar
stage of star formation(Herbst & van Dishoeck2009). These molecules bridge simple species with those considered to be of prebiotic importance, e.g., amino acids. However, COMs in disks have proven elusive, partly because disks are small objects (spanning, at most, a few arcseconds) and partly because the outer regions of protoplanetary disks are generally cold, dense, and well-shielded from stellar radiation. The volatility of many COMs is similar to water ice(e.g., Öberg et al.2009a; Burke et al.2014); hence, COMs are expected to be frozen out onto dust grains throughout most of the disk. To date, only a single COM has been detected toward a protoplanetary disk: methyl cyanide, CH3CN, in the disk around the Herbig Ae star, MWC 480 (Teff»8000K). The
exact chemical origin of this molecule in disks is unclear; modeling suggests that the emission comes from thermal or non-thermal ice sublimation in the comet-forming zone(Öberg et al.2015b), which around a Herbig Ae disk extends out to at least 100 au.
The most common beacon of a rich organic chemistry at the early stages of star formation is CH3OH. Prior to this study, CH3OH had not yet been detected in protoplanetary disks. Other O-bearing complex organic species have also remained elusive. By contrast, disk chemistry models that include an active ice chemistry, as well as non-thermal desorption pathways, including photodesorption, predict that disks should contain large reservoirs of CH3OH and other oxygen-contain-ing COMs. Walsh et al. (2014b) determined that gas-phase CH3OH was a good ALMA target for the indirect detection of the complex organic ice reservoir, reaching a peak abundance of~10-9(relative to H
2)in disk layers that are exposed to UV
photons. These model calculations motivated a successful ALMA proposal, which has resulted in the first detection of gas-phase methanol in a nearby protoplanetary disk(TW Hya, 54 pc), the results for which are reported here.
2. OBSERVATIONS
The young star, TW Hya, was observed on 2015 January 02 with 39 antennas and baselines from 15 to 350 m (project 2013.1.00902.S, P. I. C. Walsh). The quasars J1256-0547 and J1037-2934 were used for bandpass and phase calibration, respectively, and Titan was used for amplitude calibration. The Band 7 (B7) methanol transitions listed in Table 1 were targeted using a channel width of 122 kHz (corresponding to 0.12 km s−1). A continuum-only spectral window at 317 GHz
(with a total bandwidth of 2 GHz)was also covered. The total on-source observation time was 43 minutes. All data were self-calibrated prior to imaging using CASA version 4.3 and the continuum band at 317 GHz, and using a timescale of 20 s(≈3 times the integration step). This increased the dynamic range of the continuum data by a factor of»30. Self-calibration using the continuum around the methanol lines between »304 and 307 GHz gave almost indistinguishable results. The rms noise level achieved for the 317 GHz continuum following imaging with CLEAN (Briggs weighting, robust=0.5) was 0.10 mJy beam−1, with a peak signal-to-noise ratio(S/N)of 4200. The continuum synthesized beam was 1 2×0 6(- 86 ). The line data were imaged without CLEANing (using natural weight-ing)following self-calibration and continuum subtraction, with a slight overgridding in velocity resolution (0.15 km s−1). The rms achieved in the dirty channel maps was»4 mJy beam−1 per velocity channel at all four frequencies.
TW Hya was also observed on 2014 July 19 with 31 antennas and baselines from 30 to 650 m (project 2013.1.00114.S, P. I. K. Öberg). The quasar J1037-2934 was used for both bandpass and phase calibration, and Pallas was used forflux calibration. The Band 6(B6)methanol transitions listed in Table 1 were targeted using a channel width of 122 kHz (corresponding to 0.15 km s−1), with a total band-width of 58.6 MHz per spectral window. The total on-source observation time was 41 minutes. The continuum was strongly detected(peak S/N»500), enabling self-calibration of the B6 data with CASA version 4.3 using the continuum within each respective spectral window, and a timescale of 30 s. This increased the dynamic range of the data in each spectral window by a factor of »3. The synthesized beam was
0 5 × 0 5 (- 89 ). Following self-calibration, the line data were continuum-subtracted and imaged to the same velocity resolution as the B7 data. An rms noise»5 mJy beam−1 per channel was achieved in the dirty channel maps at all three frequencies.
A significant signal was neither found in the individual channel maps of the B7 data nor the B6 data. The three B7 data sets at»304, 305, and 307 GHz(corresponding to the lowest energy transitions) were concatenated into a single measure-ment set following velocity regridding and then imaged using CLEAN with natural weighting (i.e., “stacked” in the uv domain). This resulted in a synthesized beam of 1 4 ×0 73
(- 84 )and an rms noise of 2.0 mJy beam−1, which is a factor of»2increase in sensitivity. A single round only of additional CLEANing was performed. Significant methanol emission is detected across six channels(3s) from 2.45 to 3.35 km s−1 reaching a peak S/N of5.5s. No significant signal was found in the stacked and imaged B6 data.
3. RESULTS
3.1. Detection of Gas-phase Methanol
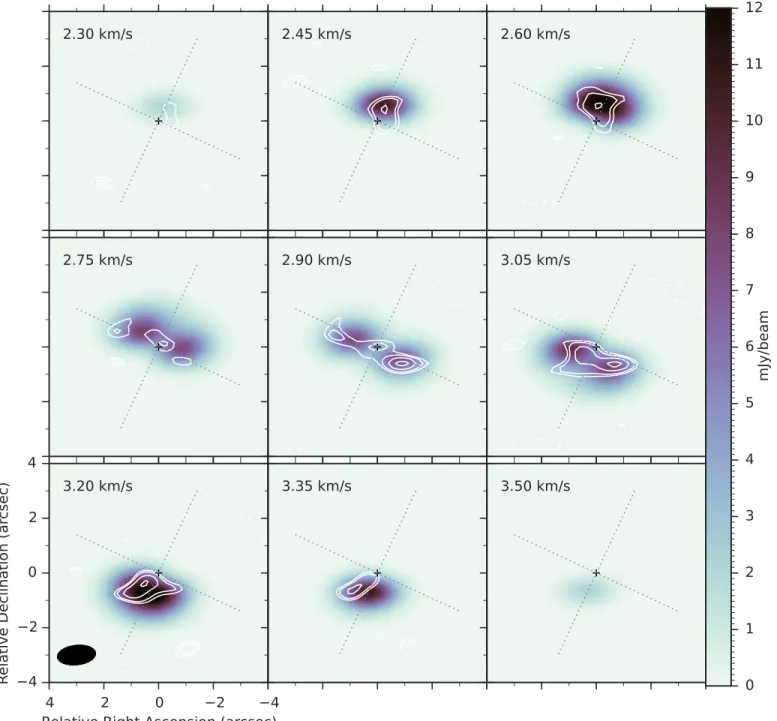
The channel map for the stacked B7 data is presented in Figure1. The inclination and position angle of TW Hya(7and
335 , respectively; Hughes et al.2011)are such that emission from the northwest and southeast is respectively blueshifted and redshifted in velocity, with respect to the systemic velocity
(2.9 km s−1, Hughes et al. 2011; Andrews et al. 2012). This kinematic structure is evident in the methanol channel map. In all channels in which emission is detected, the peak is offset from the stellar position, indicating that the emitting methanol is possibly located in a ring; however, there is significant emission(3s) at the source position. The detected emission appears to be compact compared with the extent of the continuum emission (»100 20au). This may be due to the low S/N, but we cannot exclude a real drop in the CH3OH abundance in the outer disk.
Figure2 shows the extracted line profile(dark red dashed lines in left panel) within the3s contour of the continuum, which is marked by the gray contour in Figure1. The peakflux density for the stacked line profile is 33 mJy and the rms noise is 6.5 mJy, resulting in a S/N of 5.1.
3.2. Constraining the Methanol Abundance
The spectrally and spatially resolved CH3OH emission is used together with an appropriate density and temperature structure to constrain the CH3OH abundance in the TW Hya disk. The low S/N of the B7 detection precludes more detailed modeling. The non-detection in complementary B6 data (see Table1)also provides additional constraints. We adopt the TW Hya disk physical structure from Kama et al. (2016) that reproduces the dust SED as well as CO rotational line emission from both single-dish observations and spatially resolved ALMA data. In Figure3we show the gas temperature, number density, dust temperature, and far-UV integratedflux.
Interstellar methanol is formed on or within icy mantles on dust grains via CO hydrogenation(Watanabe & Kouchi2002; Fuchs et al.2009; Boogert et al.2015). CH3OH has a similar volatility to water ice (e.g., Brown & Bolina 2007); hence, methanol should reside on grains throughout most of the disk
(T100K). A small fraction of methanol can be released at low temperatures via non-thermal desorption, which is
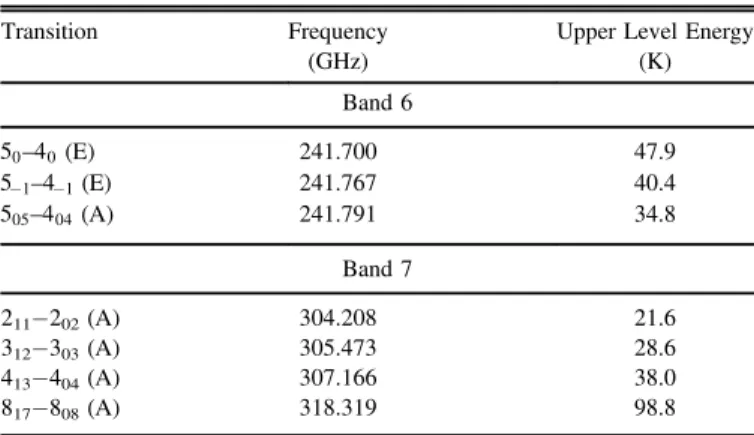
Table 1 Methanol Transitions
Transition Frequency Upper Level Energy
(GHz) (K)
Band 6
–
50 40(E) 241.700 47.9
–
-
-51 4 1(E) 241.767 40.4
–
505 404(A) 241.791 34.8
Band 7
211−202(A) 304.208 21.6
312−303(A) 305.473 28.6
413−404(A) 307.166 38.0
817−808(A) 318.319 98.8
triggered by energetic photons or particles or by energy released during exothermic chemical reactions (reactive desorption, e.g., Garrod et al. 2006). The rates for such processes remain relatively unconstrained except for a small set of molecules and reaction systems (e.g., Westley et al.1995; Öberg et al. 2009b; Fayolle et al. 2011; Bertin et al. 2013; Fillion et al. 2014; Cruz-Díaz et al. 2016; Minissale et al. 2016). It also remains a possibility that gas-phase chemistry contributes to the gas-phase abundance (e.g., Charnley et al. 1992; Garrod et al. 2006). For example, the rate coefficient for the OH +CH3OH gas-phase reaction was only recently determined to be rapid at low temperatures(<100
K, Shannon et al. 2013; Acharyya et al.2015).
Because the methanol chemistry applicable to disks remains relatively unconstrained, we adopt a parametric approach to constraining the location and abundance of gas-phase methanol in TW Hya. Methanol is assumed to reside in three different vertical layers: z r0.1, 0.1z r 0.2, and
z r
0.2 0.3, wherezandrare the disk height and radius, respectively(dashed lines in Figure3). A small grid of models was run in which the inner and outer radii of the emission were varied (in steps of 10 au), in addition to the fractional abundance of methanol (relative to H2). Ray-tracing calcula-tions were performed using LIME (LIne Modelling Engine, Brinch & Hogerheijde2010)assuming LTE, a disk inclination and position angle appropriate for TW Hya (Hughes
Figure 1.Channel maps for the stacked observed B7 CH3OH line emission. The white contours show the 2.5σ, 3.0σ, 4.0σ, and5.0slevels for the CH3OH data and
et al.2011), and the molecular datafiles for A-type and E-type methanol from the Leiden Atomic and Molecular Database
(http://home.strw.leidenuniv.nl/~moldata/). The modeled channel maps for each individual transition were produced using the same spatial and spectral resolution as the observa-tions and then stacked.
The results for the best“by-eye”fit to the data forz r 0.1 (i.e., the midplane) are shown in Figures 2 and 4. This is considered the fiducial model because the physical model
adopted has 99% of the dust mass in large(up to millimeter-sized) grains that are also well-settled to the midplane (see Kama et al.2016for details). A ring of methanol between 30 and 100 au, with a fractional abundance of2.8´10-12relative
to H2, reproduces both the shape and peak of the observed line profile, and the peak and radial extent of the channel maps. The estimated error on the abundance is »20%. If the fractional abundance of methanol is not constant, then the distribution may be more compact or extended than suggested here.
Figure 2.Left: line profile extracted from the stacked observed B7 CH3OH channel map within the3scontour of the 317 GHz continuum(dark red dashed lines)
compared with the stacked B6 and B7 model line profiles from the best“by-eye”modelfit forz r<0.1(light blue and purple lines, respectively). Right: best“ by-eye”fits for models in which methanol is present in different layers:z r0.1,0.1z r0.2, and0.2z r0.3. In all models, methanol is located between 30 and 100 au.
Figure 3.The TW Hya disk physical structure(Kama et al.2016). Top left, moving clockwise: gas temperature(K), gas number density(cm−3), UVflux(in units of the interstellar radiationfield), and dust temperature(K). The dashed black line delineates the layers within which gas-phase CH3OH is modeled to reside.
Keeping the radial location fixed and moving the methanol to higher layers in the disk results in fractional abundances of
´
-8.0 10 12 and 4.4´10-11, for 0.1z r 0.2 and z r
0.2 0.3, respectively(see the right panel of Figure2). The models suggest a peak column density of» -3 6 ´1012
cm−2at 30 au and reproduce the non-detection in the B6 data. Better data are required to constrain the vertical location of the methanol.
4. DISCUSSION
Based on the presented observations, methanol is unambigu-ously detected in the disk of TW Hya. However, the deduced abundances are up to two orders of magnitudes lower than
expected from recent disk chemistry models (e.g., Furuya & Aikawa 2014; Walsh et al. 2014b). The fractional abundance with respect to H2 ranges from» ´3 10-12 to» ´4 10-11,
depending on the location of the methanol (toward the midplane or higher in the molecular layer). Combining these values with a revisitation of the gas-phase water distribution in TW Hya, suggests that the CH3OH/H2O gas-phase ratio is
»0.7% if both species are located in the midplane, and
–
»0.9% 5.0% if both are located higher in the molecular layer
(Salinas et al.2016). The midplane ratio is low relative to the median interstellar and protostellar ice ratio (»5%, Boogert et al.2015); however, all values fall within the observed range for both protostars and comets (Mumma & Charnley 2011; Boogert et al.2015).
Figure 4.Channel maps for the best“by-eye”model B7 CH3OH line emission forz r0.1. The images have been convolved to the same beam size as the
The data and analysis also suggest that methanol is located in a ring, with a peak column density coincident with the location of the CO snowline as inferred from previous ALMA data
(»30 au, Qi et al. 2013). The emission is also relatively compact and peaks within the radial extent of the submillimeter dust disk. This supports the hypothesis that the ice reservoir in protoplanetary disks is hosted primarily on the larger dust grains that have become decoupled from the gas and have drifted radially inward toward the star (Andrews et al. 2012; Hogerheijde et al. 2016). Note that the simple modeling presented here suggests that the methanol emission may extend beyond the sharp drop in continuum intensity at »47 au
recently discovered by Hogerheijde et al.(2016). Higher spatial resolution data are needed to further constrain the radial distribution of methanol.
The CH3OH/H2O gas-phase ratio relative to that expected in the ice can shed light on whether or not both species share a common gas-phase chemical origin in disks. Possible candi-dates for releasing non-volatile ice species into the gas-phase include photodesorption by UV photons, or reactive desorption during formation. Irradiation by higher-energy photons and particles (keV) likely induces chemistry within the ice mantle, rather than the desorption of intact methanol (e.g., Bennett et al. 2007; de Barros et al. 2011; Chen et al.2013). Moreover, it has recently been shown that UV irradiation of pure and mixed methanol ice does not lead to the desorption of intact methanol, with only photofragments observed (Bertin et al.2016; Cruz-Díaz et al.2016). The derived upper limit for methanol photodesorption (10-6–10-5 molecules photon−1) is 2−3 orders of magnitude less efficient than that for water ice
(Westley et al. 1995; Öberg et al. 2009b). Detailed chemical modeling will be needed to determine whether such a low photodesorption rate is sufficient to maintain a detectable level in the TW Hya disk and reproduce the observed CH3OH/H2O gas-phase ratio. Adopting the analytical formula for the methanol abundance presented in Furuya & Aikawa (2014), the experimentally constrained photodesorption rate could account for the estimated gas-phase abundance. However, this should be tested using a physical model more applicable for TW Hya, which is colder and more settled than the T-Tauri disk structure used in Furuya & Aikawa (2014). Also to be explored is whether the release of photofragments into the gas-phase may seed methanol formation via gas-gas-phase chemistry.
Reactive desorption is another possibility (e.g., Garrod et al.2006). However, given that the disk inherits the bulk of its methanol ice from the dark cloud and/or protostellar envelope
(Drozdovskaya et al.2014), in order for reactive desorption to occur, the methanol ice needs to be converted back to H2CO or CO, and subsequently rehydrogenated. This can be achieved with UV photons (which likely has a low efficiency) or via surface hydrogen-abstraction reactions (e.g.,
⟶
+ +
CH OH3 H CH OH2 H2, Chuang et al.2016, and see
also Martín-Doménech et al. 2016). However, if the ice reservoir follows the millimeter-sized grains, as suggested by this study and others (e.g., Salinas et al. 2016), then the methanol ice may be concentrated toward the disk midplane, where both the H/H2gas-phase ratio and UV photonflux are relatively low.
Given that the CH3OH ice is likely associated with CO ice
(since it forms from the latter), then there is also the possibility that a fraction of CH3OH is released during CO ice sublimation at T17K (e.g., Martín-Doménech et al. 2014). In this
regime, one would expect that the CH3OH emission peaks at the location of the CO snowline(»30 au, Qi et al.2013), which is suggested in these data. However, this would indicate a different chemical origin for gas-phase CH3OH compared with H2O, with the former dependent upon temperature only, and the latter dependent upon the UV photon flux (assuming photodesorption as the origin). Higher spatial resolution data of multiple methanol transitions(to derive excitation information and thus the vertical location)will be critical for distinguishing between each chemical origin scenario.
The detection of gas-phase methanol in a protoplanetary disk presents a milestone in the investigation of the molecular inventory of disks, and provides much needed constraints on the viability of the detection of larger and more complex molecules. It also provides an intriguing piece of the puzzle regarding the large-scale depletion of CO gas in TW Hya, one of the explanations for which is the conversion of CO ice into more complex molecules, such as methanol(Favre et al.2013; Kama et al.2016; Nomura et al.2016). The detection of cold gas-phase CH3OH in TW Hya(and warm gas-phase CH3CN in MWC 480, Öberg et al.2015a)now allows an estimation of the likely abundances and resulting line strengths of species that are higher up on the ladder of complexity. Finally, the analysis presented here shows that the high quality of the ALMA data allows for the stacking of multiple transitions to enhance S/N, facilitating the detection and analysis of minor gas-phase species in protoplanetary disks.
We thank the anonymous referee for insightful comments that helped to improve this paper. This work uses the following ALMA data: ADS/JAO.ALMA#2013.1.00902.S and ADS/ JAO.ALMA#2013.1.00114.S. ALMA is a partnership of ESO
(representing its member states), NSF (USA), and NINS
(Japan), together with NRC (Canada) and NSC and ASIAA
(Taiwan), in cooperation with the Republic of Chile. The Joint ALMA Observatory is operated by ESO, AUI/NRAO, and NAOJ. C.W. acknowledges support from the Netherlands Organization for Scientific Research (NWO, program 639.041.335). E.H. acknowledges the support of the National Science Foundation for his program in astrochemistry, and support from the NASA Exobiology and Evolutionary Biology Program through a subcontract from Rensselaer Polytechnic Institute. Astrophysics at QUB is supported by a grant from the STFC. Y.A. acknowledges support from JSPS KAKENHI, grant number 23540266. K.I.Ö. also acknowledges funding from the Simons Foundation: Simons Collaboration on the Origins of Life (SCOL) Investigator award 321183. R.A.L. gratefully acknowledges funding from a National Science Foundation Graduate Research Fellowship. This work is supported by a Huygens fellowship from Leiden University and by the European Union A-ERC grant 291141 CHEMPLAN.
REFERENCES
Acharyya, K., Herbst, E., Caravan, R. L., et al. 2015,MolPh,113, 2243
ALMA Partnership 2015,ApJL,808, L3
Andersson, S., & van Dishoeck, E. F. 2008,A&A,491, 907
Andrews, S. M., Wilner, D. J., Hughes, A. M., et al. 2012,ApJ,744, 162
Arasa, C., Koning, J., Kroes, G.-J., Walsh, C., & van Dishoeck, E. F. 2015,
A&A,575, A121
Bennett, C. J., Chen, S.-H., Sun, B.-J., Chang, A. H. H., & Kaiser, R. I. 2007,
ApJ,660, 1588
Bertin, M., Fayolle, E. C., Romanzin, C., et al. 2013,ApJ,779, 120
Bertin, M., Romanzin, C., Doronin, M., et al. 2016,ApJL,817, L12
Boogert, A. C. A., Gerakines, P., & Whittet, D. C. B. 2015,ARA&A,53, 541
Brinch, C., & Hogerheijde, M. 2010,A&A,523, 25
Brown, W. A., & Bolina, A. S. 2007,MNRAS,374, 1006
Bruderer, S., van Dishoeck, E. F., Doty, S., & Herczeg, G. J. 2012, A&A,
541, 91
Burke, D., Puletti, F., Brown, W. A., et al. 2014,MNRAS,447, 1444
Charnley, S. B., Tielens, A. G. G. M., & Millar, T. J. 1992,ApJL,399, L71
Chen, Y.-J., Ciaravella, A., Munñoz Caro, G. M., et al. 2013,ApJ,778, 162
Chuang, K.-J., Fedoseev, G., Ioppolo, S., van Dishoeck, E. F., & Linnartz, H. 2016,MNRAS,455, 1702
Cruz-Díaz, G. A., Muñoz Caro, G. M., Martín-Doménech, R., & Chen, Y.-J. 2016, A&A, in press(arXiv:1605.01767)
de Barros, A. L. F., Domaracka, A., Andrade, D. P. P., et al. 2011,MNRAS,
418, 1363
Drozdovskaya, M., Walsh, C., Visser, R., Harsono, D., & van Dishoeck, E. F. 2014,MNRAS,445, 913
Dullemond, C. P., & Dominik, C. 2004,A&A,421, 1075
Dullemond, C. P., & Dominik., C. 2005,A&A,434, 971
Favre, C., Cleeves, L. I., Bergin, E. A., Qi, C., & Blake, G. A. 2013,ApJL,
776, L38
Fayolle, E. C., Bertin, M., Romanzin, C., et al. 2011,ApJL,739, L36
Fillion, J. H., Fayolle, E. C., Michaut, X., et al. 2014,FaDi,168, 533
Fuchs, G. W., Cuppen, H. M., Ioppolo, S., et al. 2009,A&A,505, 629
Furuya, K., & Aikawa, Y. 2014,ApJ,790, 97
Garrod, R., Park, I. H., Caselli, P., & Herbst, E. 2006,FaDi,133, 51
Herbst, E., & van Dishoeck, E. F. 2009,ARA&A,47, 427
Hogerheijde, M. R., Bekkers, D., Pinilla, P., et al. 2016,A&A,586, A99
Hughes, A. M., Wilner, D. J., Andrews, S. M., Qi, C., & Hogerheijde, M. 2011,
ApJ,727, 85
Kama, M., Bruderer, S., van Dishoeck, E. F., et al. 2016, A&A, submitted Martín-Doménech, R., Muñoz-Caro, G. M., Bueno, J., & Goesmann, F. 2014,
A&A,564, A8
Martín-Doménech, R., Muñoz-Caro, G. M., & Cruz-Díaz, G. A. 2016,A&A,
589, A107
Minissale, M., Dulieu, F., Cazaux, S., & Hocuk, S. 2016,A&A,585, A24
Mumma, M. J., & Charnley, S. B. 2011,ARA&A,49, 471
Nomura, H., Tsukagoshi, T., Kawabe, R., et al. 2016,ApJL,819, L7
Öberg, K. I., Furuya, K., Loomis, R., et al. 2015a,ApJ,810, 112
Öberg, K. I., Garrod, R. T., van Dishoeck, E. F., & Linnartz, H. 2009a,A&A,
504, 891
Öberg, K. I., Gúzman, V. V., & Furuya, K. 2015b,Natur,520, 198
Öberg, K. I., Linnartz, H., Visser, R., & van Dishoeck, E. F. 2009b,ApJ,
693, 1209
Öberg, K. I., Murray-Clay, R., & Bergin, E. A. 2011,ApJL,743, L16
Qi, C., Öberg, K. I., Andrews, S. A., et al. 2015,ApJ,813, 128
Qi, C., Öberg, K. I., Wilner, D. J., et al. 2013,Sci,341, 630
Salinas, V. N., Hogerheijde, M., Bergin, E. A., et al. 2016, A&A, in press (arXiv:1604.00323)
Shannon, R. J., Blitz, M. A., Goddard, A., & Heard, D. E. 2013,NatCh,5, 745
Walsh, C., Júhasz, A., Pinilla, P., et al. 2014a,ApJL,791, L6
Walsh, C., Millar, T. J., Nomura, H., et al. 2014b,A&A,563, 33
Walsh, C., Nomura, H., & van Dishoeck, E. F. 2015,A&A,582, A88
Watanabe, N., & Kouchi, A. 2002,ApJL,571, L173
Westley, M. S., Baragiola, R. A., Johnson, R. E., & Baratta, G. A. 1995,P&SS,