AN EVALUATION OF THE EFFECTS OF LEAD ON
THE BIODEGRADATION OF ORGANIC WASTES
*1B.O. SANYAOLU AND 2D.O. MBEGA
1Department of Civil Engineering, University of Maiduguri, P.O. Box 491,
Maiduguri
,
Nigeria.2Institute of Marine Sciences, Zanzibar. Tanzania *Corresponding author: [email protected];
softwater (Salvato et al., 2003). Much of the lead carried by river water is in the form of suspended solids.
The toxic effects of lead are dependent on the specie of organism, temperature, pH of the wastewater, and valence of lead.
Most industrial wastewaters first pass through a sewage treatment plant. This re-sults in the destruction of bacteria in such plants by trace amounts of lead thereby ren-dering the treatment plant ineffective (Huan and Diaz, 2009).
The process of oxygen utilization in the deg-radation of organic constituents present in wastewater or deoxygenation is markedly influenced by the concentration of heavy
ABSTRACT
This study constitutes an additional step in limiting the concentration of lead in wastewater effluent from waste stabilization ponds. The effects of lead on the biodegradation rate of organic wastes were investigated at lead concentrations of 0, 5, 10, 20, 30, 40, 50, 75, 100, 125, 150, 200mg/l in batch cultures. Several runs were in order to determine temperature effects. A model was proposed to pre-dict deoxygenation rate for different concentrations of lead at various temperatures. The model pa-rameters namely the ultimate BOD, reaction rate constant and lag time were optimized by ordinary least squares (OLS) using the modified Gompertz model. The ultimate BOD and lag time increased as lead concentration was increased. However the deoxygenation rate decreased as lead concentration increased. The deoxygenation rate and ultimate BOD had maximum values at optimum temperature range of 30.15-33.50 oC.
Keywords: Lead concentrations, biodegradation, organic wastes, biochemical oxygen demand.
INTRODUCTION
Lead is a bluish-white, silvery, grey metal. It is lustrous when freshly cut, with cubic, ge-ometry, crystal structure, and odourless. It is very soft and malleable, easily melted, cast, rolled, extruded, very resistant to cor-rosion and a poor conductor of electricity. It is a very stable metal although it dissolves in acid. Great care must be taken in han-dling lead as it is an accumulative poison (Sanders et al., 2007).
One characteristic of lead is its tendency to form compounds of low solubility with the major anions of natural water. The amount of lead that can remain in solution in water is a function of the BOD of the water and the dissolved salt content which is about 30µg/l in hardwater and about 500µg/l in
Journal of Natural Sciences, Engineer-ing and Technology ISSN- 2277 - 0593
metals such as lead (Plunkett, 1987). An understanding of the kinetics of deoxygena-tion at different concentradeoxygena-tion of heavy metal is of fundamental importance in water pollution control. It is also essential for effi-cient design and operation of oxygen utiliz-ing biological treatment processes. Further-more, since most municipal wastewater treatment facilities use biological treatment processes for stabilization of organic and inorganic substances in wastewater, it is necessary to understand the effects of lead and its toxicity on these processes, with a view to limiting its concentration in waste-water effluent treated in waste stabilization ponds.
In this paper, the effects of lead as a toxic substance on the biodegradation of organic wastes based on experimentation was inves-tigated. The effects of lead on the rate con-stant, k, the ultimate demand, BODu, the
lag time and גof the monomolecular deoxygenating expression was also exam-ined.
MATERIALS AND METHODS
The wastewater samples were collected from the effluent of oxidation ponds at University of Dar-es-Salaam. The oxidation ponds receive combined sewage from con-veniences located in student hostels, staff houses, offices, library, health center, work-shops and chemical wastes from laborato-ries.
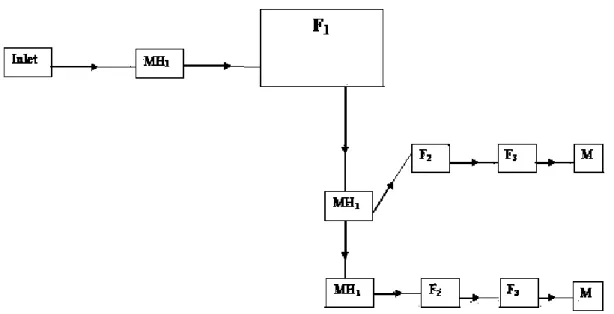
Fig. 1 shows a schematic diagram of the waste stabilization ponds at the University of Dar-es Salaam.
Samples were collected from the effluent of the primary facultative pond and analyzed immediately after dosing with a chemical in order to minimize the reduction of BOD
values. All laboratory examinations were car-ried out in accordance with standard meth-ods as laid out in APHA (1992).
BOD for each sample was measured using the manometric BOD measuring devices- OxiTopRIS12. Samples were first incubated
at fixed temperature by setting the incubator at the same temperature for each set of sam-ples. Experiments were conducted in dark conditions to prevent anaerobic conditions and photosynthetic reaction of algae as demonstrated by Mara (1974).
Bottles were filled with a wastewater sample of a specified volume. The volume of the sample placed in the bottle was determined by tests depending on the expected BOD and the readings multiplied to the scale fac-tor depending on the sample volume (see Azad, 1976).The bottles were then linked to a top pressure gauge. Oxidation of the sam-ple solution resulted in desam-pletion of the oxy-gen in the solution which was replaced by oxygen from the gas volume of the sample bottle. As the organic waste was oxidized, CO2 was formed and this moved to the gas
area. This created a negative pressure in the sample, which was recorded on the top pres-sure gauge. The fall in prespres-sure was propor-tional to the BOD of the sample. A magnetic stirring rod was inserted in each bottle to ensure oxygen and carbon dioxide exchange and two sodium hydroxide tablets were placed in the rubber quiver in the bottleneck to act as CO2 absorbent. The BOD was read
off from the calibrated top manometer in mg/l while the actual BOD values were the displayed measured values multiplied by the dilution factor.
In order to minimize the insufficiency of nu-trients in the primary facultative pond, the same test sample was employed throughout
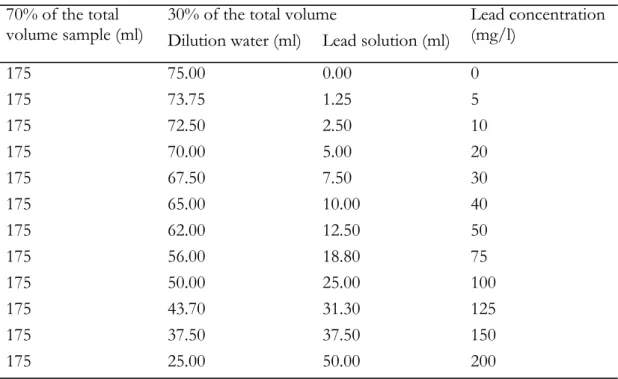
the duration of the investigation in form of diluted sample. Lead solution was added to the diluted water at different concentrations as shown in Table 1. These were thoroughly mixed together to form a uniform disper-sion of the nutrients and lead.
To examine the effects of lead on the deple-tion of oxygen, the mixture of diluted water and lead was introduced into the samples as 30% of the total volume (250ml). The incu-bator was set at 35oC. A second run was
done to determine the influence of lead concentrations at different temperatures.
The samples were divided into sixty portions of 250ml each. Out of sixty portions of sam-ples, five groups were selected. Each group contained twelve equal portions of diluted samples of 250ml. Each group was dosed with varying concentrations of lead ranging from 0-200mg/l. In each single group, each sample was kept at constant temperature of 20, 25, 30, 35 and 40oC. Each test run was
carried out for up to 12 days and records of BOD concentrations were taken every 2-6 hours.
Table 1: Measurements of the sample, dilution water and lead solution
70% of the total
volume sample (ml) 30% of the total volume Dilution water (ml) Lead solution (ml) Lead concentration (mg/l)
175 75.00 0.00 0
175 73.75 1.25 5
175 72.50 2.50 10
175 70.00 5.00 20
175 67.50 7.50 30
175 65.00 10.00 40
175 62.00 12.50 50
175 56.00 18.80 75
175 50.00 25.00 100
175 43.70 31.30 125
175 37.50 37.50 150
175 25.00 50.00 200
Modelling process
A FORTRAN Program was used to predict the BOD rate based on the modified Gompertz equation below.
The Gompertz model (also see Linton et al., 2006) uses three parameters namely, the ulti-mate biochemical oxygen demand, the rate constant and the lag time. The model was run with each concentration of lead applied giving consideration to the effects of temperature on BOD rate.
The objective function for the model was to minimize the sum of square of differences, F between the experimental and the estimated rate constants and the summation taken as
F= (y-y1) (2)
F = index of residual error y1 = model output estimate
y = experimental output.
The Nash and Sutcliffe model efficiency, R2 was used to analyze the performance of the
proposed model.
and R2 = Fo-F/Fo (3)
where
Fo = Initial variance = (yi- )2 (4)
and
is the mean of experimental data.
The reaction rate constant k was obtained from the Arrhenius expression as
K= A1e(-E1/RT)/[1+Ke(-E2/RT)] (5) where A1 = Constant, day-1
E1= Activated energy of the growth limiting reaction J/mole
T= Absolute temperature, oK
E2= enthalpy change for enzyme inactivation reaction ( J/mole)
K= dimensionless constant
∑
= n
i 1
∑
= n
i 1
−
y
−
RESULTS AND DISCUSSION
A non-linear analysis was used to fit a model for the BOD rate described in equa-tion (1) for the range of 0-200mg/l lead concentrations. The BOD rate was deter-mined for control sample (without lead) at 25oC (Fig 2). It was observed that there was
a sudden increase in the rate of deoxygena-tion up to a BOD value of 170mg/l. Be-yond this value, the deoxygenation rate was nearly zero. At 20oC and 125mg/l, BOD
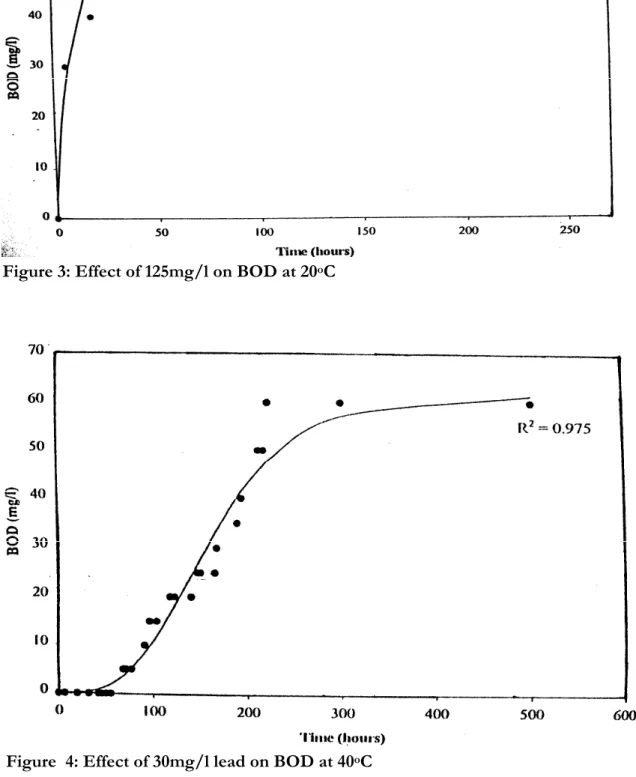
uptake was rapid in the early stages but no further uptake was observed after 50mg/l of organic material was biodegraded. No significant lag time was observed (Fig 3). Fig 4 shows deoxygenation rate for a con-trol sample at 40oC. The behaviour was
similar to results obtained at 25oC and 20oC.
However the ultimate BOD at 40oC was
considerably lower than the same at other temperatures. Lag time was observed to be larger when the lag time increased to 70.6hours from 25.9 hours in the absence of lead at the same temperature. In fact, lag time increased exponentially with increase in lead concentration.
The results showed that uptake of dissolved oxygen decreased as dosage of lead was in-creased. It was also observed that deoxy-genation rate and ultimate BOD increased as lead concentration increased.
Lag phase was clearly evident when unfa-vorable temperature and high lead concen-trations were applied. This may be attrib-uted to the fact that lead even at low con-centrations, significantly reduces the popu-lation of hetetotrophic bacteria in a batch culture ( Lester et al., 1979).
At 40oC, there was no deoxygenation
activ-ity in the sample with lead concentration of
more than 75mg/l.
Fig 6 shows the relationship between the lag time, λ and lead concentrations at tempera-ture 35oC. It was observed that as lead
con-centration increased, the lag time became smaller.
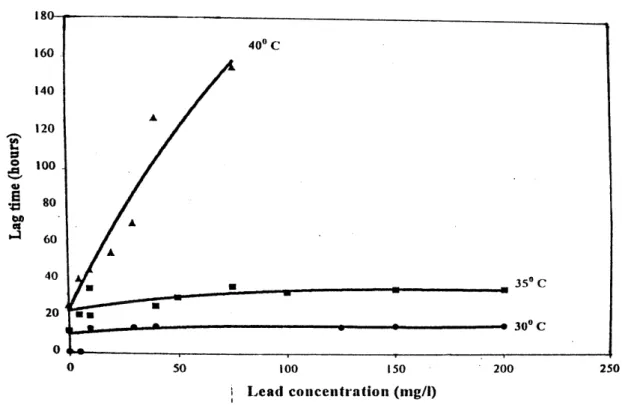
Fig 7 shows the effects of lead concentration and temperature on the lag time. It was evi-dent that the minimum lag time occurred at a temperature of about 30oC. It is probable
that at about 30oC, the temperature is
opti-mal for growth of microorganisms. It was also evident that lag time increased sharply when temperature was raised to 40oC
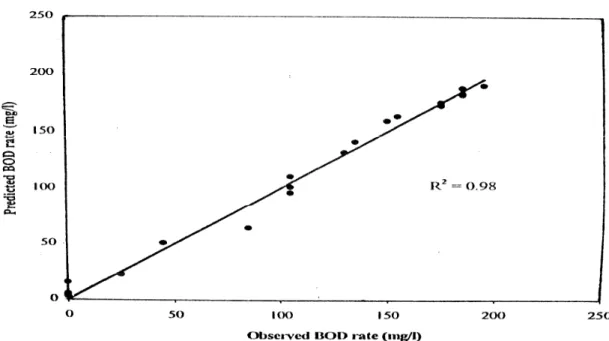
par-ticularly at higher lead concentrations. Figs. 8 and 9 show the goodness of fit be-tween the predicted and observed BOD rates at 35oC and 40oC respectively for lead
concentrations of 50mg/l. It was evident that the predicted BOD rate compared fa-vourably with the experimental data.
The values of BoDu, k,& גat 35oC were
then substituted in Gompertz equation (Equation 1). The resulting model was ob-tained as
BoDc=243.95(1+c)-0.27[exp{-exp(0.0286
(1+c)0.15)( —גt)+1}]
where c= concentration of lead
The efficiency R2 of the model was found to
be 0.95. The predicted and observed BOD rate are shown in Figs. 8 and 9.
Equation 5 was used to model the effect of temperature on the rate of deoxygenation. Based on this the optimum temperature was obtained from
Topt=E2/R In[k(E2/E1-1)]
This was found to be in the range of 30-33oC.
Figure 1: Schematic diagram of the waste stabilization ponds at the University of Dar-es-Salaam
MH1, MH2, MH3 –manholes 1,2 and 3.
F1- primary facultative pond. F2 & F3- secondary facultative ponds M- maturation ponds.
Figure 3: Effect of 125mg/l on BOD at 20oC
Figure 5: Lag time against lead concentrations at 30, 35 and 40oC
Figure 7: Scatter plot of the predicted versus observed BOD rate at 35oC and lead concentrations of 50mg/l
Figure 8: Scatter plot of the predicted versus observed BOD rate at 40oC and lead concentrations of 50mg/l
CONCLUSION
Biodegradation rate of organic wastes due to varying lead concentrations was investi-gated. The model below proposed for a temperature of 35oC is of the form:
BoDc=243.95(1+c)-0.27[exp{-exp(0.0286
(1+c)0.15)( —גt)+1}]
The BOD rate predicted compared with the experimental data with a model efficiency of 95%. Due to increase in lead concentra-tion, there was a decrease in ultimate BOD, and deoxygenation rate k and an increase in lag time λ during the initial stages of incuba-tion.
The optimum temperature was determined to be in the range of 30.15-33.50oC.
REFERENCES
Azad, H.S. 1976. Industrial wastewater man-agement handbook.1st edition, McGraw Hill
publ. co. New Delhi.
APHA. 1992. Standard methods for examina-tion of water and wastewater. American water-works association and water pollution con-trol federation. 18th edition.
Huan, C.T., Diaz, B.G. 2009. Influence of heavy metals on a mixed bacterial pollution of sewage origin. Asian J. of Water, Environ.
and Pollut., 6(8): 47-53.
Lester, J.N., Perry, R., Daad, A.H. 1979. The influence of heavy metals on a mixed bacterial population of sewage origin in the chemostat. Wat. Sci. Technol., 22: 19-21.
Linton, R.H., Carter, W.H., Pierson, M.D., Hackney, C.R. 2006. Use of a modi-fied Gompertz equation to model non-linear survival curves for listeria monocytogenes. J. offood protection, 58(9): 102-110.
Mara, D.D. 1974. Bacteriology for Sanitary Engineers. Churchill Livingstone, Edinburgh.
Plunkett, E.R. 1987. Handbook of Industrial toxicity 3rd edition. Edward Arnold Ltd.
Vic-toria. Australia.
Salvato, J.A., Nemerow, N.L., Agardy, F.J. 2003. Environmental Engineering, Fifth edi-tion. John Wiley and Sons Inc.
Sanders, P.S., Cook, J.E., Arttey, A.R. 2007. Hazards of lead to public health. J. of foodprotection, 70(3): 102- 110.