Evaluating Wetland Function Using
Geographic Information Systems:
A Method for Land-Use Planning
by
Benjamin Owen Bearden
A Master’s Project submitted to the faculty of the University of North Carolina at Chapel Hill
in partial fulfillment of the requirements for the degree of Master of Regional Planning in the Department of City and Regional Planning
Chapel Hill 2003
Approved by:
Table of Contents
Introduction………..…. 2
Principles and Concepts from the Literature……….……… 2
Wetland History……… 2
Wetland Definitions……….. 3
Wetland Characteristics………....……… 4
Hydrology………... 4
Soils………...………. 4
Vegetation……….……….. 4
Wetland Functions & Values ……….5
Methods of Evaluating Wetlands ……….. 6
Evaluating Wetlands Using GIS ………7
Methodology……….. 9
Purpose and Organization…..………...……….. 9
An Evaluation Method for the Booker Creek Watershed………. 9
Organization of Methodology ………9
Background………...………. 10
State of the Wetlands in Booker Creek Watershed………….……..……… 10
Procedure Overview ………..………10
User Requirements ………..……….….…………10
Data Requirements ………...……….………11
Assignments………13
Assignment 1: GIS-based Evaluation of Wetlands……..……….13
Assignment 2: Field Evaluation ………..…21
Assignment 3: Watershed Policy Framework………..…22
Results of Evaluation………...…23 Recommendations References
Introduction
Wetlands provide numerous benefits for natural and man-made environments. They help filter out pollutants from stormwater runoff, provide buffering capabilities against flooding, and provide a diverse ecosystem in which certain plants and animals thrive. Because of their ecological importance, the ability to evaluate the quality of a wetland is critical in order to protect, restore, and manage wetlands. Traditionally, wetland
assessments have primarily involved field-based evaluation methods. However, certain elements of a wetland evaluation can be determined off-site, prior to an in-field
evaluation. For this project, I use Geographic Information System (GIS) software to perform certain wetland evaluation elements for the purpose of improving the evaluation process. Specifically, I use readily available GIS data as a basis for determining certain indicators of the value of a wetland. The analysis is not intended to fully replace field evaluation techniques; a “hands-on” field evaluation of a particular wetland can reveal crucial details that would likely be overlooked in a strictly GIS-based evaluation. Instead, I outline a method that a land-use planner could use in a preliminary wetland evaluation for the purpose of making insightful decisions concerning where future development should occur and where it should be avoided.
Principles and Concepts from the Literature
Wetland History
Although highly valued and legally protected today, wetlands have not always been looked upon favorably. Because wetlands are not suitable for farming or development, and because they were seen as areas that harbor disease-carrying vectors such as
mosquitoes, society has, historically, viewed wetlands as obstacles to progress. It was not until the 20th century that people began to understand the numerous and diverse benefits of wetlands (Hammer,1992).
Before the 1970s, wetlands in the U.S. were drained and filled on a regular basis so the land they occupied could be used for farming and development (Mitsch and
Gosselink, 1993). Prior to the colonization of North America, about 215 million acres of wetlands existed in the U.S. (Hammer,1992). Over the last 300 years, an estimated 117 million acres of wetlands were lost in the contiguous United States (Kent, 1994). 9.1 million acres were lost from the 1950s to the 1970s alone (Mitsch and Gosselink, 1993). Today, approximately 109 million acres remain, and of those that remain, many are severely degraded (Hammer,1992; Kent, 1994).
Wetland Definitions
Wetlands, having characteristics of both land and water ecosystems, often elude a distinct, universally accepted definition. Wetlands vary widely among one another, reflecting the wide range of physical, chemical, and biological factors that ultimately define them (Smith, et al, 1995). Part of the problem of defining wetlands is that the boundaries of a wetland depend on ecological processes. Changes in land use, precipitation patterns, and geomorphology of the watershed can change the size and functional characteristics of a wetland over time. Because of these factors, wetlands are considered to be transitional lands – a situation which makes precise delineation of wetlands a complicated task (Kent, 1994).
Because wetlands are federally protected, however, wetlands need a precise definition, or at least one that can be universally applied to meet wetland protection goals. The key piece of legislation that addresses wetland protection is the Federal Water Pollution Control Act Amendments of 1972, better known as the Clean Water Act (CWA). CWA aims to protect the quality of United States’ waters and, in Section 404 of the Act, recognizes the importance of wetlands in achieving this goal. Section 404 requires that anyone who wishes to discharge fill materials into the waters of the United States must obtain a permit from an authorized agency such as the Army Corps of Engineers (Corps) or from a state agency with a U.S. Environmental Protection Agency (EPA) approval (NRC, 2001). CWA defines wetlands as follows:
The term ‘wetland’ means those areas that are inundated or saturated by surface or ground water at a frequency and duration sufficient to support, and that under normal circumstances do support, a prevalence of vegetation typically adapted for life in saturated soil conditions. Wetlands generally include swamps, marshes, bogs and similar areas (Kent, 1994).
The U.S. Fish and Wildlife Service, which created a national classification system in order to track wetland status in the U.S., defines wetlands as follows:
Wetlands are lands transitional between terrestrial and aquatic systems where the water table is usually at or near the surface or the land is covered by shallow water. For the purposes of this classification wetlands must have one or more of the following three attributes: (1) at least periodically, the land supports
Wetland Characteristics
The two previous definitions refer to three key parameters that ultimately characterize wetlands:
1.) the presence of water (wetland hydrology); 2.) the presence of wetland (hydric) soils; and 3.) the presence of wetland vegetation.
In the fields of wetland regulation, planning, and management, wetlands are described in terms of the physical, chemical, and biological processes they perform. These processes are functions of the three key wetland parameters (Kent, 1994; Smith, et al, 1995). Hydrology
Hydrology is, by far, the most influential parameter controlling the structure and function of a wetland. Whether the water source is surface water, groundwater, periodic flooding, or precipitation, the hydrology of the landscape in which the wetland resides ultimately determines the type of soils and plant life that will comprise the wetland. The rate of flow of water into and out of a wetland controls the rate of nutrient cycling as well as the rate of decomposition in the wetland, which contribute to the creation of hydric soils characteristic of wetlands. Certain plants, in turn, are specifically suited for the saturated conditions of hydric soils and would not be able to survive in other conditions (Hammer, 1992; Kent, 1994).
Soils
Wetland, or hydric, soil is another key parameter describing wetlands. An organic upper layer and mineral lower layers characterize hydric soils. These soils provide a substrate for the chemical processes performed in wetlands and can store the minerals and nutrients needed for wetland plant survival. Hydric soils are formed when soils are saturated with water through the plant root zone during growing season, isolating pores in the soil from oxygen. This saturation results in the formation of a mainly anaerobic environment, with a thin layer of oxygen located around plant roots which provides a small area that supports aerobic reactions. Having this interface of aerobic and anaerobic conditions not only provides the necessary environment for creating hydric soils, it also allows for a variety of chemical processes, both anaerobic an aerobic, to occur. These chemical processes aid in the transformation of nutrients into forms useful for wetland vegetation and can decompose pollutants into less harmful forms (Hammer, 1992). Vegetation
Wetland Functions & Values
As previously mentioned, wetlands can perform a variety of functions, including aquatic and wildlife habitat, retention of sediments and toxicants, water storage, nutrient uptake, and groundwater recharge. Wetland function can be described as the actual processes the wetland performs, regardless of the direct benefit the wetland provides for society (Kent, 1994; Hammer, 1992). However, because certain wetland functions do benefit humans, wetlands are legally protected. The benefits derived from a wetland can be considered public goods, and can, therefore, be interpreted as the value of a wetland (Smith et al, 1995). Value establishes the worth, and, in turn, the importance of wetland function. Additionally, human perceptions, the location of a particular wetland, the development pressures on it, and the extent of the resource all help determine a wetland’s value. When wetland functions become interpreted as values, these values can be used in wetland decision-making processes. In fact, Section 404(b) of the CWA requires that impacts to wetland values be considered before a permit to dredge and fill a wetland can be issued. Understanding the connection between wetland function and value is critical, because a change in wetland function and value affects the policies used to monitor and manage wetlands (Kent, 1994; Mitsch and Gosselink, 1993).
A variety of methods exist that researchers have used to classify and measure these values. For example, Hammer divides wetland values into 6 broad categories:
1.) Life support –The value of a wetland based on its ability to support all life forms including microbes, plants, and animals.
2.) Hydrologic modification – The value of a wetland based on a wetland’s ability to perform the functions of flood water storage, groundwater discharge & recharge, and other physical influences on hydrology.
3.) Water quality changes – The value of a wetland based on its ability to perform addition/removal of biological, chemical, and sedimentary substances, changes in dissolved oxygen, pH, and other biological or chemical influences on water. 4.) Erosion protection – The value of a wetland based on its ability to stabilize banks
and shorelines as well as alter patterns and velocity of flowing water.
5.) Open space and aesthetics – The value of a wetland based on its ability to provide opportunities for outdoor recreation, environmental education, research, and an aesthetically pleasing environmnet.
6.) Geochemical storage – The value of a wetland based on how well it can store minerals such as carbon, sulfur, iron, and manganese (Hammer, 1992). On the other hand, Kent argues that the following 5 functional criteria can be used to determine wetland value:
1.) Biology – This value is assessed based on the diversity of vegetation and wildlife in the wetland as well as the amount of food produced by the wetland.
2.) Hydrology – This value is assessed based on water depth throughout the wetland, wetland flow rates and patterns, the ability of a wetland to store excess flood waters and improve natural water quality, the wetland’s contribution to
3.) Pedology – This value is an assessment of how well soils in wetlands bind certain chemicals, retaining them in the soil and preventing them from entering into waterways where they could be contaminants.
4.) Morphometry – This value is a measure of the external form of a wetland which includes a wetland’s location, drainage area, surrounding land use, surface area, and slope of surrounding land.
5.) Cultural Values – These values include measuring the consumptive and non-consumptive uses of wetlands. (Kent, 1994)
Regardless of the classification, wetland functions need a system of evaluation so that their value can be better understood.
Methods of Evaluating Wetlands
Any assessment of the value of a wetland must be based on the ability of a wetland to perform a valued function. Each wetland is unique in the functions it performs, making the assessment of wetland value a complicated task. However, because wetlands are defined by soils, vegetation, and hydrology, a measure of each should be considered when determining wetland value (Novitzki et al, 1997).
There are several methods used for evaluating wetlands. The US Army Corps of Engineer's Wetland Research Program reviewed 17 of these methods and grouped the evaluation criteria they use into four broad categories: Hydrology/water quality, landscape integrity, fish and wildlife habitat, and recreation/aesthetic criteria (WRP, 1994). One commonly used assessment, the Hydrogeomorphic Method, evaluates relative wetland function using the wetland’s size and Functional Capacity Index (FCI). The FCI assigns wetlands of the same regional subclass a score between 0.0 (lowest) to 1.0 (highest) based on the wetland's ability to perform a particular function (Smith et al, 1995). Another evaluation method, the Wetland Rapid Assessment Procedure, assigns a score of 0, 1, 2, or 3 to each of six variables - wetland utilization, wetland overstory/shrub canopy, wetland vegetation ground cover, adjacent upland support/wetland buffer, field indicators of wetland hydrology, and water quality input and treatment systems - based on a wetland's ability to meet the specified criteria for each variable. The scores are added together and divided by the sum of the maximum possible scores for each wetland
Evaluating Wetlands Using GIS
GIS is a powerful tool land-use planners can use for preliminary evaluation of sensitive environmental areas because it allows planners to integrate a variety of spatial data sets (Kaur et al, 2002). For example, remote sensing data can help establish biologically important parameters such as vegetation cover, which serves as wildlife habitat in wetlands (Prasad et al, 2002). Data can be merged through spatial query and overlay analysis, and valuable land resources, such as wetlands, that might be converted for development in a growing urban area can be identified and evaluated (Sundaram, 2002). Currently, the National Oceanic and Atmospheric Administration (NOAA) Coastal Services Center is developing a GIS-based evaluation of wetlands using the “North Carolina Coastal Region Evaluation of Wetland Significance (NCCREWS)” method. NCCREWS evaluates a wetland’s significance based on its relative contribution to water quality, hydrology and habitat functions. This method, called “Spatial Wetland
Assessment for Management and Planning (SWAMP)," evaluates certain wetland parameters such as wetland boundaries and types, landcover/vegetation type, soils data, hydrography, and watershed boundaries and assigns a weighting scheme with higher weights attributed to more significant wetland functions (Sutter and Cowen, 2000). The Arkansas Multi-Agency Wetlands Planning Team (MAWPT) has also developed a GIS-based methodology for evaluating wetland functions using eight steps: 1) Gather appropriate GIS data, 2) quality-check maps with field observation, 3) overlay maps to find relationships among them, 4) develop wetland goals and priorities, 5) quantify objectives, design a ranking scheme accordingly, and spatially analyze data using overlay analysis to find relationships between variables, 6) evaluate the ranking system by
A GIS-Based Methodology for Evaluating Wetlands
Purpose and Organization
An Evaluation Method for the Booker Creek Watershed
This methodology focuses on assessing the value of wetlands in the Booker Creek Watershed in Chapel Hill, North Carolina. This watershed was chosen because it is representative of an impaired urban watershed. The North Carolina Department of Environment and Natural Resources (NCDENR) has classified Booker Creek as an impaired watershed with low water quality and damaged instream habitat. As the streams in the watershed flow through urban and suburban sections of Chapel Hill, the water quality declines severely, with instream degradation resulting from urban nonpoint source pollution (NCDENR, 2000). In such a watershed, a well-functioning wetland would be considered valuable for mitigating some of the negative impacts from development. Existing methods of wetland evaluation, including GIS-based analyses, provide some guidance as to how to proceed with a wetland evaluation. However, while such analyses provide a general framework within which to work, a method suited to North Carolina is needed to evaluate Booker Creek Watershed. The Guidance for Rating the Values of Wetlands in North Carolina is the underlying basis for this GIS-based evaluation. The method laid out in this section uses the Guidance because it is used in making decisions concerning whether or not to grant Section 404 permits in North Carolina. In addition, the Guidance uses a point system based on an EPA-funded study, and this point system can be easily incorporated into a GIS-based ranking system (NCDENR, 1995). Because of the vast amount of criteria that can be used to evaluate a wetland, the GIS portion of the evaluation method is limited to criteria that can be derived from existing and available data and is intended as one component in an overall wetland assessment methodology. A field analysis will also be necessary for a complete wetland evaluation in order to verify and supplement the existing data and to make final wetland policy recommendations (MAWPT, 2002; Sutter and Cowen, 2000).
Organization of Methodology
This methodology consists of three main components:
1.) Background information on wetlands within the Booker Creek watershed
2.) A procedure which can be used to assess the value of wetland function within the context of a watershed
Background
The State of Wetlands in the Booker Creek Watershed
Assessing wetland functions begins with understanding the current characteristics of wetlands in the Booker Creek Watershed. As mentioned previously, the Booker Creek Watershed is an impaired watershed located in an area that has undergone a recent surge in development. Many small, permanently flooded, isolated palustrine wetlands with little vegetation cover are scattered throughout the watershed. A few larger, forested palustrine wetlands surround the lower reaches of Booker Creek, but these are only flooded during brief periods over the year and have been partially drained. The major exception to the trend of small palustrine wetlands is the large lacustrine wetland that defines Eastwood Lake. Man-made barriers have formed most of the wetlands in the watershed, with the exception being the wetlands near the Booker Creek outfall. Whether man-made or naturally formed, the wetlands remaining in the Booker Creek Watershed provide valuable functions that help mitigate the effects of this urbanized watershed. Procedure Overview
The procedure evaluates and assigns a score for six general wetland values: 1.) Water storage
2.) Bank/shoreline stabilization 3.) Pollutant removal
4.) Wildlife habitat 5.) Aquatic life
6.) Recreation/education
Each value is assessed based on quantifiable criteria and results in a numeric score for each value. Value scores are not only based on the ability of a wetland to perform a function, but also on the opportunity the wetland has to perform a function. Hence the method treats wetland “value” as the benefit to society that a wetland provides and evaluates the wetland accordingly. The scores for each value are then summarized, resulting in a score for overall wetland function. The scores are then used to compare the relative value of all wetlands in the Booker Creek Watershed.
User Requirements
The wetland assessment procedure described in this methodology requires the use of the ArcGIS software package, providing the evaluator with an application for his or her basic spatial analysis skills. All maps used in the procedure are displayed in Appendix B, and a reference manual detailing specific steps is included in Appendix C. A general reference manual for ArcGIS may also be necessary in the event that questions or problems arise that are not covered elsewhere in this manual.
Data Requirements
Map 1: National Wetland Inventory (NWI) Classifications
This map depicts the location and classification of wetlands in the Booker Creek watershed, and is available for downloading from the National Wetland Inventory site (http://wetlands.fws.gov). The classification system used by NWI allows the evaluator to characterize a wetland’s system, the dominant vegetative structural life form, hydrologic regime, and substrate. This data typically provides the greatest level of detail and
accuracy in identifying wetlands and requires the least amount of expertise (Kent, 1994). For a detailed description of the NWI classification system, see Appendix A.
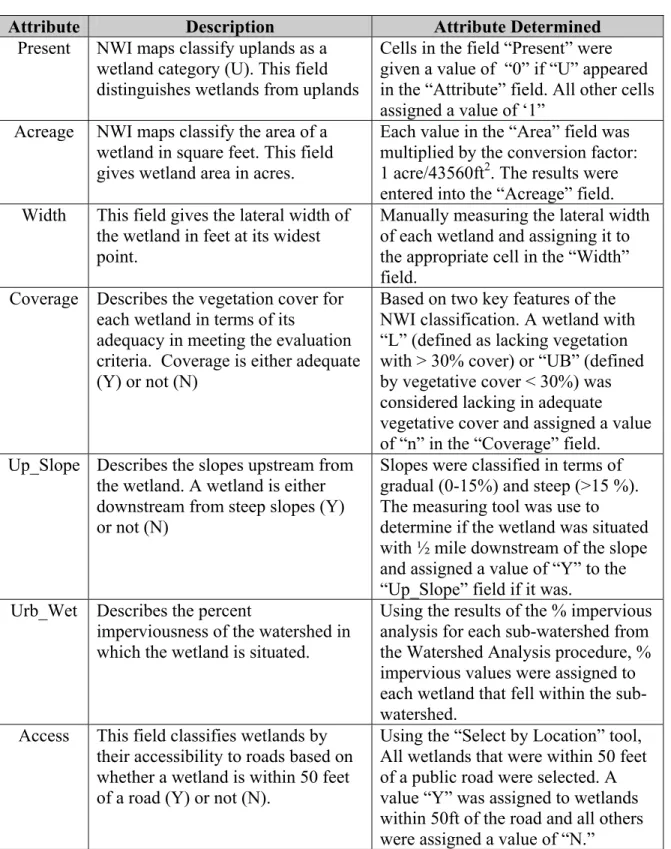
Note: For certain analyses in this procedure, it was necessary to supply additional fields to the NWI attribute table. These fields include attributes that:
• Distinguish wetlands from uplands (Present), • Describe wetland area in acres (Acreage), • Describe the width of a wetland in feet (Width), • Describe a wetland’s vegetative coverage (Cover),
• Describe the slopes upstream from the wetland (Up_Slope),
• Describe the imperviousness of the wetland’s watershed (Urb_Wet) • Determine if a wetland is accessible to the public (Access)
Table A2 in Appendix A details the process used to formulate these additional attributes. Map 2: Booker Creek Watershed Subbasins and Hydrology
This map depicts the major hydrologic features as well as the sub-watersheds that comprise the Booker Creek Watershed. The sub-watersheds were delineated using the ArcView 3.2 and a series of scripts developed at the University of Texas at Austin. The data sets used to create this map are based on 1998 aerial photographs of Orange County produced by Atlantic Engineering and are available from the UNC-Chapel Hill Division of Facilities Planning and Construction.
Map 3: FEMA Floodplain
wetland to mitigate flood risk. Floodplain maps are readily available from the Town of Carrboro’s GIS website (http://www.ci.carrboro.nc.us/gis/towndownload.htm).
Map 4: Booker Creek Roads
Selected roads are shown with delineated subbasins for orientation purposes as well as for determining the accessibility of wetlands for educational or aesthetic purposes. The datasets used to create this map are based on 1998 aerial photographs of Orange County produced by Atlantic Engineering and are available from UNC-Chapel Hill Division of Facilities Planning and Construction.
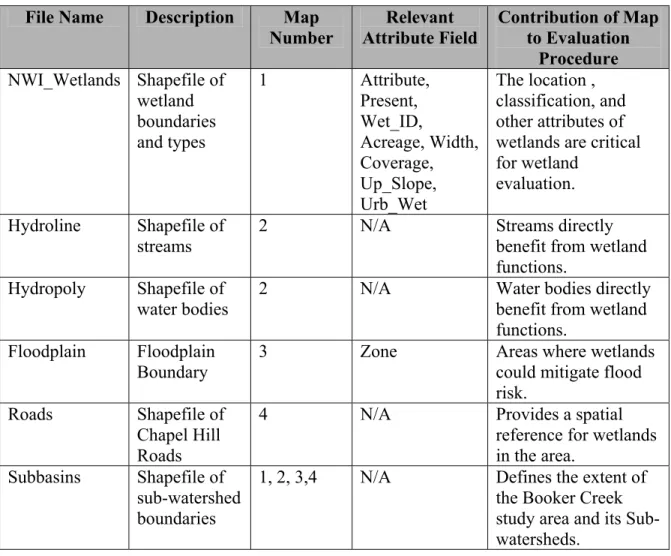
Table 1 identifies and summarizes the map data necessary to perform this evaluation.
Table 1: Summary of Necessary Map Data
File Name Description Map
Number Attribute Field Relevant Contribution of Map to Evaluation Procedure NWI_Wetlands Shapefile of
wetland boundaries and types 1 Attribute, Present, Wet_ID, Acreage, Width, Coverage, Up_Slope, Urb_Wet
The location , classification, and other attributes of wetlands are critical for wetland
evaluation.
Hydroline Shapefile of
streams
2 N/A Streams directly
benefit from wetland functions.
Hydropoly Shapefile of
water bodies 2 N/A Water bodies directly benefit from wetland functions.
Floodplain Floodplain
Boundary 3 Zone Areas where wetlands could mitigate flood risk.
Roads Shapefile of
Chapel Hill Roads
4 N/A Provides a spatial
reference for wetlands in the area.
Subbasins Shapefile of
sub-watershed boundaries
GIS-based Wetland Evaluation Procedure Overview
This procedure is set up as a series of questions that will be answered by applying GIS operations. The method takes on the form of a suitability analysis, in which a score that represents the most “suitable” areas actually represents the most highly valued wetlands. At the beginning of each step, the wetland is assigned the maximum number of points it can receive for the value determined in the step. Each question in the step represents criteria the wetland must meet in order to receive the maximum score. If the wetland does not meet the criteria, it loses a certain number of points. At the end of each step, the scores are classified and the wetlands are given a final score between 1 and 5. After scoring each step, the scores are summarized, resulting in an overall wetland score. A reference manual in Appendix C describes, in more detail, the specific spatial analysis procedures involved.
Note: In GIS there are often several ways to perform the same analysis. More advanced GIS users may wish to perform the procedure differently than presented here. However, this procedure has been successfully performed and the results have been documented for use as a basis for comparison.
Getting Started
Open a new ArcMap Project (or continue working on an existing project). Make sure the Spatial Analyst Extension is turned on and the Spatial Analyst Toolbar is showing (Spatial Analyst tools will be used extensively in the procedure). Also, set the Spatial Analyst working directory so that all layers generated will be saved in the same place. This procedure will require the following layers, so add them to your ArcMap Project:
• NWI_Wetlands • Floodplain • Hydroline • Hydropoly
• Subbasins (for referencing) • Roads (for referencing)
Examine the attribute tables to become familiar with the features each layer depicts. Alter the symbology of each layer so they display features of interest.
Note: This method generates a number of layers. Naming each layer something unique and descriptive will help you keep track of all of them. Names for each layer have been suggested; however, if you feel a more appropriate name applies to the layer, you are encouraged to use the name. Changing the name of a layer is accomplished by selecting the “General” tab in the layer’s properties.
Step 1: Evaluating Water Storage Value
to its ability to slow down and store excess floodwater, hence, contributing to the wetland’s value. Finally, the topography surrounding a wetland will determine how fast excess stormwater enters the wetland, which can determine how well the wetland can control the floodwater flow out of the wetland.
1.1 Setting up a “Wetland Units” layer
1.1.1 Convert the NWI Wetlands shapefile to raster based on the “PRESENT” field. Give the layer a distinct name such as “Wetland Units” and change the
symbology so that the value "0" is represented by “Uplands” and the value "1" is represented by “Wetlands.”
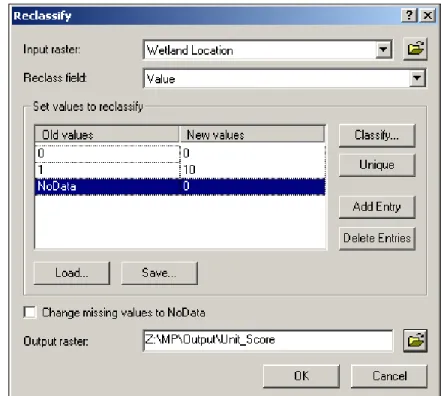
1.1.2 Reclassify the “Wetland Units” layer so that the values associated with
“Uplands” and “No Data” are reclassified to 0, and the value "1" is reclassified to 10. Give the new layer a distinct name such as “Wetland Unit Score.” Note: Setting a high value for wetland units allows wetlands to be distinguish from uplands in the final scoring of each value.
1.2 Is the wetland within 300 feet of surface water with signs of flooding?
1.2.1 Generate a 300 ft buffer around features in the “Hydroline” shapefile using the Buffer Wizard.
1.2.2 Using the Spatial Analyst toolbar, convert the buffer shapefiles to raster based on the attribute “BufferDist.” Be sure to change the symbology of the resulting raster buffer layer to reflect a “Unique Value.” This will assign the buffer distance (300) to all cells in the buffer area. Give the resulting grid layer a distinct name such as “300ft Buffer Grid.”
1.2.3 Convert the “Floodplain” features to raster based on the attribute “zone.” Using the NWI Wetland Shapefile, verify which numbers correspond to the
appropriate zone designation and label them accordingly. Note: Zones are defined as follows:
X = Not in floodplain A, AE = 100-yr Floodplain X500 = 500-yr floodplain
1.2.4 Combine and reclassify the “Buffer” and “Floodplain” layers.
1.2.4.1 Reclassify the buffer grid so that the “300” value equals 1, and the “No Data” value equals 0. Give the resulting grid layer a distinct name such as “300ft buffer.”
1.2.4.2 Reclassify the floodplain grid so that areas in the floodplain equal 1, and areas outside the floodplain equal 0. Give the resulting grid layer a distinct name such as “Floodplain Present.”
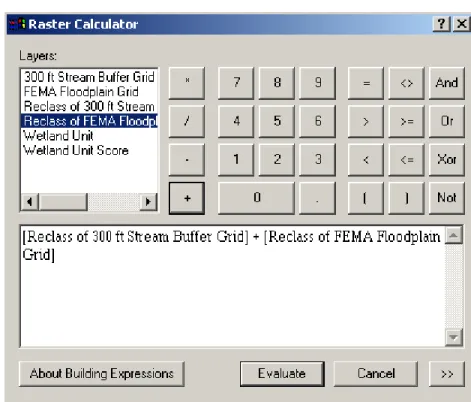
1.2.4.3 Using Raster Calculator, add the two reclassified data layers together. 1.2.4.4 Reclassify the resulting layer so that “0” and “no data” become -2 and each
1.3 Is the wetland greater than 100 feet wide?
1.3.1 Convert the NWI Wetland shapefile to raster based on the attribute “Width.” Give the layer a distinct name such as “Wetland Width.” Save this layer for use in future analyses.
1.3.2 When you reclassify, you will first need to group the old values into 2 classes representing 0-100, and > 100ft. This is done by clicking on “Classify” in the "Reclassify" dialogue box, selecting the “Method: Manual," and setting the first “Break Value” to 100. Reclassify “Wetland Width” so that “No Data” and “0-100” become -1, and all values >100 become 0. Give the resulting data layer a distinct name, such as “100ft Wetland Width Score,” and save this layer for use in future analyses.
1.4 Does the wetland have adequate vegetation coverage?
1.4.1 Convert the NWI Wetland shapefile to raster based on the field “Cover." Verify which numbers in the new grid layer correspond to the cover description of “Yes” and “No.” Give the layer a distinct name such as “Vegetation Cover Adequate.”
1.4.2 Reclassify “Vegetation Cover Adequate” so that the value associated with “Yes” equals 0, and all other values equal –1. Give the resulting grid layer a distinct name such as “Vegetation Cover Score.”
1.5 Is the wetland within ½ mile downstream from steep slopes?
1.5.1 Convert The NWI Wetland shapefile to raster based on the field “Up_Slope.” Give the layer a distinct name such as “Steep Slopes Upstream,” and verify which numbers in this new raster grid correspond to the up_slope description of “Yes” and “No.”
1.5.2 Reclassify “Steep Slopes Upstream” so that the value associated with “No” becomes 0 and all other values become –1. Give the resulting grid layer a distinct name such as “Steep Slopes Score,” and save the layer for use in future analyses.
1.6 Is the wetland greater than two acres?
1.6.1 Convert NWI Wetland shapefile to raster based on the field “Acreage.” Give the resulting layer a distinct name such as “Wetland Acreage,” and save for future analyses.
1.6.2 To reclassify this layer, you will need to group features in this layer into two classes representing 0-2 acres, and > 2 acres (see 1.3.2). Reclassify “Acreage” so that all wetlands > 2 acres become 0 and all other values become -1. Give the resulting layer a distinct name, such as “Wetland Acreage Score: >2 Acre” 1.7 Calculate Water Storage Value
1.7.1 Using Raster Calculator, add together all the scored data layers in this step, including the wetland unit layer.
1.7.3 Give the results of the calculation a distinct name such as “Water Storage Value Score,” and save the layer for use in calculating the overall wetland score. Step 2: Evaluating Streambank Stabilization
In this step you will assess the value of a wetland’s contribution to preventing stream bank erosion. Bank stabilization, in this evaluation, refers to the ability of a wetland to protect shorelines of streams and other water bodies from erosive force. The value will also take into consideration the opportunity of a wetland to mitigate erosive forces. A wetland should be contiguous to the shoreline if it is to be effective at slowing the flow of surface water into the stream network. Watersheds with high impervious surface cover contribute higher rate of stormwater flow, which can erode stream banks. Therefore, wetlands in such watersheds are rated higher.
2.1 Is the wetland contiguous to a streambank?
2.1.1 Using the NWI Wetlands data, select all wetlands that intersect with the “Hydrography” data layer. Generate a new shapefile containing just these
wetlands by right-clicking on the NWI wetlands layer and selecting “Selection > Create Layer From Selected Features.”
2.1.2 Convert this new shapefile to raster based on the “Present” field. Give the layer a distinct name such as “Wetlands on Streambanks.”
2.1.3 Reclassify the resulting grid layer so that all values of “0” or “no data” are given the value of –5. Give the resulting layer a distinctive name such as “Wetlands on Streambanks Score.”
2.2 Is the wetland within 50 ft of the streambank?
2.2.1 Generate a 50-ft buffer around all streams, using the “Hydrogaphy” shapefile as the input layer. Also, generate a 50ft buffer around all water bodies. Be sure to select the buffer option that allows you to fill in the polygon.
2.2.2 Merge the two buffer shape files together using the “Geoprocessing Wizard > Merge” tool.
2.2.3 Convert the resulting buffer to raster based on the feature “bufferdist.”
2.2.4 Reclassify the buffer grid so that the “50” value becomes 0, and the “No Data” value equals -1. Give the resulting layer a distinct name such as “50ft Buffer Score.”
2.3 Is the wetland in an urbanized sub-watershed (>10% imperviousness)?
2.3.1 Convert the “NWI Wetland” shapefile to raster based on the “Urb_Wet” field. Give this layer a distinct name such as “Urban Wetlands.”
2.3.2 Reclassify the resulting grid layer so that all wetlands associated with sub-watersheds of > 10% impervious area are assigned a value of 0, and wetlands associated with sub-watersheds of < 10 % imperviousness are given a value of –1. Give this layer a distinctive name such as “Urban Wetland Score.”
2.4 Is the wetland in a sub-watershed with steep slopes?
2.5 Is the total width of the wetland greater than 80 ft?
2.5.1 Use the “Wetland Width” grid layer generated in Step 1.4.1. 2.5.2 Classify features into 2 classes representing 0-80, and > 80.
2.5.3 Reclassify “Wetland Width” so that >80 ft becomes 0, and all other values become –1. Give the resulting layer a distinct name such as “80ft Wide Wetland Score.”
2.6 Calculate Bank Stabilization Value
2.6.1 Using Raster Calculator, add together all the scored data layers for this step, as well as the “Wetland Unit” layer generated in step 1.1.
2.6.2 Reclassify the resulting data layer so that:10=5; 9=4; 8=3; 7=2; 6=1; ≤ 5 = 0 2.6.3 Give the resulting layer of the calculation a distinct name such as “Bank
Stabilization Score.” Save this layer for use in the overall wetland evaluation. Step 3: Evaluating Pollutant Removal
This step will assess a wetland’s opportunity and ability to filter out pollutants from stormwater runoff. The opportunity value primarily depends on land uses present in the watershed as well as a wetland’s position in the landscape. A wetland situated between urbanized areas and the stream network will have a better opportunity to filter out pollutants than a wetland in a pristine area. A wetland’s ability to filter out pollutants depends on the extent of vegetation in the wetland, wetland width, and the topography of the wetland’s watershed. More vegetation provides more resistance to water flow,
slowing down flow and allowing sediments and pollutants to fall out of the water column. 3.1 Is the wetland within 300 feet of surface water with signs of flooding?
3.1.1 Use layer “300ft Buffer and Floodplain Score” generated in step 1.2.4.4. Reclassify the data layer so that –2 and “No Data” become –1. “0” should remain “0” when reclassified. Give the resulting layer a distinctive name such as “Floodplain and Buffer Score – Pollution.”
3.2 Is the wetland in an urbanized sub-watershed (>10% imperviousness)? 3.2.1 Use the layer “Urban Wetland Score” generated in Step 2.3.2. 3.3 Does the wetland have adequate vegetation coverage?
3.3.1 Use the grid layer “Vegetation Coverage Score” generated in Step 1.4.2. 3.4 Is the wetland in a sub-watershed with steep slopes?
3.4.1 Use the grid layer “Steep Slopes Score” generated in Step 1.5.2. 3.5 Is the wetland greater than 100 feet wide?
3.5.1 Use the data layer “100ft Wetland Width Score” generated in step 1.3.2. 3.6 Calculate Pollution Removal Value.
3.6.2 Reclassify the resulting data layer so that: 10=5; 9=4; 8=3; 7=2; 6=1; ≤ 5 = 0 3.6.3 Give the result of the calculation a distinct name such as “Pollution Removal
Score,” and save this layer for the final assessment. Step 4: Evaluating Wildlife Habitat
While important to the overall wetland evaluation, determining the quality of wetland habitat is best done by using field-based identification methods. However, a very general assessment of the quality of wetland habitat can be derived from the outcome of the following procedure. In general, wildlife habitat viability is based on the size of the habitat and its ability to provide food for wildlife. Therefore, this evaluation is based on the following factors that can be derived from the available map data: wetland type, vegetation cover, size, and width.
4.1 Does the wetland have good vegetation cover?
4.1.1 Use the layer “Vegetation Cover Score” generated in 1.4.2. 4.2 Is the wetland a bog, fen or other type of palustrine wetland system?
4.2.1 Convert the “NWI Wetlands” shapefile to raster based on the field “Attribute.” Using the NWI Wetland shapefile, rename the values so they reflect the NWI classifications. Give the layer a distinct name such as “NWI Wetlands Grid,” and save for future analyses.
4.2.2 Reclassify the resulting grid file so that values associated with palustrine wetlands (P) become “0” and all other values become –1. Give the resulting layer a distinct name such as “Palustrine Wetland Score” and save for future analyses.
4.3 Is the wetland forested?
4.3.1 Use the grid layer “NWI Wetlands Grid,” generated in step 4.2.1.
4.3.2 Reclassify the resulting grid file so that values associated with forested wetlands (FO) become “0” and all other values become –1. Give the data layer a distinct name such as such as “Forested Wetland Score.”
4.4 Is the wetland 600 ft wide?
4.4.1 Use the layer “Wetland Width” generated in step 1.3.1. Group features into 2 categories representing 0-600, and > 600ft.
4.4.2 Reclassify “Wetland Width” so that “0-600” ft and “No Data” become -1, and >600 ft becomes 0. Give the resulting data layer a distinct name, such as “600ft Wetland Width Score,” and save this layer for use in future analyses.
4.5 Is wetland > 10 acres?
4.5.1 Use the “Wetland Acreage” layer generated in step 1.6.1.
4.5.2 Group data into 2 classes, one showing wetlands 0-10 acres in size and one showing acres >10 acres in size.
4.6 Calculate Wetland Wildlife Value
4.6.1 Using Raster Calculator, add together all the scored data layers for this step, as well as the “Wetland Unit” layer generated in step 1.1.
4.6.2 Reclassify the resulting data layer so that:10=5, 9=4, 8=3, 7=2, 6=1, ≤ 5 = 0 4.6.3 Give the resulting calculation layer a distinct name such as “Wildlife Habitat
Score” and save this layer for use in the overall wetland assessment. Step 5: Evaluating Aquatic Life
This value measures the ability of a wetland to support aquatic life such as fish, amphibians, reptiles, and invertebrates. A wetland’s system type and vegetation cover, the amount of time the wetland is inundated during the year, and the location of the wetland with respect to surface water are the key factors in such an evaluation. The value is assessed primarily using attributes of wetlands described in the NWI classification system.
5.1 Is the wetland a bog, fen or other type of Palustrine wetland? 5.1.1 Use the grid layer “Palustrine Score,” generated in step 4.2. 5.2 Is the wetland flooded permanently, semi-permanently or seasonally?
5.2.1 Use the grid layer “NWI Wetlands Grid,” generated in step 4.2.1.
5.2.2 Reclassify the resulting grid layer so that values associated with permanently, semi-permanently or seasonally flooded (H,F,C) wetlands become 0 and all other values become –1. Give the resulting data layer a distinct name such as “Flooding Score.”
5.3 Does the wetland have good vegetation cover?
5.3.1 Use the layer “Vegetation Cover Score” generated in 1.4.2. 5.4 Is the wetland forested?
5.4.1 Use the grid layer “Forested Wetland Score” generated in step 4.3.2. 5.5 Is the wetland within 300 feet of surface water with signs of flooding?
5.5.1 Use the grid layer “Floodplain and Buffer Score – Pollution” generated in 3.1.1. 5.6 Aquatic Life Scoring
5.6.1 Using Raster Calculator, add together all the scored data layers for this step, as well as the “Wetland Unit” layer generated in step 1.1.
5.6.2 Reclassify the resulting data layer so that: 10=5; 9=4; 8=3; 7=2; 6=1; ≤ 5 = 0 5.6.3 Give the resulting layer a distinct name such as “Aquatic Life Score” and save
this layer for use in the overall wetland assessment. Step 6: Evaluating Recreation/Education Quality
evaluation of a wetland’s recreation/education quality is the accessibility of the wetland to the public, determined by the wetland’s nearness to a publicly accessible road. Additionally, a wetland may be valuable as a way to launch a boat for recreational/ educational purposes. For these reason, only two criteria - public access and connection to open water - are used to assess this value.
6.1 Is the wetland publicly accessible by road?
6.1.1 Convert the NWI wetlands shapefile to raster based on the field “Access.” 6.1.2 Reclassify the resulting layer so that values associated with “N” and “No Data”
are assigned a value of -5 and those associated with “Y” are assigned a value of “0.” Give the resulting layer a distinct name such as “Public Access by Road Score” and save for future analysis.
6.2 Is the wetland accessible to open waters?
6.2.1 Use the “Wetlands on Streambanks” layer generated in step 2.1.2.
6.2.2 Reclassify this layer so that all values of “0” or “no data” are reassigned a value of -2. Give the layer a distinct name such as “Recreation - Wetlands on
Streambanks Score.”
6.3 Recreation/Education Quality Scoring
6.3.1 Using Raster Calculator, add all the scored data layers for this step, as well as the “Wetland Unit” layer generated in step 1.1, together.
6.3.2 Reclassify the resulting data layer so that:10=5; 9=4; 8=3; 7=2; 6=1; ≤ 5 = 0 6.3.3 Give the results of the calculation a distinct name such as “Recreation/Education
Score” and save this layer for the final assessment. Step 7: Final Assessment
Using Raster Calculator, add each scored data layer generated by Steps 1-6 (see below). • Water Storage Score
• Bank Stabilization Score • Pollution Removal Score • Wildlife Habitat Score • Aquatic Life Score
• Recreation/ Education Score
Suggested Additional Components of an Overall Wetland Plan Formulation
Field Evaluation
Using a field-based evaluation checklist, the evaluator should verify the results found in the GIS-based assessment of the Booker Creek watershed. Steps in the field-based process include:
1) Choosing 2-5 wetlands in the Booker Creek Watershed;
2) Visiting sites and observing conditions in the wetland, answering questions from the wetland field evaluation protocol;
3) Interpreting the results from the field evaluation based on assigned readings and class discussions.
This assignment should be aggregated with Assignment 1 to produce a coherent report assessing the value of wetland function in the Booker Creek Watershed. The evaluation should also include an annotated map and photographs.
The results of the field evaluation provide a complete picture of the quality of wetlands in the Booker Creek area and verify or disprove the initial assessment of wetland quality in Booker Creek. Identification of wetland vegetation is one example of valuable
Watershed Policy Framework
The final component of the wetland assessment process involves developing a policy framework for addressing the identified issues and problem areas. A brief discussion of resources and considerations for creating a policy framework is provided. This
discussion will draw heavily upon collected information and resources on the best management practices for wetland management from around the country. The body of knowledge that has been accumulated through years of wetland management can and should be leveraged to improve local management efforts. Several model wetland management success stories will be identified and briefly discussed in class.
The initial step in developing a policy framework involves taking an inventory of existing regulations and management efforts that impact wetland functions in the watershed. A careful analysis of the strengths and weaknesses of the current regulatory regime coupled with the results of the issues and problems should uncover gaps and areas of potential improvement.
Example Policy Framework
Goal 1: Maintain and improve water quality to protect and restore natural ecosystems and compatible human uses of Biscayne Bay.
Objective 1.1:Decrease contaminant loading from urban stormwater runoff. Policy 1.1.1: Continue efforts to retrofit existing stormwater systems that have known problems, catalog all stormwater outfalls, and establish priority ranking, using the most effective methods available.
Policy 1.1.2: Encourage local governments to develop comprehensive stormwater plans and implementation programs, including retrofit projects that emphasize the removal of contaminants in urban stormwater.
Goal 2: Protect environmental resources of Biscayne Bay and adjacent areas.
Objective 2.1: Preserve and restore natural environments in the Bay and its watershed.
Policy 2.1.1: Delineate and prioritize areas for enhanced protection and/or acquisition.
Policy 2.1.2: Work with local governments and other agencies to design forms of development that protect the functions of natural systems.
Source: South Florida Water Management District,Biscayne Bay Surface Water Improvement and Management Plan, 1995.
Results and Recommendations
While certainly not a substitute for a field evaluation, the GIS-based Wetland Evaluation Method still provides valuable insight into the nature of wetlands in the Booker Creek Watershed. Based on procedure results, the evaluator can see that wetlands vary significantly in their ability and opportunity to perform certain functions considered valuable within the context of the watershed.
The aforementioned procedures were tested and the results are discussed in this section. Completion of this protocol should yield seven maps: one for each category of values that depicts the wetland’s value score as well as one that depicts the overall value score. The maps generated by this procedure should resemble the maps depicted in the figures in this section. The resulting maps are discussed with respect to their significance in an overall wetland protection policy for the Booker Creek Watershed.
Water Storage Value
The map generated from the Water Storage Evaluation (Figure 1) shows a general trend that one might intuitively expect to find – that larger wetland systems hold larger volumes of water and, therefore, are better able to store excess floodwater than smaller wetlands. The main exception to this trend is the wetland group located on the southern end of Eastwood Lake. The lake was only classified as a medium-quality wetland for water storage, while the small wetland group on the south side of the lake scored higher in water storage value. This result could be attributed to the lack of vegetation cover present on Eastwood Lake and the presence of vegetation on in the smaller wetland. In addition, the lake is a man-made feature that holds a relatively large volume of water. However, in the event of a major flood, excess stormwater might overflow the dam. The smaller, well-vegetated upstream wetland is likely more efficient at storing excess water than the lake.
The highest scoring wetland system depicted in this map occurs at the most
downstream point of the Booker Creek Watershed. These wetlands are not only relatively large and well vegetated, they also lie in an area with a wide floodplain. Such a wetland would certainly have a greater opportunity to store excess floodwater that might occur during a major flood event. In addition, the ability of this wetland system to store excess floodwater is larger not only due to its size and width, but also due to its forested
vegetation. Such vegetation would reduce the rate at which floodwater exits the wetland by physically obstructing flow as well as absorbing excess water through roots.
Streambank Stabilization Scores
The map generated from the Streambank Stabilization Evaluation (Figure 2) somewhat conformed to my expectations for this assessment. I had expected that the larger wetland systems of Lake Ellen, Eastwood Lake, and Booker Creek Outflow would have the highest value for bank stabilization because of the opportunity these wetlands have to buffer against erosive forces. The wetlands at the Booker Creek Outflow scored among the highest systems in this evaluation, with the Lake Ellen and Eastwood Lake systems scoring relatively high. Additionally, I had expected the wetland system in Crow Branch to score lower due to its location in a relatively flat, pristine sub-watershed. Such a location does not present much opportunity to mitigate erosive forces.
One result of the map that I had not expected was the high-score of several of the smaller, more isolated wetlands. This phenomenon can likely be attributed not to the fact that these wetlands are along streambanks, but are likely well vegetated, small ponds identified by the hydrography data layer and located downstream from steep slopes and in highly urbanized sub-watersheds. This delineation by the hydrography layer presents problems when trying to differentiate, among wetlands, the opportunity of the wetland to mitigate erosive forces. The flowing water in a stream would erode stream channels to a greater degree than the standing water present in a pond. Therefore, a wetland along a streambank would have a better chance to mitigating such erosive forces.
For assessing the bank stabilization value of a wetland, a field evaluation would reveal whether or not strong erosive forces are present in the area. The evaluator could identify areas where scouring has occurred in the stream channel or along the banks of the stream or water body. For this evaluation, the surrogate value of an “urbanized” watershed criteria helps, because an urbanized watershed is often considered a good indicator of overall health of streams in the watershed. Based on the GIS Evaluation, the evaluator could conclude that any wetland of reasonable size in sub-watersheds with a high percent impervious cover would certainly have the opportunity to mitigate erosive forces
stemming from such conditions.
Another issue that arose involved the 2-score evaluation of the wetlands at Booker Creek Outfall. This phenomenon occurred because of the integration of the 50-ft buffer into the evaluation score when the wetland width was greater than 50 feet. This being the case, I would consider this wetland to possess the higher score, since the heart of the wetland is within 50ft of and connected to the streambank.
Water Pollution Removal Score
Eastwood Lake scored higher than the lake itself, a phenomenon likely attributed to the vegetation cover.
The smaller isolated wetlands once again do not appear to have an obvious spatial pattern related to their score. Their score for pollution removal can likely be attributed to opportunity factors inherent in the surrounding landscape, such as gradual topography and an urbanized sub-watershed. The wetland system in Crow Branch, which received a relatively lower score than wetlands in more urbanized areas, further exhibits the trend of a lower opportunity score for wetlands in a more pristine landscape. However, a field evaluation would be necessary to determine if there are actually any pollutants being held in the wetland. For example, the presence of sheen on the surface of a wetland would possibly be an indication that petroleum-based pollutants are present in the runoff flowing into the wetland. In such a situation, the wetland's opportunity to remove pollutants is obvious, and its score would increase to reflect this observation. Wildlife Habitat Score
The results of the Wildlife Habitat Evaluation (Figure 4) demonstrate a pattern based less on the opportunity criteria and more on inherent values of the wetland itself. For example, factors such vegetation type, vegetation cover, and size contribute to a high value for the wetland group at the Booker Creek Outfall. The evaluation also reflects a lower score for wetlands that are isolated from other wetlands. These wetlands contribute little to a contiguous corridor of openspace that would be valuable for migration of wildlife between food sources.
This assessment demonstrates why a field-based evaluation would be necessary for an adequate assessment of wetlands. Such an assessment would allow the evaluator to determine if wildlife actually use the area. For example, the evaluator could uncover direct evidence such as animal tracks, foraging, and animal droppings that would all indicate that the wetland was being actively used by wildlife, thereby increasing the wetland's wildlife habitat score. Additionally, the GIS-based method values the quantity of wetland habitat over the quality, biasing the evaluation toward larger areas that may have low-quality vegetation over smaller wetlands that may have higher-quality
vegetation. A field evaluation would more accurately determine not only the amount, but also the exact type of plant species that populate the wetland. Such an observation could be used in determining which animal species would most benefit from the habitat the wetland could provide.
Aquatic Life
The results of the Aquatic Life Evaluation (Figure 5) demonstrate a trend in which the qualities of a wetland itself contribute more to the value of the wetland than the quality of the surrounding landscape. Smaller, yet high quality wetlands are depicted at the
predators, such as in the well vegetated, seasonally flooded wetlands just south of Eastwood Lake, can provide abundant food from detritus. Additionally, these wetlands can provide numerous places for adults to spawn and young aquatic species to hide before they venture out into the open waters of Lake Ellen.
In addition, there are likely amphibious species in these wetlands that require both aquatic and terrestrial habitat. Wetlands that are flooded in the growing season and drier at other times of the year, as is the case with seasonally flooded wetlands, provide both of these types of habitat. Not surprisingly, no wetland received a score less than two. In an urban watershed with diminished open space, any wetland will likely have at least some value to the aquatic species that use it.
A field analysis would also be a crucial element for evaluating aquatic life because actual observation of wetlands is the best way to definitively determine the existence of aquatic life. In addition, a wetland observation could reveal signs of diminished water quality that would actually be harmful to aquatic life. Wetlands that have low water levels or no surface water due to drought or sediment build-up would obviously receive lower scores in the aquatic life assessment.
Recreation/ Education
The result of the Recreation/ Education Evaluation (Figure 6) reveals little beyond whether the wetland is accessible by roads. However, the wetlands that appear in this map seem to be potentially good locations to take students on field trips to see a wetland first-hand. The wetlands around Lake Ellen and Eastwood Lake are both within 50ft of a public road, so one could assume that the location of these wetlands would allow a person an opportunity to observe certain wetland functions. In the case of Eastwood Lake and Lake Ellen, the evaluator might conclude that these wetlands provide an opportunity for boating. Other factors, such as the visual quality of the wetland, should be determined from a field evaluation. Such an evaluation could even take place in a boat launched from Phil Berke's house on Lake Ellen.
Overall Wetland Evaluation
The Overall Wetland Evaluation (Figure 7) reflects an accumulation of the trends displayed throughout each individual evaluation component. The scores are grouped into quartiles for easier visual analysis. The highest rated wetlands in Booker Creek occur at the southern edge of Eastwood Lake and at the outfall of Booker Creek. These are the wetlands that possess a combination of attributes such as good vegetation cover, adequate size, and a direct connection to the stream network. They also provide the stream
network with a good buffer from the growing urbanizing area surrounding them. It should also come as no surprise that, the smaller, isolated, and less vegetated wetlands scattered throughout the northern portions of the watershed received a far lower score because of their lack of beneficial attributes.
References
Arkansas Multi-Agency Wetlands Planning Team (MAWPT), “The Standard GIS Methodology for Wetland Analysis,” Arkansas Wetland Conservation Plan, http://www.mawpt.org/plan/area_reports.asp, accessed on 11/18/2002. Committee on Mitigating Wetland Losses, National Resources Council (NRC),
“Executive Summary” and “Introduction,” Compensating for Wetland Losses Under the Clean Water Act. Washington, DC: National Academy Press, 2001, pp 1-21.
Cowardin, L.M., V. Carter, F.C. Golet and E.T. LaRoe, Classification of Wetlands and Deepwater Habitats of the United States. 1979, U.S. Department of the Interior, Fish and Wildlife Service Biological Services Program, FWS/OBS-79/31. 103 pp.
Hammer, Donald A. Creating Freshwater Wetlands. 1992, Boca Raton, FL: Lewis Publishers, 298 pp.
Kaur, Amarjeet, Venkatesh Dutta, and D. K. Chaddha, "Application of Remote Sensing and GIS Tools in Delineating Environmentally Fragile Areas (EFAs) for Sustainable Land Use Planning: A Case Study of Delhi Region," GISDevelopment Resource Papers, http://www.gisdevelopment.net/application/urban/overview/
urbano040pf.htm, 2002, accessed on 11/17/2002.
Kent, Donald M. Applied Wetlands Science and Technology. 1994, Boca Raton, FL: Lewis Publishers, 436 pp.
Marsh, William, “Chapter 18: Wetlands, Habitat and Land Use Planning,” Landscape Planning: Environmental Applications. 1991, New York: John Wiley & Sons, Inc., pp. 280-288.
Miller, Raymond E. Jr. and Boyd E. Gunsalus, "Wetland Rapid Assessment Procedure (WRAP)," Natural Resources Management Division Regulation Department Technical Publication REG-001. South Florida Water Management District. September 1997.
Mitsch, William J. and James G. Gosselink, Wetlands. 1993, New York : Van Nostrand Reinhold. 722 pp.
National Wetland Inventory (NWI), "National Wetland Inventory Metadata" National Wetland Inventory Website, http://wetlands2.nwi.fws.gov/metadata/, accessed on 11/15/2002.
North Carolina Department of Environment and Natural Resources (NCDENR), Cape Fear River Basinwide Water Quality Plan. August 2000. From NCDENR website
http://h2o.enr.state.nc.us/basinwide/Capefear/capefearindex.htm, Raleigh, NC, Novitzki, Richard P., R. Daniel Smith, and Judy D. Fretwell, "Restoration, Creation, and
Recovery of Wetlands: Wetland Functions, Values, and Assessment," United States Geological Survey Water Supply Paper 2425, 1997, From USGS website,
http://water.usgs.gov/nwsum/WSP2425/functions.html, accessed on 11/18/2002. Prasad, S.N., Alok Kumar, and A.K. Tiwari, "Wetland Conservation: Issues and
Applications," GISDevelopment Resource Papers, http://www.gisdevelopment.net/ application/environment/wetland/envwm0001.htm, 2002, accessed on 11/17/2002. Richarson, Curtis J. "Ecological Functions and Human Values in Wetlands: A
Framework for Assessing Forestry Impacts" Wetlands, Vol. 14, No. 1, March 1994, pp. 1-9.
Salvesen, David, Wetlands: Mitigating and Regulating Development Impacts, The Urban Land Institute, 1994, p.48 - 53.
Smith, Daniel R., Alan Ammann, Candy Bartoldus and Mark M. Brinson. “An Approach for Assessing Wetland Functions Using Hydrogeomorphic Classification, Reference Wetlands, and Functional Indices," Wetlands Research Program Technical Report WRP-DE-9, US Army Corps of Engineers: Washington, DC. October 1995.
Sundaram, Ar. A. Meenatchi, "'City Green Plan' as a Means to Achieve Sustainable Development: GIS Approach" GISDevelopment Resource Papers.
http://www.gisdevelopment.net/application/urban/overview/urbano0026.htm, 2002, accessed on 11/17/2002.
Sutter, Lori and Jeff Cowen, “Spatial Wetland Assessment for Management and Planning (SWAMP),” The Landscape Characterization and Restoration (LCR) Program, NOAA Coastal Services Center Website, http://www.csc.noaa.gov/
lcr/text/swamp.html, July 14, 2000, accessed on 11/18/2002.
U.S. Army Corps of Engineers Wetland Research Program (WRP), "Methods for Evaluating Wetland Functions" WRP Technical Note WG-EV-2.2, May 1994. Vermont Water Resources Board, "Functional Criteria for Evaluating a Wetland's
Significance," Vermont Wetland Rules. Adopted December 2001, pp. 9-15. Water Resources Management (WRM) Workshop, Urban Wetlands in the
Appendix A: Detailed Description of GIS Data Layers
NWI Attribute Classification System
NWI data is particularly important to the wetland evaluation because of its detailed classification scheme for wetlands, described below:
"The wetland classification system is hierarchical, with wetlands and deepwater habitats divided among five major systems at the broadest level. The five systems include Marine (open ocean and associated coastline), Estuarine (salt marshes and brackish tidal water), Riverine (rivers, creeks, and streams), Lacustrine (lakes and deep ponds), and Palustrine (shallow ponds, marshes, swamps, sloughs). Systems are further subdivided into subsystems, which reflect hydrologic conditions. Below the subsystem is the class, which describes the appearance of the wetland in terms of vegetation or substrate. Each class is further subdivided into
subclasses; vegetated subclasses are described in terms of life form and substrate subclasses in terms of composition. The classification system also includes modifiers to describe hydrology (water regime), soils, water chemistry (pH, salinity), and special modifiers relating to man's activities… (NWI, 2002; Cowardin et al, 1979)"
Table A1 details the classification codes used on the NWI data layer shown in Map 1, Appendix A.
Table A1: NWI Data Layer Classifications
Class Description
L1UBHh [L] Lacustrine, [1]Limnetic, [UB]-Unconsolidated Bottom, [H] Permanently Flooded, [h] Diked/ Impounded
PEM1Ch [P] Palustrine, [EM] Emergent, [1] Persistent, [C] Seasonally Flooded, [h] Diked/Impounded PFO1Ad [P] Palustrine, [FO] Forested, [1] Broad-Leaved Deciduous, [A] Temporarily Flooded,
[d] Partially Drained/Ditched
PFO1Ch [P] Palustrine, [FO] Forested, [1] Broad-Leaved Deciduous, [C] Seasonally Flooded, [h] Diked/Impounded
PSS1Ch [P] Palustrine, [SS] Scrub-Shrub, [1] Broad-Leaved Deciduous, [C] Seasonally Flooded, [h] Diked/Impounded
PSS1Fh [P] Palustrine, [SS] Scrub-Shrub, [1] Broad-Leaved Deciduous, [F] Semipermanently Flooded, [h] Diked/Impounded
PUBHh [P] Palustrine, [UB] Unconsolidated Bottom, [H] Permanently Flooded, [h] Diked/Impounded PUBHx [P] Palustrine, [UB] Unconsolidated Bottom, [H] Permanently Flooded, [x] Excavated
NWI Classification Definitions
System
[L] Lacustrine - The Lacustrine System includes wetlands and deepwater habitats with all of the following characteristics:
1. Situated in a topographic depression or a dammed river channel;
2. Lacking trees, shrubs, persistent emergents, emergent mosses or lichens with greater than 30% areal coverage.
3. Total area exceeds 8 hectares ( 20 acres ). Basins or catchments less than 8 hectares in size are included if they have at least one of the following characteristics:
• a wave formed or bedrock feature forms all or part of the shoreline boundary; or • have at low water a depth greater than 2 meters (6.6 feet) in the deepest part of
the basin.
Lacustrine Systems formed by damming a river channel are confined by the contour approximating normal spillway elevation or summer pool elevation. Rivers with dams and associated locks that impound water to the extent that the ecological character of the river is significantly impacted, are considered lacustrine to the upstream point that approximates spillway or normal pool elevation, or to the upstream point where riverine characteristics return.
Limits: The Lacustrine System is bounded by upland or by wetland dominated by trees, shrubs, persistent emergents, emergent mosses, or lichens. Lacustrine systems formed by damming a river channel are bounded by a contour approximating the normal spillway elevation or normal pool elevation, except where Palustrine wetlands extend lakeward of that boundary. Where a river enters a lake, the extension of the Lacustrine shoreline forms the Riverine-Lacustrine boundary.
(1) Limnetic - Extends outward from Littoral boundary and includes all deep-water habitats within the Lacustrine System.
[P] Palustrine - The Palustrine System includes all nontidal wetlands dominated by trees, shrubs, emergents, mosses or lichens, and all such wetlands that occur in tidal areas where salinity due to ocean derived salts is below 0.5 ppt. Wetlands lacking such vegetation are also included if they exhibit all of the following characteristics:
1. Are less than 8 hectares ( 20 acres );
2. Do not have an active wave-formed or bedrock shoreline feature;
3. Have at low water a depth less than 2 meters ( 6.6 feet ) in the deepest part of the basin;
4. Have a salinity due to ocean-derived salts of less than 0.5 ppt.
All water bodies visible on the aerial photography that are less than 8 hectares ( 20 acres) in size are considered to be in the Palustrine System unless depth information is
Description: The Palustrine System was developed to group the vegetated wetlands traditionally called by such names as marsh, swamp, bog, fen, and prairie, which are found throughout the United States. It also includes the small, shallow, permanent or intermittent water bodies often called ponds. Palustrine wetlands may be situated shoreward of lakes, river channels, or estuaries; on river floodplains; in isolated catchments; or on slopes. They may also occur as islands in lakes or rivers. Class
[UB] Unconsolidated Bottom - Includes all wetlands and deepwater habitats with at least 25% cover of particles smaller than stones (less than 6-7 cm), and a vegetative cover less than 30%.
[EM] Emergent - Characterized by erect, rooted, herbaceous hydrophytes, excluding mosses and lichens. This vegetation is present for most of the growing season in most years. These wetlands are usually dominated by perennial plants. All water regimes are included except subtidal and irregularly exposed.
(1) Persistent - Dominated by species that normally remain standing at least until the beginning of the next growing season. This subclass is found only in the Estuarine and Palustrine systems.
[FO] Forested - Characterized by woody vegetation that is 6 m tall or taller. All water regimes are included except subtidal.
(1) Broad-leaved Deciduous - Woody angiosperms (trees or shrubs) with relatively wide, flat leaves that are shed during the cold or dry season; e.g., black ash (Fraxinus nigra).
[SS] Scrub-Shrub - Includes areas dominated by woody vegetation less than 6 m (20 feet) tall. The species include true shrubs, young trees (saplings), and trees or shrubs that are small or stunted because of environmental conditions. All water regimes except subtidal are included.
(1) Broad-leaved Deciduous Water Regime
[H] Permanently Flooded - Water covers the land surface throughout the year in all years. [F] Semi-permanently Flooded - Surface water persists throughout the growing season in most years. When surface water is absent, the water table is usually at or very near the land's surface.
of a water table well below the ground surface.
[A] Temporarily Flooded - Surface water is present for brief periods during growing season, but the water table usually lies well below the soil surface. Plants that grow both in uplands and wetlands may be characteristic of this water regime.
Special Modifiers
[d] Partly Drained - The water level has been artificially lowered, but the area is still classified as wetland because soil moisture is sufficient to support hydrophytes. Drained areas are not considered wetland if they can no longer support hydrophytes. This
modifier is also used to indicate extensive ditch networks in wetlands where, due to the extreme number and narrow width of the ditches, individual delineation is impossible. Individual ditches shall be broken out as linears ( with Excavated modifier ) when they approximate the pen line width on the photography and if the area is not overly complex. [h] Diked / Impounded - Created or modified by a man-made barrier or dam which obstructs the inflow or outflow of water.
[x] Excavated - Lies within a basin or channel excavated by man. Attribute classification definitions derived from:
Cowardin, L.M., V. Carter, F. Golet, and E. LaRoe. 1979. Classification of Wetlands and Deepwater Habitats of the United States. U.S. Fish and Wildlife Service. 103 pp.
Note: NWI classification notatations were only described for wetands within the Booker Creek watershed. For additional notation descriptions, see the National Wetland