ASNM: Advanced Security Network Metrics for Attack Vector
Description
I. Homoliak, M. Barabas, P. Chmelar, M. Drozd, and P. Hanacek
11
Faculty of Information Technology, University of Technology, Brno, Czech Republic
Abstract—In this paper we propose a method for the extraction of data from network flow and a contextual sepa-ration of partial connections using a set of network metrics that create a signature defining the connection behavior. We begin with the definition of the input dataset of captured communication and the process of extraction metrics from separated connections. Then we define the set of metrics included in the final behavioral signature. The second part of the article describes experiments performed with a state-of-the-art set of network metrics with comparison to our proposed experimental set. The paper concludes with the results of our experiments.
Keywords:behavioral signature, detection, IDS, network metrics, security.
1. Introduction
There is considerable interest in developing novel de-tection methods based on new metrics for the description of network flow to identify connection characteristics, for examples to permit early identification of emerging secu-rity incidents, rapid detection of infections within internal networks, or instantaneous prevention of forming attacks. Buffer overflows continue to be one of the most com-mon vulnerabilities prevalent today, dominating the field of undetected and most dangerous "zero-day" attacks. This factor has motivated researchers to create more or less sophisticated defenses addressing this threat. The first line of defense is based on memory randomization (ASR), which unfortunately makes the attack harder to achieve, but it is still possible to find a way of offsetting the current process address. The second line of defense is based on automated signature generation techniques that generate filters to block network traffic similar to an attack payload signature. Un-fortunately, polymorphic attacks can evade these signatures, and hence subsequent research has focused on behavioral signatures that have favored the development of several data-mining methods defining sets of network metrics de-scribing the attack vector by the features of its behavior. These methods use either the existing NetFlow standard or network traffic packets. Several previous research studies left NetFlow to create their own set of network metrics, which brought more information and context in analyzed connections. Recognizing the importance of the quality of network metrics for influence on successful detection, this
paper proposes a new set of metrics with high detection and a low false positive ratio. It is expected that detection algorithms based on these new network behavioral metrics will outperform existing methods and will be applicable to a wider range of intrusion detection and prevention systems. Our primary goal is to create a network based system for online defense against zero-day buffer overflow attacks in the production environment. We described the reduction of attack types to buffer overflow in a previous article [1]. The secondary goal of this research is (a) to design the architecture of a detection framework that will enhance the overall network security level with the ability to learn new behaviors of attacks without human intervention by using expert knowledge from Honeypot (or similar) systems; (b) to find the most suitable set of metrics that will successfully describe the behavior of attacks in network traffic and will significantly increase the detection rate and lower the false positive rate.
In our previous article [1] we proposed the idea of framework architecture that would be used for the detec-tion of various network threats. The paper presented novel Automated Intrusion Prevention System (AIPS) which uses honeypot systems for the detection of new attacks and automatic generation of behavioral signatures based on net-work flow metrics. We have successfully experimented with the architecture of the AIPS system and have defined 112 metrics (recently updated to 167) divided into five categories according to their nature. These metrics are used to describe a properties of a detected attack, not upon the fingerprint of a common signature, but based on its behavior.
In this article we provide a definition of the method used for generating network behavioral signatures from a set of network security metrics – Advanced Security Network Metrics (ASNM) consisting of 167 metrics enhancing the ability of detecting potential attacks from network traffic.
The paper is organized as follows. Section 2 discusses related work in network security datasets and detection metrics. In Section 3 we describe a method used for signature generation and in Section 4 a description of metrics set. Section 5 presents experiments performed on two sets of metrics and Section 6 assesses the results of these experi-ments. Section 7 contains the conclusion of this paper.
2. Related Work
Since 1999, KDD’99[2] dataset, based on DARPA’98 IDS evaluation program, has been used for evaluating new intru-sion detection methods based on analyzing network traffic. The training dataset consists of approximately 4.9 million single connection vectors, each labeled as either normal or attack, containing 41 features per connection record. The dataset is criticized [3] mainly because it does not seems to be similar to traffic in real networks, and also there are some critiques of attack taxonomies and performance issues. As a result, many researches have proposed new measures to overcome existing deficiencies.
DARPA IDS evaluation dataset [4] was created for the purpose of training and testing the intrusion detectors. How-ever, in the dataset, all traffic was generated by software that is not publicly available and hence it is not possible to determine how accurate the background traffic inserted into the evaluation is. Also, evaluation criteria do not account for system resources used, ease of use, or what type of system it is.
The 2005 Moore sets [5] of data are intended to aid in the assessment of classification work. A number of data sets are described; each data set consists of a number of objects and each object is described by a group of features (also referred to as discriminators). Leveraged by a quantity of hand-classified data, each object within each data set represents a single flow of TCP packets between client and server. Features for each object consist of (application-centrist) classification derived elsewhere and a number of features derived as input to probabilistic classification techniques. In the classification, applications with similar dynamics are classified into the same class. A naive Bayesian classificator is used in the algorithm in which the Bayes formula is used to calculate posterior probability of a testing sample and selects the largest probability class as the classification result. A total of approximately 200 features of a network flow is used to train the model and a kernel-based function is used to estimate the distribution function [6]. The total accuracy is about 95% in the dimension of a flow number being correctly classified and 84% in the dimension of the flow size.
In our research, classifying IP traffic is crucial and it is important to include general classification techniques to our research for the classification of network attacks. The survey paper [7] reviewed state of the art work in the machine learning IP traffic classification in the period from 2004 to 2007. This paper created four categories of ma-chine learning classification techniques, clustering approach, supervised learning, hybrid, and comparisons and related work approaches. Each category was reviewed according to a number of requirements divided to offline and real-time classification.
Auld et al., based on Bayesian method introduced in [6], proposed the Bayesian Neutral Network method [8].
Com-pared with the Bayesian method, it made the classification correct rate rise to 99% on data from a single site for two days, eight months apart.
In [9], a novel probabilistic approach was proposed that uses the Markov chain for probabilistic modeling of ab-normal events in network systems. The performance of the proposed approach was evaluated through a set of exper-iments using the above mentioned DARPA 2000 data set. The proposed approach achieves high detection performance while representing a level of attacks in stages.
None of these approaches can be used in a real time eval-uation of network traffic due to performance issues or high false-positive ratio. Only a little research has been done on creating new network metrics for the behavioral description of network attacks to raise the classification accuracy, which makes this area still attractive for researchers.
3. Method Description
In this section we provide the abstract description of a method used for the extraction of network connections and generation of attacks signatures.
3.1 Used notation
We will use capital letters as labels for a set or constants in most cases. Lower case notation will be used for an element label or for an index label. By notation o[p] we mean the property pof the object o. The notation S∗ or S+ means the iteration of the setS or positive iteration of the set S, respectively. NotationABrepresents setA, which is a subset of setB. For example setsWP andWCdenote semantically the same set, but these are constructed of different items at a different level of abstraction. In the first case items are a subset of setP and in the second case items are a subset of setC, respectively.
3.2 Principle of the method
The method of our approach is based on the extraction
of various types of properties from each analyzed
TCP connection. We suppose having all packets set P ={pi}, i∈ {1, . . . , N}, whereN represents all packets
count. The identification of each packet is represented by its index i. A packet pi can be expressed as a tuple pi= (id, t, size, ethsrc, ethdst, tcpsport, tcpdport, tcpsum, tcpseq, tcpack, tcpof f, tcpf lags, tcpwin, tcpurp, iplen, ipof f, ipttl, ipp, ipsum, ipsrc, ipdst, data, iptos). Symbols
used in the packet tuple are described in Table 1.
TCP connection c is represented by tuple c =
(ts, te, idS, idSA, idA, idF A, ps, pd, ips, ipd, Ps, Pd). The
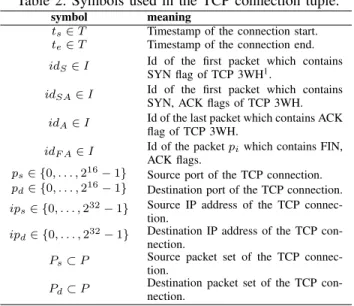
in-terpretation of the symbols used in tuple is briefly described in Table 2. The source part of the TCP connection is the one with the initiation of the connection and the destination part is the opposite part of the connection.
The set of all packets can be interpreted also as a set of all TCP connections C = {c1, . . . , cM}, where M is
Table 1: Symbols used in the packet tuple.
symbol meaning id∈ ℵ0 Id of the packet.
t∈T Timestamp of the packet capture.
size∈ ℵ Size in Bytes of the whole Ethernet
frame which wraps the IP packet.
ethsrc∈ {0, . . . ,248−1} Source MAC address of the
Ether-net frame.
ethdst∈ {0, . . . ,248−1} Destination MAC address of the
Ethernet frame.
tcpsport∈ {0, . . . ,216−1} Source port of the packet.
tcpdport∈ {0, . . . ,216−1} Destination port of the packet.
tcpsum∈ {0, . . . ,216−1} TCP Checksum of the header.
tcpseq∈ {0, . . . ,232−1} TCP sequence number of the
packet.
tcpack∈ {0, . . . ,232−1} TCP acknowledgment number of
the packet.
tcpof f∈ {0, . . . ,28−1} TCP offset and reserved fields
to-gether.
tcpf lags∈ {0, . . . ,28−1} TCP control bits.
tcpwin∈ {0, . . . ,216−1} TCP window field.
tcpurp∈ {0, . . . ,216−1} TCP urgent pointer field.
iplen∈ {0, . . . ,216−1} Size in Bytes of the whole IP
packet with IP header.
ipof f ∈ {0, . . . ,213−1} IP offset field.
ipttl∈ {0, . . . ,28−1} IP time to live field.
ipp∈ {0, . . . ,28−1} IP protocol field.
ipsum∈ {0, . . . ,216−1} IP checksum of the header.
ipsrc∈ {0, . . . ,232−1} Source IP address of the packet.
ipdst∈ {0, . . . ,232−1} Destination IP address of the
packet.
data∈ {0, . . . ,28−1}∗
Payload of the packet.
iptos∈ {0, . . . ,28−1} IP type of service field.
Table 2: Symbols used in the TCP connection tuple.
symbol meaning
ts∈T Timestamp of the connection start.
te∈T Timestamp of the connection end.
idS∈I Id of the first packet which contains
SYN flag of TCP 3WH1.
idSA∈I Id of the first packet which contains
SYN, ACK flags of TCP 3WH.
idA∈I Id of the last packet which contains ACK
flag of TCP 3WH.
idF A∈I Id of the packetpiwhich contains FIN,
ACK flags.
ps∈ {0, . . . ,216−1} Source port of the TCP connection.
pd∈ {0, . . . ,216−1} Destination port of the TCP connection.
ips∈ {0, . . . ,232−1} Source IP address of the TCP
connec-tion.
ipd∈ {0, . . . ,232−1} Destination IP address of the TCP
con-nection.
Ps⊂P Source packet set of the TCP
connec-tion.
Pd⊂P Destination packet set of the TCP
con-nection.
the number of TCP connections, which we can identify in the P and N is the number of all packets in set P. The minimum packets count, which is necessary to identify the TCP connection, is three packets which are used to establish a TCP connection according to TCP specifications. These three or more packets must contain the same IP addresses
(ipsrc, ipdst), ports (tcpsport, tcpdport) and fields tcpseq, tcpack corresponding to a three way handshake specification
stated in RFC 7932. The number of all TCP connections identified inP isM ≤N/3.
Then we define sliding window WP
j as a subset of all
packets setP:
WjP ⊆P, j∈ {1 +|Cs|, . . . , M− |Ce|}, (1)
whereM is the number of all TCP connections identified in P, indexjis the position of the sliding window in the set of all TCP connectionsCand|Cs|,|Ce|is the number of TCP
connections found in the first half of the sliding window with an initial positionW1+|Cs|and the second half of the sliding
window with finite positionWM−|Ce|, respectively. It should
be noted taht the sliding window WP
j always represents
continuous subset of packets bounded by a specified time interval tsw in the time domain T ⊂ <+ instantiated by
timestamps with a floating point part. Intervaltswrepresents
a time bounded notation of the size of a sliding windowW. The next statement which we can proclaim about sliding window is that we can interpret it as subset of all TCP connection set:
WjC⊆C, WjC={cI, . . . , cL}, I ≤L≤M. (2)
This notation of the sliding window we denote as the connection notation of the sliding windowWC
j . NoteL−I
can be different for various positions of the sliding window for the same set C because of the time boundary of the sliding window, not boundary specified by n-connections. The next fact about each particular TCP connectionck is an
unambiguous association ofck to particular sliding window WjC. We can interpret the start timetsof the TCP connection ckas a center of the sliding windowWjP. We can also denote
a shift of the sliding window∆(WjP)is always defined by start time differences of two consecutive TCP connections inC:
∆(WjP) =ck+1[ts]−ck[ts], k∈ {1 +|Cs|, . . . , M− |Ce| −1}.
(3) Next we define the context of the TCP connection, which is a set of all connections in a particular sliding windowWjC without an analyzed TCP connectionck:
Kck ={c1, . . . , cn}={W C
k \ ck}. (4)
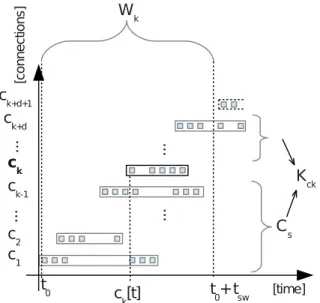
Defined terms are shown in figure 1. In this figure the x axis displays time and in the y axis, TCP connections are shown in the order of their occurrences. Packets are represented by small squares and TCP connections are represented by a rectangular boundary of particular packets. A bold line and font is used for depicting an analyzed TCP connectionck, which has an associated sliding window Wk
and context Kck. TCP connections, which are part of the 2URL http://www.ietf.org/rfc/rfc793.txt, page 30
sliding window Wk, are drawn by full line boundary and
TCP connections, which are not part of this sliding window, are drawn by a dashed line boundary.
t0 ck+d c2 ck ck-1 c1 ... ... ... ... t0+tsw ck[t] Wk ck+d+1 [time] [c on ne ct io ns ] Cs Kck
Fig. 1: Sliding window and context of the first analyzed TCP connection ck.
3.3 Metrics extraction
We identify all TCP connections set C in a set of all packetsP and next we perform metrics extraction for each TCP connection from a time bounded subset of C in the order of their beginnings. A time bounded subset is identified byCBand is defined because a metrics extraction process is
performed only for TCP connections with a complete context and this set states:
CB={ci} ⊂C, ∀i:ci[ts]≥ tsw 2 ∧ci[ts]≤ pl[t]− tsw 2 , (5)
wherepl∈P represents a packet with the latest timestamp.
The metrics extraction process is defined as an advanced process of signature computation from all packets of ana-lyzed TCP connection and its context.
We define metricmas a tuple consisting of natural or real numbers or an enumerated set of finite symbolic literals:
m= (e0, . . . ,en), n∈ ℵ0,
ei∈ ℵ | ei∈ < |ei∈Γ+, i∈ {0, . . . , n},
Γ ={a−z, A−Z,0−9}.
(6)
The input of the metrics extraction process is sliding windowWjC, TCP connectionck with metainformations of
its associated packets. The output of the process is the set
of all extracted metrics Mk = {mk1, mk2, . . . , mkD}, where D is the number of all defined metrics and mk
i f or i ∈
{1, . . . , D} contains a tuple of values specific for analyzed input TCP connectionck and its sliding windowWjC.
3.4 Functions for metrics extraction
Metrics for a particular connection ck are extracted by
several functions with a very similar input, which in all cases, includes an analyzed TCP connectionck. The other
part of the input may be, in some cases, context Kck of
the TCP connectionck. There are exactly 30 functions used
for metrics extraction and 7 of them uses the context of the TCP connection. Some functions return more than one metric when these can be directly extracted. Other functions are parametrized by various parameters as a direction of the TCP connection, order and type of polynomial, thresholds of the data size or packet count, etc.
One metric extraction function f declaration has the following form:
mk=f(ck, Kck, arg1, . . . , argn), (7)
where mk is the set of values of one defined metric m for input TCP connection ck. Kck is context of input TCP
connection andarg1, . . . , argn are additional arguments of
the functionf.
4. Metrics Definition
All metrics were defined in order to describe properties, process and behavior of network attacks or legitimate TCP connections. By using these metrics we are able to identify an attack with a higher probability. For the purpose of the best relevant signature of the TCP connections we use 167 metrics as signature. These 167 metrics are in many cases, a result of reasonable parametrization of base metrics functions. Since our previous article [1] we have slightly changed the categorization of the set of all metrics and have defined several new metrics with an emphasis on the behavior of a TCP connection. New types of our metrics set are depicted in Table 3 with a number of them in each category. We decided to determine the naming of categories of metrics according to their principles, not according to static data representation. Vector and polynomial metrics from our previous article [1] were divided into behavioral and distributed metrics categories. The list of all metrics with regard to the categorization, is introduced in master’s thesis [10].
4.1 Statistical metrics
In this category of proposed metrics statistic properties of TCP connections are identified. All packets of the TCP connection were considered in order to determine count, mode, median, mean, standard deviation, ratios of some header fields of packets or the packets themselves. This
Table 3: Distribution of Metrics. metric count Statistical 50 Dynamic 32 Localization 8 Distributed 34 Behavioral 43
category of metrics partially uses a time representation of packets occurrences contrary to the dynamic category defi-nition. Therefore, it includes particularly dynamic properties of the analyzed TCP connection, but without any context of it. Most of the metrics in this category also distinguish inbound and outbound packets of analyzed TCP connection. In total, 50 statistical metrics were defined.
4.2 Dynamic metrics
Dynamic metrics were defined in order to examine dy-namic properties of the analyzed TCP connection and trans-fer channel such as speed or error rate. These properties can be real or simulated. Fourteen of the metrics consider the context of an analyzed TCP connection. The difference between some of the statistic and dynamic metrics from a dynamic view can be demonstrated on two instances of the same TCP connection, which performs the same packet transfers, but in different context conditions and with different packet retrasmitions and attempts to start or finish the TCP connection. There were 32 dynamic metrics defined in total. Many of them distinguish between inbound and outbound direction of the packets and consider statistic properties of the packets and their sizes as mentioned in statistical metrics.
4.3 Localization metrics
The principal character of localization metrics category is that it contains static properties of the TCP connection. These properties represent the localization of participating machines and their ports used for communication. In some metrics localization is expressed indirectly by a flag, which distinguishes whether participating machines lie in a local network or not. Metrics included in this category do not consider the context of the analyzed TCP connection, but they distinguish a direction of the analyzed TCP connection. We defined 8 localization metrics.
4.4 Distributed metrics
The characteristic property of distributed metrics category is the fact that they distribute packets or their lengths to a fixed number of intervals per unit time specified by a logarithmic scale (1s, 4s, 8s, 32s, 64s). A logarithmic scale of fixed time intervals was proposed because of a better performance of used classification methods. The next prin-cipal property of this category is vector representation. All these metrics are supposed to work within the context of an
analyzed TCP connection. Altogether, we defined 34 metrics in this category which are a result of parametrization of 2 functions, which accepts parameters as unit time, threshold, direction and the context of an analyzed TCP connection.
4.5 Behavioral metrics
Behavioral metrics are a set of metrics based on the description of the properties directly associated with TCP connection behavior. Examples include legal or illegal con-nection closing, the number of flows at defined time inter-vals, polynomial approximation of the length of packets in a time domain or in an index of occurrence domain. Since our previous article [1] we have proposed new behavioral metrics:
• count of mutual TCP flows of participating nodes before an analyzed TCP connection bounded by a specified time interval. It considers the context of an analyzed TCP connection,
• count of new TCP flows after starting an analyzed TCP connection. It also works within the context of an analyzed TCP connection,
• coefficients of Fourier series in a trigonometric repre-sentation with distinguished direction of an analyzed TCP connection,
• standard deviation of time intervals between TCP con-nections going on the same ports and IP addresses, • standard deviation of time intervals between TCP
con-nections going on the same IP addresses,
• normalized products of the analyzed communication with1, . . . , nGaussian curves with regard to direction. We defined 43 behavioral metrics. Most of them use the direction of the analyzed TCP connection and 6 of them consider the context.
5. Experiments description
The performance of our behavioral metrics was evaluated in comparison with discriminators suggested by [5]. The authors of this paper considered only TCP connections to perform extraction of discriminators in the same way we did. So there are equivalent conditions for performance com-parison between our suggested metrics and discriminators suggested in the above mentioned work. There were 248 discriminators defined, including all items of vector types. Unlike their research we considered the whole particular vector metric as one. In their work, each TCP flow is described by three modes according to packet transmissions: idle, interactive and bulk. Many discriminators use these three modes as their input. The authors did not mention any explicit categorization of defined discriminators. The only possible categorization can implicitly follow from a direction of the TCP flow. We also performed a similar analysis of discriminators and metrics definition. We discovered that there is approximately 20% of discriminators’ definitions
principally similar or the same as in the metrics case. Unique properties of discriminators’ definitions include, for example, the using of quartiles for a statistical analysis, analysis of selective acknowledgment of TCP, a number of window probe indication, pushed or duplicate packets etc.
A dataset CDX 2009 was used for these
experiments, which was generated by Sangster et
al. in [11]. This dataset is available from URL:
https://www.itoc.usma.edu/research/dataset/. It contains data captured by NSA, data captured outside of the West Point network border (in TCP dump format) and snort intrusion prevention log as relevant sources for our experiments.
The CDX 2009 dataset was created during the network warfare competition, in which one of the goals was to generate a labeled dataset. By labeled dataset, the authors mean TCP dump traces of all simulated communications and snort log with information about occurrences of intrusions. Network infrastructure contained 4 servers with 4 vulnerable services (one per each server). These services with IP addresses of their hosted servers are described in Table 4. Two types of IP addresses are shown in this table:
• internal IPaddresses – corresponding to snort log, • external IPaddresses – corresponding to a TCP dump
network captured outside the West Point network bor-der.
This fact has to be considered in the process of matching snort log entries with a TCP dump capture.
Table 4: List of CDX 2009 vulnerable servers.
service OS internal IP external IP
Postfix Email FreeBSD 7.204.241.161 10.1.60.25 Apache Web Server Fedora 10 154.241.88.201 10.1.60.187
OpenFire Chat FreeBSD 180.242.137.181 10.1.60.73 BIND DNS FreeBSD 65.190.233.37 10.1.60.5
We noticed that specific versions of services described in [11] were not announced. Since this fact was not crucial for our research, it was of no concern to us.
It was discovered that the snort log can be associated only with data capture outside of the West Point network border and only with significant timestamps differences – approx-imately930 days. We did not find any association between the snort log and data capture performed by the National Security Agency. We focused only on buffer overflow attacks found in a log from snort IDS and a match with the packets contained in the West Point network border capture was performed. It should be noted that buffer overflow attacks were performed only on two services – Postfix Email and Apache Web Server. An example of the buffer overflow snort log entry:
[**] [124:4:1] (smtp) Attempted specific command buffer overflow: HELO, 2320 chars [**]
[Priority: 3] 11/09-14:22:25.794792
10.2.195.251:2792 -> 7.204.241.161:25
TCP TTL:240 TOS:0x10 ID:0 IpLen:20 DgmLen:2360
***AP*** Seq: 0x68750738 Ack: 0x24941B59
Win: 0xFDC0 TcpLen: 20.
We used IP addresses (5th row), ports (5th row), time of occurrence (4th row) and TCP sequence and acknowledg-ment numbers (7th row) as information to match the snort log entries with particular TCP connections identified in TCP dump traces.
Despite all efforts, there were exactly44 buffer overflow attacks matched out of all 65, and these identified attacks were used as expert knowledge for the data mining process. In order to correctly match snort entries, it was necessary to remap IP addresses of the internal to external network because a snort detection was realized in the internal network and TCP dump data capture contains entries from outside the IP address space.
Buffer overflow attacks, which were matched with data capture, have their content only in two TCP dump files:
2009-04-21-07-47-35.dmp, 2009-04-21-07-47-35.dmp2. Due to the enormous count of all packets (approximately 4 million) in all dump files, only two files were considered which contained 1 538 182 packets. We also noticed that network data density was increased in the time when attacks were performed. Consequently, we made another reduction of packets, which filters enough temporal neighborhood of attacks occurrences. In the result,204 953 packets for next phases of our experiments were used.
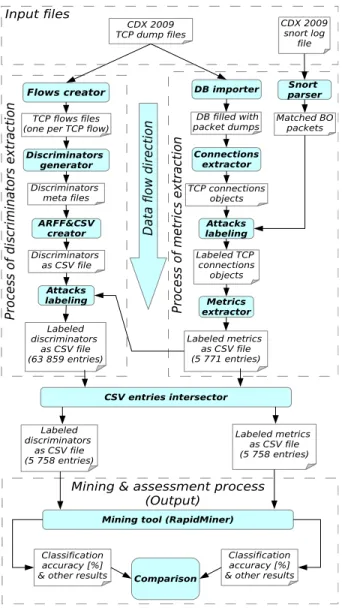
The whole process of metrics and discriminators extrac-tion with data mining comparison is illustrated in Figure 2. There are four segments and data flow direction from top to bottom depicted in the figure. Empty boxes represent data as input or output of some processes and filled ovals represent working components which perform some action. A working component takes input data and outputs output data. The upper segment represents the input of the whole experiment process and includes input data files:CDX 2009 TCP dump files and CDX 2009 snort log file. The CDX 2009 TCP dump filesare the mutual input of both extraction processes. The input of expert knowledge (CDX 2009 snort log file) is directly provided to the metrics extraction process and is indirectly bounded to extracted discriminators after the end of metrics extraction process.
The left segment contains phases of discriminators extrac-tion and the right segment contains the metrics extracextrac-tion process with expert knowledge processing.
5.1 Metrics extraction process
The metrics extraction process of the right segment in-cludes a process described in subsection 3.3. An all packets setP is represented by the input of CDX 2009 TCP dump files, which are imported into the database by aDB importer
component. Next, an active componentConnection extractor
CDX 2009 TCP dump files
Flows creator
TCP flows files (one per TCP flow)
Discriminators generator Discriminators meta files ARFF&CSV creator Discriminators as CSV file
Mining tool (RapidMiner)
Pr oc es s of d is cr im inat or s ex tr ac ti on Classification accuracy [%] & other results
DB importer DB filled with packet dumps Connections extractor TCP connections objects Metrics extractor Labeled metrics as CSV file (5 771 entries) CDX 2009 snort log file Attacks labeling Labeled TCP connections objects Pr oc es s of m etr ic s ex tr ac ti on Classification accuracy [%] & other results Comparison Labeled discriminators as CSV file (63 859 entries) Attacks labeling
Mining & assessment process (Output) Snort parser Matched BO packets CSV entries intersector Input files D ata fl ow d ir ec ti on Labeled discriminators as CSV file (5 758 entries) Labeled metrics as CSV file (5 758 entries)
Fig. 2: The Process of metrics extraction and assessment.
in all packet set P. The extraction of TCP connections was followed by expert knowledge information processing, which means matching of extracted TCP connections with parsed snort log information. If a match occurred, the TCP connection is labeled as an attack by the Attacks labeling
component. Then, metrics extraction is performed for each TCP connection in C by the Metrics extractor component and the result of this step are metrics values for each TCP connection object in CSV file. It should be noted that the metrics extraction process is independent of expert knowledge information.
5.2 Discriminators extraction process
The input of this process is the same as in the metrics extraction process. The component Flows creatorperforms the identification of TCP connections by netdude tool3and it
3URL: http://netdude.sourceforge.net/
creates a TCP dump file for each identified TCP connection. These TCP dump files are used as an input for Discrim-inator generator component, which performs extraction of discriminators for each identified TCP connection. This com-ponent performs equivalent operation as Metrics extractor
component in the process of metrics extraction. It generates discriminators meta files which contain intermediate results of discriminators values. These meta files are processed and joined by the ARFF&CSV creator component into a CSV file. After this step, the attack TCP connections are labeled, which is performed by the theAttack labeling component.
5.3 Mining & assessment process
This process is depicted in the lower part of Figure 2. Before this process takes place, it is necessary to make an intersection between output CSV files of metrics and discriminators extraction processes, which is performed by theCSV entries intersectorcomponent. At the output of this step there are metrics and discriminators of the same TCP connections objects, so there are equivalent conditions for the data mining process. Two intersected CSV files with an equal number of entries are used as the input of theMining toolcomponent and output consists of classification accuracy and other results suitable for comparison.
It should be noted that we found5 771TCP connections by our TCP connections extractor and 63 859 TCP con-nections by the TCP demultiplexer from netdude framework which is used by discriminators extraction. The main reason is the fact that we consider only established TCP connections because only an established TCP connection can perform a buffer overflow attack. The intersection of metrics and discriminators outputs contains 5 758 objects and 44 of them represent attacks. This intersection was used in the data mining process and, therefore, they were adjusted by the same conditions for both metrics and discriminators outputs with the same TCP connections entries. Thirteen (13) established TCP connections were not found by the TCP demultiplexer. The discrimination extraction was performed using a source code available from the author’s web4. The
whole process of discriminators extraction itself was not described in [5], so we deduced it from a source code and README instructions. It was also necessary to debug some functionality of provided tools. During the preparation for discriminators extraction, there were some compatibility issues caused by old versions of dependencies. We finally used Linux Fedora 4 as the most suitable operating system for the necessary operation.
4URL: http://www.cl.cam.ac.uk/research/srg/netos/nprobe/data/papers /sigmetrics/index.html
6. Result of Experiments
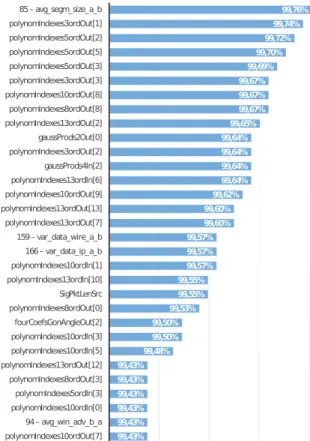
We analyzed joined outputs of metrics and discriminators extraction processes by the RapidMiner5 tool. Our training model used the Naive Bayes classificator kernel. A stratified sampling with 5-cross fold validation for every experiment was performed. A feature selection component was used which tries to select the most relevant attributes for final model generation. We focused only on the accuracy evalu-ation of particular metrics and discriminators. Our experi-ments were adjusted for maximal classification accuracy of input data. The best results were merged from both input CSV files. In Figure 3 the best metrics and discriminators (over 99.43% overall accuracy) are shown, sorted by the overall accuracy. The names of discriminators consist of a number and label defined in [5]. The names of metrics are defined in [10]. The names of polynomial approximation metrics consist of 5 parts: polynomial metric label, method of approximation (indexes or time), order of polynomial, direction and coefficient index. Fourier coefficient metrics’ names consist of the Fourier coefficient metric label, the goniometric representation, the angle or the module, the di-rection and the coefficient index. Gaussian products metrics’ names are a compound of the Gaussian metric label, the number of Gaussian curves, the direction and the product index (e.g.PolynomIndexes5OrdOut[1]).
We can see that the best classification accuracy for the metrics sets was achieved by several polynomial approxi-mation metrics. In most of these cases we achieved better results by the output direction, but we were also able to achieve interesting results with the input direction. A good performance was also achieved by Gaussian curves approximation and Fourier coefficients. The relevance in the case of standard deviation of packets length in the output direction (sigPktLenSrc) is also presented.
In the set of discriminators, the best results were achieved by an average segment size discriminator in the direction from client to server (avg_segm_size_a_b). It could be caused by the fact that the exploit’s payload contains a huge amount of data necessary to perform application buffer over-flow and these data are segmented. Another distinguished discriminator is the variance of bytes count in Ethernet or IP datagram in the destination direction (var_data_wire_ab
and var_data_ip_a_b). This discriminator is equivalent to average standard deviation metric of packet length in the output direction and brings nearly equivalent results. Also, the average window advertisement in the input direction (avg_win_adv_b_a) holds relevant information potentially useful in the process of classification.
We have successfully increased the detection rate by 0.9%from the previous state-of-the-art classification method (99.0%) by extending the set of network metrics used for classification. 5URL: http://rapid-i.com/content/view/181/190/lang,en/ 99,76% 99,74% 99,72% 99,70% 99,69% 99,67% 99,67% 99,67% 99,65% 99,64% 99,64% 99,64% 99,64% 99,62% 99,60% 99,60% 99,57% 99,57% 99,57% 99,55% 99,55% 99,53% 99,50% 99,50% 99,48% 99,43% 99,43% 99,43% 99,43% 99,43% 99,43% 85– avg_segm_size_a_b polynomIndexes3ordOut[1] polynomIndexes5ordOut[2] polynomIndexes5ordOut[5] polynomIndexes5ordOut[3] polynomIndexes3ordOut[3] polynomIndexes10ordOut[8] polynomIndexes8ordOut[8] polynomIndexes13ordOut[2] gaussProds2Out[0] polynomIndexes3ordOut[2] gaussProds4In[2] polynomIndexes13ordIn[6] polynomIndexes10ordOut[9] polynomIndexes13ordOut[13] polynomIndexes13ordOut[7] 159– var_data_wire_a_b 166– var_data_ip_a_b polynomIndexes10ordIn[1] polynomIndexes13ordIn[10] SigPktLenSrc polynomIndexes8ordOut[0] fourCoefsGonAngleOut[2] polynomIndexes10ordIn[3] polynomIndexes10ordIn[5] polynomIndexes13ordOut[12] polynomIndexes8ordOut[3] polynomIndexes5ordIn[3] polynomIndexes10ordIn[0] 94– avg_win_adv_b_a polynomIndexes10ordOut[7]
Fig. 3: List of metrics sorted by overall accuracy (over 99.43%).
7. Conclusion
In this paper, we focused on defining the process of extraction metrics from separated connections of captured network traffic and consequently focused attention on the experiments that proved the concept of a designed metrics set. In described experiments we achieved99.9% accuracy of detecting buffer overflow attacks by combining an existing proposed metrics set with our solution. Accuracy is highly dependent on training samples parsed from captured network traffic. The training and testing samples may be biased towards a certain class of traffic. For example, valid com-munication (according to the separation to valid and attack connections) represents a large majority of the samples in the testing dataset[6] (approximately 99.24%). The reason to the high classification capability of fewer metrics is that classification of buffer overflow attacks was highly predi-cable due to the size of data in fragmented packets, which caused the overflow and the nature of a valid communication with a small number of fragmented packets.
Our future work focuses on extending the metrics set to achieve a more sufficient results in the detection of buffer overflow attacks. We plan to perform more experiments with actual metric sets. The efficiency of the current detection
method was tested only on a small number of attacks. In the near future, we plan to create a public detection set that will create a challenge to the development of detection algorithms in order to detect unknown attacks.
Acknowledgment
This article was created within the research plan
of the Security-Oriented Research in Information
(MSM0021630528). This work was supported by the Operational Programme Research and Development for Innovations under the IT4Innovations Center of Excellence project (CZ.1.05/1.1.00/02.0070) and by the project Advanced Secured, Reliable and Adaptive IT (FIT-S-11-1). This project has been realized with a financial support from the Czech Republic state budget through the Ministry of Industry and Trade by research plan FR-TI1/037.
References
[1] M. Barabas, M. Drozd, and P. Hanáˇcek, “Behavioral signature gen-eration using shadow honeypot,” in World Academy of Science, Engineering and Technology, ser. Issue 65, May 2012, Tokyo, Japan, no. 65. World Academy Science Engineering Technology, 2012, pp. 829–833.
[2] S. Stolfo, F. Wei, W. Lee, A. Prodromidis, and P. Chan, “Kdd cup knowledge discovery and data mining competition,” 1999.
[3] S. J. Stolfo, W. Fan, W. Lee, A. Prodromidis, and P. K. Chan, “Cost-based modeling for fraud and intrusion detection: Results from the jam project,” in DARPA Information Survivability Conference and Exposition, 2000. DISCEX’00. Proceedings, vol. 2. IEEE, 2000, pp. 130–144.
[4] C. Thomas, V. Sharma, and N. Balakrishnan, “Usefulness of darpa dataset for intrusion detection system evaluation,” in SPIE Defense and Security Symposium. International Society for Optics and Photonics, 2008, pp. 69 730G–69 730G.
[5] A. W. Moore, D. Zuev, and M. Crogan, “Discriminators for use in flow-based classification,” Technical report, Intel Research, Cam-bridge, Tech. Rep., 2005.
[6] A. W. Moore and D. Zuev, “Internet traffic classification using bayesian analysis techniques,” in ACM SIGMETRICS Performance Evaluation Review, vol. 33, no. 1. ACM, 2005, pp. 50–60. [7] T. T. Nguyen and G. Armitage, “A survey of techniques for internet
traffic classification using machine learning,”Communications Sur-veys & Tutorials, IEEE, vol. 10, no. 4, pp. 56–76, 2008.
[8] T. Auld, A. W. Moore, and S. F. Gull, “Bayesian neural networks for internet traffic classification,” Neural Networks, IEEE Transactions on, vol. 18, no. 1, pp. 223–239, 2007.
[9] S. Shin, S. Lee, H. Kim, and S. Kim, “Advanced probabilistic approach for network intrusion forecasting and detection,” Expert Systems with Applications, 2012.
[10] I. Homoliak, “Metrics for Intrusion Detection in Network Traffic,” Master’s thesis, University of Technology Brno, Faculty of Information Technology, Department of Intelligent Systems, 2011. [Online]. Available: in Slovak language, http://www.fit.vutbr.cz/study/DP/DP.php.en?id=13755&y=2011 [11] B. Sangster, T. O’Connor, T. Cook, R. Fanelli, E. Dean, W. J.
Adams, C. Morrell, and G. Conti, “Toward instrumenting network warfare competitions to generate labeled datasets,” inProc. of the 2nd Workshop on Cyber Security Experimentation and Test (CSETâ ˘A ´Z09), 2009.