The ReactorAFM: Non-contact atomic force microscope operating under
high-pressure and high-temperature catalytic conditions
S. B. Roobol, , M. E. Cañas-Ventura, , M. Bergman, M. A. van Spronsen, W. G. Onderwaater, P. C. van der Tuijn, R. Koehler, A. Ofitserov, G. J. C. van Baarle, and J. W. M. Frenken,
Citation: Review of Scientific Instruments 86, 033706 (2015); doi: 10.1063/1.4916194
View online: http://dx.doi.org/10.1063/1.4916194
View Table of Contents: http://aip.scitation.org/toc/rsi/86/3
Published by the American Institute of Physics
Articles you may be interested in
The ReactorSTM: Atomically resolved scanning tunneling microscopy under high-pressure, high-temperature catalytic reaction conditions
Review of Scientific Instruments 85, 083703 (2014); 10.1063/1.4891811
A high-pressure atomic force microscope for imaging in supercritical carbon dioxide
Review of Scientific Instruments 82, 043709 (2011); 10.1063/1.3580603
Combined scanning probe microscopy and x-ray scattering instrument for in situ catalysis investigations
Review of Scientific Instruments 87, 113705 (2016); 10.1063/1.4968804
The “Reactor STM”: A scanning tunneling microscope for investigation of catalytic surfaces at semi-industrial reaction conditions
Review of Scientific Instruments 69, 3879 (1998); 10.1063/1.1149193
A new scanning tunneling microscope reactor used for high-pressure and high-temperature catalysis studies
Review of Scientific Instruments 79, 084101 (2008); 10.1063/1.2960569
Ultrahigh vacuum/high-pressure flow reactor for surface ray diffraction and grazing incidence small angle x-ray scattering studies close to conditions for industrial catalysis
The
ReactorAFM
: Non-contact atomic force microscope operating under
high-pressure and high-temperature catalytic conditions
S. B. Roobol,1,a)M. E. Cañas-Ventura,1,b)M. Bergman,1M. A. van Spronsen,1
W. G. Onderwaater,1P. C. van der Tuijn,1R. Koehler,1A. Ofitserov,2G. J. C. van Baarle,2 and J. W. M. Frenken1,c)
1Huygens-Kamerlingh Onnes Laboratory, Leiden University, P.O. Box 9504, RA Leiden 2300, The Netherlands 2Leiden Probe Microscopy B.V., J.H. Oortweg 21, 2333 CH Leiden, The Netherlands
(Received 25 December 2014; accepted 12 March 2015; published online 30 March 2015)
An Atomic Force Microscope (AFM) has been integrated in a miniature high-pressure flow reactor for in-situ observations of heterogeneous catalytic reactions under conditions similar to those of industrial processes. The AFM can image model catalysts such as those consisting of metal nanopar-ticles on flat oxide supports in a gas atmosphere up to 6 bar and at a temperature up to 600 K, while the catalytic activity can be measured using mass spectrometry. The high-pressure reactor is placed inside an Ultrahigh Vacuum (UHV) system to supplement it with standard UHV sample preparation and characterization techniques. To demonstrate that this instrument successfully bridges both the pressure gap and the materials gap, images have been recorded of supported palladium nanoparticles catalyzing the oxidation of carbon monoxide under high-pressure, high-temperature conditions. C 2015 Author(s). All article content, except where otherwise noted, is licensed under a
Creative Commons Attribution 3.0 Unported License.[http://dx.doi.org/10.1063/1.4916194]
I. INTRODUCTION
Fundamental research on heterogeneous catalysis has been one of the driving forces behind the development of the field of surface science. However, the idealised world of surface-science experiments in Ultrahigh Vacuum (UHV) is radically different from industrial catalytic processes.
While traditional surface chemistry research takes place on single crystal surfaces at pressures below 10−6mbar and temperatures ranging from a few K to beyond 1000 K, the chemical industry uses reactors at pressures that are easily 10 orders of magnitude higher, and only elevated temperatures. In addition, a commercial catalyst usually consists of a com-plex multi-scale material, e.g., metal nanoparticles on some porous oxide support pressed into cm-sized pellets, whereas the typical surface-science experiment is performed on single crystal samples that are extremely flat and homogeneous (the only structure is on the atomic scale, i.e., the crystal lattice).
These two differences between the conditions in tradi-tional surface science and industrial catalysis are known as the pressure gapandmaterials gap, respectively. It is now accepted that it is often incorrect to extrapolate observations across those gaps. This is due to kinetic barriers that cannot be overcome at low temperatures,1differences in coordination
number between single crystal surfaces and nanoparticles,2
and metal-support interactions.3,4
a)Present address: ASML Netherlands B.V., De Run 6501, 5504 DR
Veld-hoven, The Netherlands.
b)Present address: Evonik Industries AG, Paul-Baumann-Straße 1, 45772
Marl, Germany.
c)Author to whom correspondence should be addressed. Electronic mail:
[email protected]. Present address: Advanced Research Center for Nano-lithography, P.O. Box 41883, 1009 DB Amsterdam, The Netherlands.
During the last decade, new instruments have been devel-oped that bridge the pressure- and/or materials gap and allow surface-sensitivein-situmeasurements at the atomic or molec-ular scale. These instruments are based on either averaging techniques or real-space microscopy.
The averaging techniques are all photon based. Examples are vibrational sum frequency generation laser spectroscopy5
and near-ambient pressure X-ray photoelectron spectroscopy,6
giving information on the vibrational states of adsorbed mole-cules and the chemical state of atoms, respectively. A third example is surface X-ray diffraction (SXRD)7 that provides
information on surface structure.
Two approaches are starting to deliver microscopic struc-tural information under catalytic conditions. One is the devel-opment of ultrathin reactors for transmission electron micros-copy.8,9The other is formed by scanning probe microscopes (SPMs). While electron-based techniques are challenging at high pressures because of the short mean free path of elec-trons, scanning probes do not have this intrinsic limitation. The potential of scanning tunneling microscopy (STM) forin-situ
catalysis studies was first explored in 1992.10 Twenty years
later, our group was the first to demonstrate atomic resolution under high-pressure, high-temperature conditions using the ReactorSTM.11,12
Although the ReactorSTM bridges thepressure gap, it can only operate on conductive samples, usually in the form of metal single crystals. To bridge thematerials gap, a different scanning probe technique is needed: Atomic Force Micros-copy (AFM). STM uses an electrical current to probe the sam-ple, whereas AFM uses the interaction force between tip and sample and is independent of the conductivity of the sample. The typical, more realistic, model catalyst that can only be imaged with AFM would consist of a flat oxide substrate, for
033706-2 Roobolet al. Rev. Sci. Instrum.86, 033706 (2015)
example, a single crystal of α–Al2O3 or quartz, with metal particles on top with a diameter of 1-100 nm of some cata-lytically active material, for example, a pure metal or an alloy. This paper introduces the ReactorAFM. It is based on the proven design of the ReactorSTM, but its capability to image supported nanoparticles adds unique value forin-situ
catalysis research. Some other variable pressure AFMs have been reported in literature. The easiest approach is to operate a standard AFM in an environmental chamber,13,14 but this
severely limits the operating temperature range and choice of gases (e.g., no corrosive gases). A more advanced approach uses a high-pressure flow cell that is separated from the piezo of the AFM scanner by a flexible membrane, to operate up to 423 K and 6 bar in liquids,15or up to 350 K and 100 atm
in supercritical CO2.16These two instruments are limited to static AFM (i.e., contact mode) and constant temperature (long equilibration times), but could in principle be applied to cata-lytic systems. TheReactorAFMuses a similar concept with a high-pressure cell that is separated from the scanner, but has superior characteristics for catalysis research.
II. DESIGN SPECIFICATIONS
The purpose of the ReactorAFM is to image heteroge-neous catalytic processes, with gaseous reactants and model catalysts consisting of nanoparticles on a flat substrate un-der conditions relevant for industrial applications. The design specifications described here are a delicate balance between high-resolution imaging, realistic operating conditions, and technical feasibility.
The catalytic reactions in the ReactorAFM must take place under conditions similar to those used in industry, which can be characterised by temperatures ranging from 400 to 1000 K and pressures from 1 to 100 bar. We limit ourselves to the low side of this pressure regime, and to a maximum sample temperature of 600 K, to allow the use of elastomers to seal offthe high-pressure cell. In this way, a very compact design can be made for the reactor and scanner, which has distinct advantages related to mechanical stability, thermal management, and gas handling, as will be discussed in Sec.III. Under any of these operating conditions, the AFM scanner must be able to resolve nanoparticles supported on flat surfaces with sufficient detail: the minimal requirements are a lateral resolution of 1 nm and a vertical resolution of 0.1 nm, with a range of at least 1 µm in each direction. Ideally, atomic resolution on flat surfaces should be achieved, corresponding to one order of magnitude improvement in lateral and vertical resolution.
The AFM scanner should be sufficiently stable to allow uninterrupted imaging of a single feature on the surface for at least 1 h during high-temperature, high-pressure conditions. This places constraints on the thermal drift of the scanner and the thermal drift of the force sensor. In particular, the drift in the lateral directions must be less than 50 nm/min and the vertical drift per hour must be less than the vertical piezo range of 1µm. After a temperature change of more than 25 K, a thermalisation period of at most 30 min is acceptable to stabilise the force sensor.
To interpret atomic-scale microscopy images of catalytic processes, it is essential that the starting situation is known in great detail, i.e., the structure and composition of the freshly prepared sample needs to be controlled down to the atomic scale. This requires standard surface-science techniques that operate in UHV. In addition, the gases and catalyst materials must have the highest available purity (impurity level typically 1-100 parts per million), and the sample cannot be transferred through air once it has been prepared in UHV. Thus, the high-pressure reactor and scanner must be embedded in a UHV system equipped with sample preparation and analysis tools. For some samples, exposure to air might not be a problem, so it should be possible to transfer the sample out of the UHV system to use external preparation or characterisation techniques.
Highly relevant for catalysis is the correlation of the sur-face structure of the catalyst with the activity and selectivity of the process, i.e., the rate of formation of the reaction prod-uct(s). To do this with high sensitivity and time resolution, the reactor needs to be operated in a flow configuration and the gas stream leaving the reactor has to be analysed continuously. The gas manifold that feeds the reactor needs to allow independent control over flow and pressure, to be able to mix several gases over a wide range of mixing ratios. To allow time-resolved experiments, any change in parameters must be performed with a transition time shorter than 5 s.
For accurate reactivity measurements, it is important to avoid spurious catalytic activity on components of the reactor, so all components that are exposed to the high-pressure gases must be inert under the conditions to which they are subjected during normal operation. This means, for example, that stain-less steel is an acceptable material for the capillaries of the gas handling system, which is at room temperature, but not for a reactor wall that will become hot during operation.
In summary, the requirements are the following.
• Imaging: Height-resolution of 0.1 nm on flat surfaces and supported nanoparticles, lateral resolution of 1 nm, under high-pressure, high-temperature conditions, e.g., at 1 bar and 450 K. Acquisition time of 1 min per frame. • High-temperature operation: Sample temperature from room temperature up to 600 K. Thermal drift below 1µm/h (piezo range) inz and below 50 nm/min inx
andy, after an initial thermalization period of 30 min. • High-pressure gas conditions: reactor pressure beyond 1 bar. Arbitrary gas mixtures up to 1:100 ratio. Time constants in gas system (refresh rate of reactor, delay between gas system and reactor, delay between reactor and gas analyser) below 5 s.
III. DESIGN
here. The AFM scanner, however, is substantially different from the STM version.
The AFM scanner is based on the piezoelectric readout of a quartz tuning fork (QTF). The miniature design of the reactor of the ReactorSTM (volume 0.5 ml) does not offer optical access to the tip, ruling out the laser deflection techniques that are common in many AFMs. Quartz is chemically inert, and exceptionally high resolution has been reported using QTF-based AFMs,17,18 making it the ideal choice for the
Reac-torAFM.
A. UHV system
The UHV system is identical to that of the ReactorSTM, and is equipped with several standard techniques for sam-ple preparation (annealing using electron bombardment or radiation heating to over 1000 K, low pressure exposure to oxygen, hydrogen, or other gases, ion bombardment, metal deposition) and characterization (low-energy electron diff rac-tion, Auger electron spectroscopy, and in a later stage, also X-ray photoelectron spectroscopy). The system is divided into several compartments, one chamber containing the high-pressure AFM scanner, another chamber for sample prepara-tion, a third chamber for analysis, and a load lock to transfer samples in and out of the system. This configuration separates the tasks and makes it possible to use corrosive gases for sample preparation, as the sensitive components in the other chambers are not exposed to those gases. A base pressure in the low 10−10mbar range is routinely achieved after bake-out, using a corrosion resistant turbo-molecular pump and several ion pumps combined with titanium sublimation pumps.
Samples can be transferred throughout the setup and into theReactorAFMwithout exposure to air. The sample holders are equipped with 5 electrical connections, two for a heating filament, two for a K-type thermocouple connection, and one to set the sample bias and/or measure (tunnelling) currents. The sample is electrically isolated from the body of the sample
holder. The thermocouple is kept outside the high-pressure environment and if possible it is laser spot-welded directly to the side of the sample. For non-metallic samples, this is usually not possible, so the thermocouple is welded to a molyb-denum backplate that supports the sample. For a weakly heat-conducting oxide substrate, this is estimated to limit the accu-racy of the temperature measurement to a few tens of K.
The reactor with scanner is isolated from building vibra-tions by a spring suspension system with eddy current damp-ing. The UHV setup is supported by four laminar-flow air legs and rests on a separate foundation.
B. Gas system
A computer-controlled gas system mixes up to 5 different gases at ratios ranging from 1:1 up to 1:100, and the mix-tures can be made to flow through the reactor (typical flow 5 mln/min, up to 6 bar). It is equipped with a carbonyl trap consisting of a copper capillary filled with copper braids that is heated to 250◦C. A separate UHV system equipped with a quadrupole mass spectrometer (QMS) and pumped by a turbo molecular pump is used to continuously sample the reaction products. The entire gas system is electrically isolated from the main UHV system by the use of PEEK capillaries to reduce interference from the computer and the gas controllers. The system is optimised for minimal unrefreshed volume, and in combination with the small reactor volume this results in a response time of several seconds, e.g., when changing the composition of the gas mixture. To achieve high purity gas flows, the manifold is bakeable to 70◦C.
C. High pressure reactor with AFM scanner
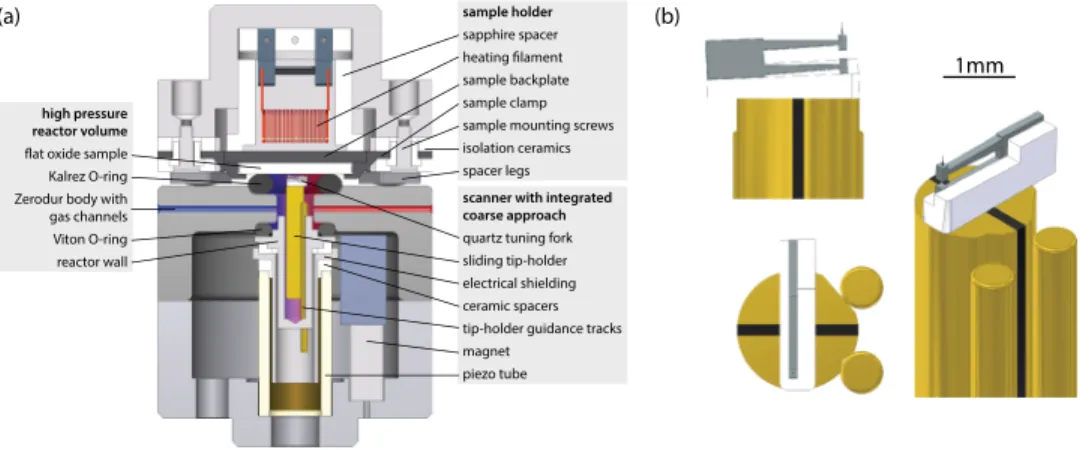
Figure 1(a) shows the design of the AFM scanner in
the high-pressure reactor cell. The model catalyst sample (typically 10×10 mm2, thickness 250µm to 1 mm) forms the topside of the reactor, and the AFM tip approaches it
033706-4 Roobolet al. Rev. Sci. Instrum.86, 033706 (2015)
from below. A Kalrez O-ring forms a leak-tight seal between the sample and the top of the scanner and closes the reactor volume. The sample is heated from the rear by a filament. Kalrez is specified for continuous use up to 600 K, and since the O-ring is in direct contact with the sample, this determines the maximum operating temperature of the scanner.
The scanner, O-ring, and sample are pressed together by inflating a bellows with pressurised air. Three spacers limit the compression of the O-ring and define the mechanical loop of the scanner, resulting in a very stiffand compact design.
A lead zirconate titanate (PZT) piezo tube20 is used for
both the coarse approach and the three-dimensional scanning motion, the latter having a lateral range of approximately 2 µm and vertical range of 1µm. The piezo tube is located outside the high-pressure cell to avoid convective heating via the gas phase, which would result in chaotic thermal drift when operating at high temperatures.
The QTF with the AFM tip is mounted on a rod that is magnetically clamped inside the piezo tube. The rod can slide up and down during coarse approach using a stick-slip motion. The rod consists of two halves, and is held against two tracks by a Sm2Co17magnet located next to the piezo tube. Both the slider and the tracks are made of machine steel and are gold-coated. With this coating, the static friction between the slider and tracks is sufficient to ensure that the slider does not move during normal scanning motion, but low enough to allow the stick-slip motion during coarse approach.
The tracks supporting the slider are mounted on a capped cylinder made of polyetherimide (PEI), which is located in the piezo tube. An additional cylinder made of aluminium between the PEI component and the piezo tube provides electrical shielding from the high piezo voltages. The PEI cylinder also forms part of the reactor wall, so the piezotube is not exposed to the high-pressure gases to avoid chemical and thermal stability issues.
The two tracks are also used as feedthroughs for the two electrical signals of the QTF through the PEI reactor wall. Each track is in contact with one of the two halves of the slider. The tracks traverse the (insulating) PEI component and are con-nected by coaxial cables to floating-shield BNC feedthroughs on the UHV flange of the scanner.
D. Tuning fork and tip
The quartz tuning fork is a commercial miniature crys-tal with a resonance frequency of 32.768 kHz, type number CM8V-T1A from Micro Crystal AG, that has been shortened by wafer cutting such that the prong length is reduced from 1.6 mm to 1.15 mm without altering its electrode topology. After modification, the overall dimensions of the tuning fork are 1.9×0.5×0.12 mm3and the fundamental resonance fre-quency is about 96 kHz.
The tuning fork is mounted using Stycast 2850 epoxy (with catalyst 24 LV) on the slider in the QPlus configuration,19
i.e., the lower prong is completely fixed in glue and the upper prong acts as a single piezoelectric cantilever. After gluing, the
Q-factor of the first resonance at ambient conditions is 3·103. A ceramic (Macor22) spacer is used to tilt the tuning fork to
an angle of 2.5◦to ensure that the apex of the upper prong is
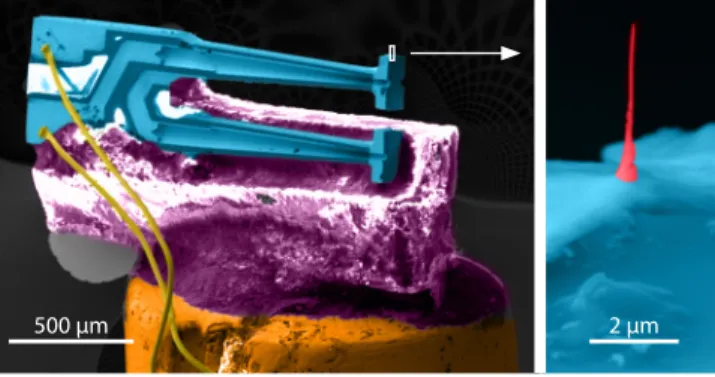
FIG. 2. Scanning Electron Microscopy images with false colours for en-hanced contrast of the QTF glued on a ceramic spacer which is glued to the slider, with a close-up of the apex of the upper prong. The tip is grown using electron-beam-induced deposition of platinum from a MeCpPtMe3
precursor.21
the first part to come in contact with the sample surface. The resulting assembly is shown schematically in Figure1(b), and in Figure2.
On the apex of the upper prong of the tuning fork, a micrometre-sized tip is grown using Electron-Beam Induced Deposition (EBID) of platinum using a Scanning Electron Microscope (SEM). This is done at room temperature in a
FEI Nova NanoSEM 200 with MeCpPtMe3 as precursor,21
resulting in a structure consisting of 16 atom% platinum, the remainder being amorphous carbon.23Typical growth
parame-ters are 15 keV electron energy, beam current of 1.4 nA, beam focused to a single spot of 5 nm, pressure 3·10−5mbar, for 2-5 min. This results in a tip with a length of 2-5 µm and a diameter of 0.1µm. The radius of curvature of the tip apex is 30 nm. The tip is positioned on one of the electrodes of the tuning fork, but the conductivity is too low to measure tunneling currents. The tip is mechanically stiff enough for AFM measurements, but it can easily be wiped offwith a tissue and replaced with a new one if needed.
The electrical connections from the tuning fork electrodes to the slider are made by ball bonding using 25µm diameter gold wires. The electrical path continues via the tracks that support the slider, followed by coaxial cables to the UHV feedthroughs.
E. Electronics
The AFM operates in a mode known as Non-Contact (NC) or Frequency-Modulation (FM), a technique that has been demonstrated to even give sub-atomic resolution and quantitative force measurements for sufficiently sharp tips.24
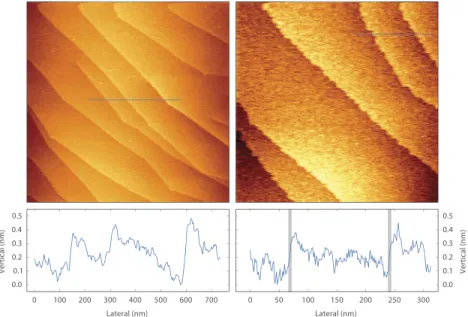
FIG. 3. Mono-atomic steps on a Ag(111) single crystal at room temperature. No post processing has been performed except for line-by-line background subtraction. Left panels, in UHV, image size 1.6×1.6µm2, frequency shift+18 Hz, 1.0 nm oscillation amplitude, acquisition time 524 s. Right panels, in a
flow of 2 mln/min of 120 mbar ethylene gas with sulfur impurities, image size 800×800 nm2, frequency shift+21 Hz, oscillation amplitude 1.0 nm, acquisition
time 262 s. Under these conditions, the surface shows roughening of the steps, and structures with sub-ångstrom height on the terraces. To estimate the lateral resolution, the broadening of atomic steps has been measured and was typically 5 nm, the grey lines in the height profile mark this width (the lateral resolution in the left panels was limited by the scan speed).
constant frequency shift. A separate feedback system adjusts the drive amplitude to keep the oscillation amplitude constant, thereby ensuring that the surface of constant frequency shift corresponds to a surface of constant force gradient. The drive signal of this amplitude feedback loop is recorded in a separate channel and can be used to derive the dissipative force.
The tuning fork motion is controlled via an excitation/ detection circuit located directly outside the UHV system. It is based on a circuit introduced by Grober et al.25 which compensates for the stray capacitance of the tuning fork and
measures the (oscillating) current through the tuning fork with an I-V convertor when it is driven at resonance by an external oscillator voltage source. The I-V converter is based on the OPA657 operation amplifier from Texas Instruments and has a gain of 1 V/nA and a bandwidth of 100 kHz.
A Zurich Instruments HF2LI lockin amplifier with phase-locked loop detects the shift in resonance frequency of the QTF and supplies the oscillating drive voltage at resonance. The height feedback and scanning is performed using high speed SPM electronics from Leiden Probe Microscopy.26
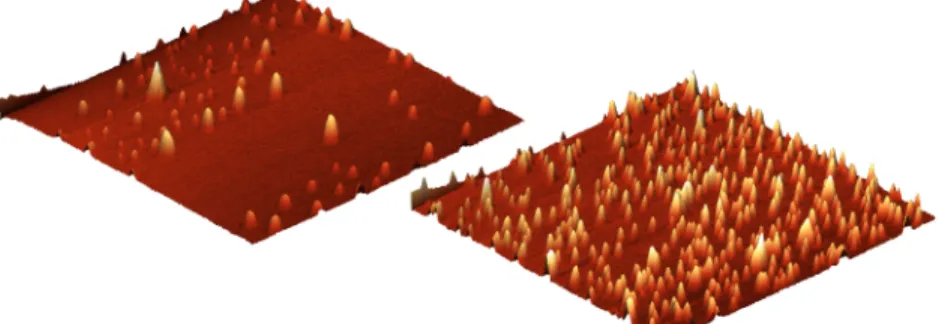
FIG. 4. Palladium nanoparticles onα–Al2O3, image size 700×700 nm2, frequency shift setpoint+5 Hz, oscillation amplitude 5 nm, acquisition time 131 s
per frame. No post processing has been performed except for planar background subtraction. Left panels, 425 K, 1 bar 1:1:20 Ar:CO:O2mixture, total flow
033706-6 Roobolet al. Rev. Sci. Instrum.86, 033706 (2015)
IV. PERFORMANCE
A. Imaging
Due to limitations of the SPM control electronics, it was not possible to systematically characterise the perfor-mance of the ReactorAFM using force-distance curves. In-stead, monoatomic terraces and steps on the (111) surface of a silver crystal have been imaged, in UHV and in flows of ethylene (Figure3). These images show a lateral resolution of 5 nm and a vertical resolution of 0.05 nm, as determined from the line profiles. The lateral resolution is presumably limited by the sharpness of the EBID tip.
A catalytically more relevant demonstration is the imag-ing of palladium nanoparticles on a simag-ingle crystal ofα–Al2O3. Figures 4 and 5 show these particles at 425 and 475 K in two mixtures of carbon monoxide, oxygen, and argon at 1 bar. This sample has been produced ex-situ by a spark-discharge method.27 Ex-situ sample preparation gives
addi-tional flexibility, for example, this spark-discharge method produces particles with a well-defined size, but it adds the risk of introducing contaminations during sample transfer. Even though the lateral dimensions of the images of the particles are influenced by the shape of the tip—a common problem with AFM28—these images directly give unique information on
the particle morphology and size distribution under catalytic conditions. Such images enable us to accurately measure the particle density and the height distribution. Even though the observed lateral size of the particles is affected by the convolution with the tip contour, variations in the particle size in response to changes in the chemical environment can be followed easily.
B. Influence of environment on QTF
Quartz resonators can be employed to measure tempera-ture and several fluid properties (density, viscosity, and derived quantities).29,30 These sensor applications use the resonance
frequency or the damping of the oscillator to detect changes in the environment. Unfortunately, the same parameters are used to perform the height feedback in a NC-AFM configura-tion. Since the “parasitic” influences of the environment can be dominant over the effects “of interest” of the tip-sample interaction, a brief discussion is in place on the influence of the gas environment and the temperature.
The density and viscosity of the surrounding fluid influ-ence the damping of the QTF, but this is easily compensated for by the amplitude feedback, and at highQit only results in a small change in resonance frequency. More problematic is that the fluid adds to the effective mass of the resonator,30 thereby further affecting the resonance frequency. For the Re-actorAFM, filling the reactor with 1000 mbar argon starting from low vacuum (<10 mbar) leads to a frequency shift of −50 Hz and a drop in Q-factor from 1·104to 3·103.
When using mixtures of gases such as oxygen, carbon monoxide, nitric oxide, carbon dioxide, nitrogen, and argon, only limited total pressure variations can be tolerated because of these gas effects on resonance frequency and damping, but partial pressures can be changed freely since the fluid prop-erties of these gases are sufficiently similar. However, when us-ing mixtures of light gases such as hydrogen or helium together with a heavy gas, care needs to be taken not to change the total density and viscosity too much while scanning. This can be achieved by adjusting the total pressure or by compensation of the mixture by adding an appropriate amount of a heavy inert gas such as argon or xenon. In addition, the resonance frequency of the QTF is sensitive to temperature. This derives from the anisotropic thermal expansion of the crystal lattice. Since our particular QTF is designed as a reference oscillator and not as a temperature sensor, the orientation of the lattice is optimised for frequency stability at its standard operating temperature, 25◦C. However, in theReactorAFMthe sample can be heated to 600 K, and even though the QTF will not reach this temperature, it will have an effect on the resonance frequency. In this case, the resonance frequency typically shifts by 150 Hz when heating from RT to 423 K in 120 mbar argon in the first 45 min, during which scanning should be avoided, followed by a continuous drifting of 30 Hz per hour, which is attributed to the long-term thermalization of the scanner. While scanning, it is convenient to operate the sample heater at constant power (i.e., without temperature feedback) to keep the drift (both spatial and resonance frequency) monotonous. A further complication can be introduced by combined effects of the fluid properties with temperature: changing the gas mixture changes the thermal conductivity of the gas in the reactor and this results in a change of temperature of the QTF. Additionally, the viscosity of a fluid is strongly dependent on temperature, and this in turn influences the damping. These effects, however, are minimised using the precautions mentioned here.
V. CONCLUSION AND OUTLOOK
TheReactorAFMcombines a UHV system with a
high-pressure reactor and allows in-situ investigations of model catalysts. The scanner uses a miniature quartz tuning fork with a micrometre-sized tip, operates in non-contact mode, and fits in the 0.5 ml reactor. Nanometre resolution is demonstrated under high-temperature, high-pressure conditions on a sample of supported metal nanoparticles. This instrument establishes an essential step to bridge thepressure gapandmaterials gap. The sharpness of the EBID tip is currently the limit-ing factor for the lateral resolution of the instrument. Tests with a micromanipulator are in progress to attach various prefabricated tips to the QTF, e.g., an etched metal wire (as commonly used in STM and NC-AFM) or a tip from a stan-dard AFM silicon cantilever. Another development in progress
is the modification of the ReactorAFM to enable NC-AFM
with simultaneous tunneling current measurements (STM), by adding a separate electric path to the tip. In addition, prelim-inary experiments have been performed with a version that fits onto the high-pressure flow reactor for SXRD and grazing incidence small angle X-ray scattering (GISAXS) developed by van Rijn et al.7 This instrument will allow higher
oper-ating temperatures and it opens the way towards the direct correlation of real-space observations with reciprocal-space measurements.
ACKNOWLEDGMENTS
The authors would like to thank M. E. Messing from Lund University for providing the palladium nanoparticle samples. This project is financially supported by a Dutch SmartMix grant and the NIMIC partner organizations through NIMIC, a public-private partnership.
1J. Rogal, K. Reuter, and M. Scheffler, “CO oxidation on Pd(100) at
techno-logically relevant pressure conditions: First-principles kinetic Monte Carlo study,”Phys. Rev. B77, 155410 (2008).
2B. Corain, G. Schmid, and N. Toshima,Metal Nanoclusters in Catalysis and
Materials Science(Elsevier, 2011).
3W. C. Conner, Jr. and J. L. Falconer, “Spillover in heterogeneous catalysis,”
Chem. Rev.95, 759 (1995).
4J. Y. Park, J. R. Renzas, A. M. Contreras, and G. A. Somorjai, “The genesis
and importance of oxide–metal interface controlled heterogeneous catalysis; the catalytic nanodiode,”Top. Catal.46, 217 (2007).
5G. Rupprechter, “Sum frequency laser spectroscopy during chemical
reac-tions on surfaces,”MRS Bull.32, 1031 (2007).
6H. Bluhm, M. Havecker, A. Knop-Gericke, M. Kiskinova, R. Schlogl, and
M. Salmeron, “In situ x-ray photoelectron spectroscopy studies of gas-solid interfaces at near-ambient conditions,”MRS Bull.32, 1022 (2007).
7R. van Rijn, M. Ackermann, O. Balmes, T. Dufrane, A. Geluk, H. Gonzalez,
H. Isern, E. de Kuyper, L. Petit, V. A. Sole, D. Wermeille, R. Felici, and J. W. M. Frenken, “Ultrahigh vacuum/high-pressure flow reactor for surface x-ray diffraction and grazing incidence small angle x-ray scattering studies close to conditions for industrial catalysis,”Rev. Sci. Instrum.81, 014101 (2010).
8J. F. Creemer, S. Helveg, G. H. Hoveling, S. Ullmann, A. M. Molenbroek,
P. M. Sarro, and H. W. Zandbergen, “Atomic-scale electron microscopy at ambient pressure,”Ultramicroscopy108, 993 (2008).
9J. F. Creemer, F. Santagata, B. Morana, L. Mele, T. Alan, E. Iervolino, G.
Pandraud, and P. M. Sarro, “An all-in-one nanoreactor for high-resolution microscopy on nanomaterials at high pressures,” inProceedings of the IEEE 24th International Conference on Micro Electro Mechanical Systems (IEEE, 2011), p. 1103.
10B. J. McIntyre, M. Salmeron, and G. A. Somorjai, “A scanning tunneling
microscope that operates at high pressures and high temperatures (430 K) and during catalytic reactions,”Catal. Lett.14, 263 (1992).
11C. T. Herbschleb, P. C. van der Tuijn, S. B. Roobol, V. Navarro, J. W. Bakker,
Q. Liu, D. Stoltz, M. E. Cañas-Ventura, G. Verdoes, M. A. van Spronsen, M. Bergman, L. Crama, I. Taminiau, A. Ofitserov, G. J. C. van Baarle, and J. W. M. Frenken, “The ReactorSTM: Atomically resolved scanning tunneling microscopy under high-pressure, high-temperature catalytic reaction condi-tions,”Rev. Sci. Instrum.85, 083703 (2014).
12M. A. van Spronsen, G. J. C. van Baarle, C. T. Herbschleb, J. W. M. Frenken,
and I. M. N. Groot, “High-pressureoperandoSTM studies giving insight in CO oxidation and NO reduction over Pt(110),”Catal. Today244, 85 (2015).
13D. D’Agostino, D. Jay, and H. McNally, “Development and testing of
hyperbaric atomic force microscopy (AFM) for biological applications,” Microsc. Microanal.16, 1042 (2010).
14J. Lievonen, K. Ranttila, and M. Ahlskog, “Environmental chamber for an
atomic force microscope,”Rev. Sci. Instrum.78, 043703 (2007).
15S. R. Higgins, C. M. Eggleston, K. G. Knauss, and C. O. Boro, “A
hydro-thermal atomic force microscope for imaging in aqueous solution up to 150◦C,”Rev. Sci. Instrum.69, 2994 (1998).
16A. S. Lea, S. R. Higgins, K. G. Knauss, and K. M. Rosso, “A high-pressure
atomic force microscope for imaging in supercritical carbon dioxide,”Rev. Sci. Instrum.82, 043709 (2011).
17F. J. Giessibl, S. Hembacher, and H. Bielefeldt, “Subatomic features on
the silicon(111)−(7×7)surface observed by atomic force microscopy,” Science289, 422 (2000).
18L. Gross, F. Mohn, N. Moll, P. Liljeroth, and G. Meyer, “The chemical
structure of a molecule resolved by atomic force microscopy,”Science325, 1110 (2009).
19F. J. Giessibl, “High-speed force sensor for force microscopy and
pro-filometry utilizing a quartz tuning fork,” Appl. Phys. Lett. 73, 3956 (1998).
20EBL #2 piezoceramic tube, EBL Products,http://www.eblproducts.com/. 21Z. Xue, M. J. Strouse, D. K. Shuh, C. B. Knobler, H. D. Kaesz, R.
F. Hicks, and R. S. Williams, “Characterization of (methylcyclopentadi-enyl)trimethylplatinum and low-temperature organometallic chemical va-por deposition of platinum metal,”J. Am. Chem. Soc.111, 8779 (1989).
22Macor Machinable Glass Ceramic, Corning Inc.,http://www.corning.com/. 23A. Botman, M. Hesselberth, and J. J. L. Mulders, “Improving the
conduc-tivity of platinum-containing nano-structures created by electron-beam-induced deposition,”Microelectron. Eng.85, 1139 (2008).
24F. J. Giessibl, “Advances in atomic force microscopy,”Rev. Mod. Phys.75,
949 (2003).
25R. Grober, J. Acimovic, J. Schuck, D. Hessman, P. J. Kindlemann, J.
Hes-panha, and A. S. Morse, “Fundamental limits to force detection using quartz tuning forks,”Rev. Sci. Instrum.71, 2776 (2000).
26M. J. Rost, L. Crama, P. Schakel, E. van Tol, G. van Velzen-Williams,
C. F. Overgauw, H. Ter Horst, H. Dekker, B. Okhuijsen, and M. Seynen, “Scanning probe microscopes go video rate and beyond,”Rev. Sci. Instrum.
76, 053710 (2005).
27M. E. Messing, R. Westerström, B. O. Meuller, S. Blomberg, J. Gustafson, J.
N. Andersen, E. Lundgren, R. van Rijn, O. Balmes, H. Bluhm, and K. Dep-pert, “Generation of Pd model catalyst nanoparticles by spark discharge,”J. Phys. Chem. C114, 9257 (2010).
28J. S. Villarrubia, “Algorithms for scanned probe microscope image
simu-lation, surface reconstruction, and tip estimation,”J. Res. Natl. Inst. Stand. Technol.102, 425 (1997).
29E. P. Eernisse, R. W. Ward, and R. B. Wiggins, “Survey of quartz bulk
resonator sensor technologies,”IEEE Trans. Ultrason. Ferroelectr. Freq. Control35, 323 (1988).
30K. K. Kanazawa and J. G. Gordon II, “The oscillation frequency of a quartz