INVESTIGATING THE PREDICTIVE VALUE OF INFANT ATTENTION BEHAVIORS AND PROFILES FOR DETECTING DIFFERENCES IN SELF-REGULATION AND
SOCIAL AND SENSORY RESPONSIVENESS IN THE TODDLER AND EARLY PRESCHOOL YEARS
Maura Sabatos-DeVito
A dissertation submitted to the faculty of the University of North Carolina at Chapel Hill in partial fulfillment of the requirements for the degree of Doctor of Philosophy in the
Department of Psychology (Developmental Psychology).
Chapel Hill 2014
Approved By: J. Steven Reznick Grace T. Baranek Martha Cox
© 2014
ABSTRACT
Maura Sabatos-DeVito: Investigating the Predictive Value of Infant Attention Behaviors and Profiles for Detecting Differences in Self-Regulation and Social and Sensory Responsiveness
in the Toddler and Early Preschool Years (under the direction of J. Steven Reznick)
Research shows that individual differences in early attentional skills supported by the orienting and executive attention networks of the brain are predictive of later self-regulation and social competence in the toddler and preschool years. Furthermore, early deficits in attentional orienting and disengagement are predictive of a diagnosis of Autism Spectrum Disorder (ASD). The First Year Inventory (FYI) is a parent-report measure of social-communication and sensory-regulatory behaviors of 12-month-olds designed to assess risk for Autism Spectrum Disorder (ASD). Three new constructs measuring features of social and sensory attention linked to the orienting and executive attention networks were developed from the items on the FYI, and validated on a measure of social responsiveness and
ACKNOWLEDGEMENTS
To my advisor: You are the reason I decided to attend the graduate program in developmental psychology at UNC. Thank you for allowing me to learn from you. Thank you for your patience, unconditional support, and mentorship. And thank you for making me a Tar Heel fan! I am forever grateful.
To my fellow graduate student, Rebecca Stephens, and the Reznick Research Team: This research endeavor would not have been possible without all of your hard work,
dedication, humor, encouragement, and support. A special thank you to Becca for your friendship and support, especially in this past year.
To my committee: Thank you for your insights, feedback, and support throughout this dissertation process and the broader graduate school experience.
To my family: There are no words to express the gratitude I feel for your
unconditional love, encouragement and support, especially throughout these graduate school years. A special thank you to Anthony, for your sacrifice, hard work, patience, and
TABLE OF CONTENTS
LIST OF TABLES ... viii
LIST OF FIGURES ... x
I. INTRODUCTION ... 1
1.1. Development of Attention Networks ... 4
1.2 The Role of Orienting and Executive Attention Networks in the Development of Reactivity, Attentional Self-Regulation, and Social Competence ... 8
1.3 Attention Constructs Derived from the FYI ... 16
1.4 Overview of Studies 1 and 2 Goals and Participants ... 20
II. STUDY 1: DEVELOPING ATTENTION PROFILES FROM THE FYI AND VALIDATING ATTENTION CONSTRUCTS AND PROFILES WITH EXISTING DATA ... 23
2.1 Aim 1: Establishing Attention Profiles from the FYI ... 24
2.1.1 Methods ... 24
2.1.2 Results ... 26
2.1.3 Summary of Aim 1 Findings ... 31
2.2 Aim 2: Exploring the Predictive Value of Attention Constructs in a High-Risk Cohort .. 34
2.2.1 Methods ... 34
2.2.2 Results ... 37
2.2.3 Summary of Aim 2 Findings ... 42
2.3 Aim 3: Validating the Ability to Detect Differences Among Attention Profiles in Normative and High-FYI Risk Cohorts with Existing Data ... 46
2.3.1 Methods ... 47
2.3.2 Results ... 48
2.3.3 Summary of Aim 3 Findings ... 52
3.1 Research Questions and Hypotheses ... 62
3.2 Methods ... 64
3.3 Results... 72
3.3.1 Social Responsiveness/Impairment ... 72
3.3.2 Sensory Responsiveness ... 74
3.3.3 Temperament ... 78
3.3.4 Attentional Regulation/Dysregulation ... 85
3.4 Study 2 Discussion ... 90
IV. DISCUSSION ... 97
4.1 Overview of Findings ... 98
4.2 Implications ... 100
4.3 Limitations and Future Directions ... 101
4.4 Conclusions ... 103
APPENDIX 1. OPERATIONAL DEFINITIONS OF FYI ATTENTION CONSTRUCTS ... 126
APPENDIX 2. ITEMS COMPRISING FYI ATTENTION CONSTRUCTS ... 127
APPENDIX 3. FYI ORIGINAL RISK SCORING VERSUS DIMENSIONAL SCORING ... 128
APPENDIX 4. CORRELATIONS OF ATTENTION CONSTRUCTS WITH FYI RISK DOMAINS ... 132
LIST OF TABLES
Table 1.1. Cut-off scores for three constructs using the expanded (30/50/70) scoring criteria derived from attention construct means of the Complete
FYI Cohort (N=9,582). ... 104
Table 1.2. Sample size for each attention profile using Restricted (30/70) and
Expanded (30/50/70) scoring criteria for Three FYI Cohorts ... 105
Table 1.3. Description of eight attention profiles using expanded (30/50/70)
scoring criteria ... 106
Table 1.4. Means and Group Differences for FYI Risk Domains, Attention Constructs, Sensory Responsiveness and Temperamental Reactivity and
Self-Regulation Outcomes for Study 1 Norm Cohort (N=369)a ... 108
Table 1.5. Comparison of FYI risk domains, attention constructs, sensory responsiveness and temperament outcomes across attention profiles of the
Study 1 Risk Cohort ... 109
Table 1.6. Correlations of attention constructs with FYI risk domains, sensory response patterns, and temperamental reactivity/self-regulation for the
Study 1 Risk Cohort ... 110
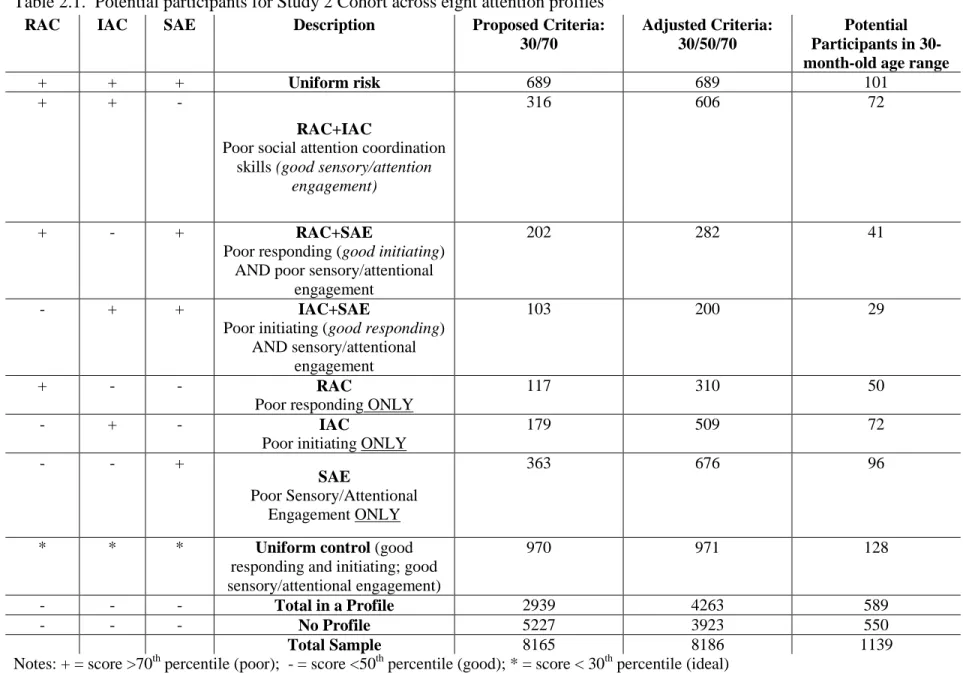
Table 2.1. Potential participants for Study 2 Cohort across eight attention profiles ... 111
Table 2.2. Comparison of demographics for the Study 2 participants with complete
data versus incomplete data ... 112
Table 2.3. Final clustering of BDQ items in attentional regulation constructs... 114
Table 2.4. Correlations of BDQ attentional regulation constructs with the ECBQ and
Kinsbourne Over-focusing Scale outcomes for Study 2 Cohort ... 115
Table 2.5. Comparison of FYI risk domains and attention constructs at 12 months and social and sensory outcomes at 30 months across attention profiles of the
Table 2.6. Extreme Observations of SRS Total Raw Scores for Study 2 Cohort ... 117
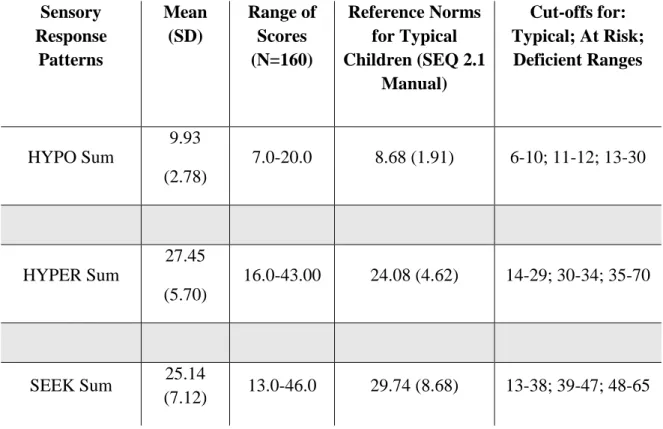
Table 2.7. Comparison of Study 2 Cohort’s (N=160) sensory response patterns means
with SEQ 2.1 reference norms for typical children ... 118
Table 2.8. Comparison of temperament and attention regulation/dysregulation outcomes
at 30 months across attention profiles of the Study 2 Cohort ... 119
Table 3.1. Attention constructs predicting sensory and temperament outcomes for
Study 1 Risk and Study 2 Cohorts ... 120
Table 3.2. Attention constructs predicting social responsiveness and attention
regulation/dysregulation outcomes for Study 2 Cohort ... 121
Table 3.3. Comparison of attention construct means of Study 1 Risk Cohort and
LIST OF FIGURES
Figure 1.1. Distribution of the RAC Mean for the Complete FYI Cohort (N=9,582)
with expanded (30/50/70) scoring criteria ... 123
Figure 1.2. Distribution of the IAC Mean for the Complete FYI Cohort (N=9,582)
with expanded (30/50/70) scoring criteria ... 124
Figure 1.3. Distribution of the SAE Mean for the Complete FYI Cohort (N=9,582)
LIST OF ABBREVIATIONS ASD Autism Spectrum Disorder
BDQ Behavioral Dimensions Questionnaire ECBQ Early Childhood Behavior Questionnaire EDP Early Development Project
FYI First Year Inventory
IAC Initiating Attention Coordination IJA Initiating Joint Attention
KOS Kinsbourne Overfocusing Scale
RAC Responding to Attention Coordination RJA Responding to Joint Attention
SAE Sensory Attentional Engagement SEQ Sensory Experiences Questionnaire
I. INTRODUCTION
The development of self-regulation begins early in life as a co-regulatory process between a caregiver and an infant (Posner & Rothbart, 2009), and is influenced by both early patterns of reactivity to novel sensory input (Calkins, Fox, & Marshall, 1996) and the brain’s developing orienting attention network (Posner & Rothbart, 2000). According to Rothbart’s model of temperament, reactivity refers to both positive (e.g., approach) and negative (e.g., aversion, withdrawal) behaviors (i.e., affective, motor and attentional orienting) in response to changes in the environment (Rothbart, Sheese, Rueda, & Posner, 2011). Reactivity patterns emerge in the first few months of life and include both negative and positive features. Self-regulation skills develop considerably between two and five years of age (Kopp, 1982), supported by the brain’s emerging and developing executive attention network (Rothbart et al., 2011), and are a key component of social competence in the preschool and early childhood years (Eisenberg, Fabes, Murphy, Maszk, Smith, & Karbon, 1995). Self-regulation involves effortful control, or a set of attentional processes (e.g., focusing, shifting) and behavioral skills (e.g., inhibiting, activating) that modulate emotional and physiological
reactivity (Derryberry & Rothbart, 1988; Rothbart & Derryberry, 1981).
sensory, attentional, motor or affective processes, and in organizing a calm, alert, or affectively positive state" (Zero to Three, 1994, p. 30). Early dysregulation predicts social-emotional (Calkins & Fox, 1994; Eisenberg et al., 2001) and sensory integration (DeGangi, DiPietro, Greenspan, & Porges, 1991) difficulties, two domains which are associated with an ASD diagnosis. Regulatory disorders also predict delays in motor, language, and cognitive development (DeGangi, Breinbauer, Roosevelt, Porges, & Greenspan, 2000) as well as global developmental delays (Fox & Porges, 1985).
As an interventionist working with toddlers identified as at-risk for an Autism Spectrum Disorder (ASD), I observed many instances of dysregulated emotions and
behaviors, heightened affective reactivity, and poor social reciprocity. When a child was in a dysregulated state (which was often), it was very difficult to engage the child in joint,
reciprocal, social interactions and to build new social-communicative learning opportunities. For example, one child (Toddler A) generally had a positive affect, and would often initiate an activity with a social partner and respond to a social partner’s bids to interact. However, when challenged to stay in an activity and take turns, Toddler A often either became slightly aggressive or escaped to another room or activity, as if over-aroused and overwhelmed or not able to sustain his attention. Although Toddler A would escape activities that required
sustained interaction, he did not withdraw into himself or turn to self-soothing strategies; rather, he would redirect his attention to a novel activity and initiate an interaction with the new toy.
invite a social partner into the activity. When challenged to interact or change play behaviors, Toddlers B and C would often resist or ignore the social partner, and express negative affect by having an emotional meltdown or withdrawing. However, their self-regulatory behaviors differed. Toddler B would usually seek out and be soothed by her mothers’ comfort (i.e., co-regulate), whereas Toddler C would initially escape to another room and self-soothe with a pacifier but would allow her mother to initiate attempts to comfort. Both Toddlers B and C had more negative affectivity and less social responsiveness compared to Toddler A; however, Toddler B was more responsive to social partners than Toddler C, making eye contact, sharing affect, and responding to highly animated, expressive bids for interaction from a social partner. All three toddlers had different self-regulatory skills, with Toddler C frequently engaging in self-soothing behaviors, more often than Toddlers A and B.
1.1. Development of Attention Networks
An extensive literature search, combined with my clinical observations, suggest that the development of self-regulation is supported by increasing control over and integration of attentional processes in the first four years of life (Rothbart et al., 2011). Specifically, the
orienting and executive attention networks (described by Peterson & Posner, 2012; Posner & Peterson, 1990) have both unique and overlapping developmental trajectories that establish attentional control processes in the first years of life, influencing a child’s ability to regulate emotions and behaviors and successfully interact with the social and nonsocial environments.
Orienting (Posterior) Attention Network: Development and Functions
The orienting, or posterior, attention network, guides attention to external sensory stimuli and enhances the ability to perceive and process external stimuli (Harman & Fox, 1997; Mundy & Newell, 2007; Peterson & Posner, 2012; Posner & Peterson, 1990). This network, which recruits temporal and parietal cortices and the frontal eye fields (Posner & Fan, 2008), supports three mechanisms of attentional control: 1) flexible attention
disengagement; 2) shifting attention; and 3) engaging/processing new information (Harman & Fox, 1997; Mundy, Sullivan & Mastergeorge, 2009; Vaughan van Hecke & Mundy, 2007).
and prone to more displays of negative affect, they are also becoming more open to attentional distraction (Harman & Fox, 1997), a skill that can help reduce and regulate negative emotions. For example, when caregivers of 3- and 6-month-olds showed their distressed infants a novel object, displays of negative affect decreased (Harman et al., 1997). Also, 4-month-olds with more flexible orienting skills are reported to have lower negative emotionality and more soothability on a parent-report of temperament (Johnson et al., 1991). Thus, attentional shifting is considered an early component of temperamental self-regulation, and therefore is included in Rothbart’s measurement of self-regulation (i.e., effortful control) (Putnam, Gartstein & Rothbart, 2006).
Toward the end of the first year, infants are generally less distressed and better able to control their attention because the orienting network is more mature and the executive
Executive (Anterior) Attention Network: Development and Functions
The second year of life marks a transition from an orienting system of attention to an
executive, or anterior, attention network (Davis, Bruce, & Gunnar, 2002). The executive network is responsible for volitional, internal, goal-directed allocation of attention (Banich, Milham, Atchley, Cohen, Webb & Wszalek, 2000; Posner, 1995; Posner & Petersen, 1990), the ability to monitor and resolve conflict (Botvinick, Braver, Barch, Carter, & Cohen, 2001), and increasing sustained attention. Sustained attention, consideredan attentional component of effortful control (Rothbart, Ellis, Rueda, & Posner, 2003), refers to the ability to maintain focus on and actively engage with a stimulus or task (Ruff & Rothbart, 1996). The executive attention network has a later emerging and more protracted developmental course than the
orienting (posterior) network (Mundy & Newell, 2007).
Whereas in the first year, infants develop flexible attention that is open to distraction, in the second year infants gain voluntary control of attention, which promotes the
response (Posner & Rothbart, 2000), but at 30 months children are able to slow down and resolve conflict (Gerardi-Caulton, 2000). In the third and fourth years, executive control functions improve (e.g., planning, working memory, set shifting, cognitive flexibility, error monitoring, and inhibition), each with its own developmental course (see Diamond, 2002 for a review).
The executive attention network is associated with components of reactivity (negative emotionality) and regulation (effortful control). Lab-based measures of executive attention are associated with a parent-report measure of effortful control, and high effortful control is, in turn, related to low negative affect (Rothbart, 2011; Rothbart & Rueda, 2005). Focused attention is associated with reactivity patterns, serving as a protective factor against negative emotionality (Ruff & Lawson, 1994). For example, toddlers with higher negative
emotionality have lower sustained attention levels during play tasks (Gaertner, Spinrad, & Eisenberg, 2008). Emotion regulation strategies are also associated with sustained attention in the toddler and preschool years (Graziano, Calkins & Keane, 2011). For example, two-year-olds who used active emotion regulation strategies (e.g., help-seeking behaviors) had higher levels of sustained attention, whereas those who relied on passive emotion regulation strategies (e.g., avoidance behaviors) had lower levels of sustained attention (Graziano et al., 2011). Thus, the executive network has important reciprocal interactions with features of reactivity and self-regulation.
Orienting and Executive Networks: Independent and Interacting Functions
reactivity and self-regulation. Rothbart and colleagues hypothesize that the orienting network dominates emotion regulation in infancy, but in the preschool years, the executive network takes over and the orienting network, while still present and active, takes a secondary role in self-regulation (Rothbart et al., 2007). Thus, attentional control is achieved when the
executive network takes over many control functions from the orienting network (Posner & Peterson, 1990), selecting targets based on internal meaning and goals, but giving control to the orienting network when attention to the external environment is needed (Harman & Fox, 1997).
To what extent do compromised orienting and/or executive attention networks in the first year of life impact temperamental reactivity and self-regulation patterns, the
development of attentional regulation (or dysregulation), and social competence (or impairment) in the toddler and preschool years? Which features of attention are most predictive of reactivity patterns, attentional regulation skills, and social competence? Furthermore, which combinations of attentional features in the first year are associated with poor versus optimal temperamental affect, attentional self-regulation, and social
responsiveness in the early preschool years? I will address these questions through this dissertation research.
1.2 The Role of Orienting and Executive Attention Networks in the Development of Reactivity, Attentional Self-Regulation, and Social Competence
attention; RJA) and using gaze and gesture to direct others’ attention (initiating joint attention; IJA).
A multi-process model of joint attention, proposed by Mundy and colleagues, suggests that joint attention behaviors (responding, initiating) reflect distinct processes that include both common and unique sources of variance (Mundy & Willoughby, 1996; Mundy, Card & Fox, 2000; Mundy & Sigman, 2006; Vaughan van Hecke & Mundy, 2007).
According to this model, integrated activity of the orienting and executive networks supports the overall capacity for joint attention (Mundy & Newell, 2007), but the posterior (orienting) network primarily fosters the development of RJA behaviors while the anterior (executive) network facilitates IJA development (Mundy & Newell, 2007). This hypothesis is supported by joint attention measures demonstrating a low correlation between IJA and RJA in early development (Mundy & Gomes, 1998; Mundy et al., 2000; Vaughan van Hecke et al., 2007), and dissociable paths of development and impairment in ASD (Mundy, Kasari, Sigman, & Ruskin, 1995).
steeply than IJA skills between 9 and 15 months (Carpenter et al., 1998; Mundy et al., 2007). Individual differences in RJA and IJA are evident as early as 8 to 9 months (Mundy et al., 2007; Venezia, Messinger, Thorpe & Mundy, 2004) but continue to develop in the toddler and preschool years (MacDonald et al., 2006). This pattern of RJA development early in the first year of life aligns with the developmental course of orienting mechanisms.
Mundy and colleagues hypothesize that joint attention and self-regulatory skills are associated through attentional control and deployment of attention (Mundy & Burnette, 2005; Mundy & Sigman, 2006). The multi-process model is supported by research demonstrating the unique predictive capabilities of RJA and IJA. RJA is predictive of attention-related self-regulation strategies of toddlers (Morales, Mundy, Crowson, Neal, & Delgado, 2005) and preschoolers (Vaughan Van Hecke et al., 2007; Vaughan van Hecke et al., 2012), whereas IJA is associated with response inhibition (i.e., the ability to inhibit a prepotent response) (Dawson et al., 2002; Nichols, Fox, & Mundy, 2005). For example, toddlers with better RJA at 6 months and 12 months use more active, attention-based regulation strategies during delay of gratification tasks at 24 months (Morales et al., 2005) and 36 months of age (Vaughan van Hecke et al., 2012). These unique behavioral findings are supported by
neuroanatomical evidence that RJA is regulated by temporal and parietal systems involved in attention disengagement and orienting, as well as monitoring others’ behavior (Kingstone, Friesen, & Gazzaniga, 2000; Mundy et al., 2000; Puce, Allison, Bentin, Gore, & McCarthy, 1998; Vaughan Van Hecke & Mundy, 2007).
Twelve-month-olds who showed more IJA behaviors had greater parent-reported social competence at 30 months. Better preschool IJA, but not RJA, skills also predict the tendency to initiate social interactions in children with autism (Sigman & Ruskin, 1999). IJA may be a unique predictor of social competence because it requires self-initiating, social-emotional approach behaviors, whereas RJA is a responsive measure (Mundy & Sigman, 2006). Mundy and colleagues hypothesize that IJA behaviors (e.g., pointing, showing) reflect
social-motivation factors in social interactions more so than the responsive behaviors of RJA (Kasari, Sigman, Mundy & Yirmiya, 1990; Mundy, Kasari, & Sigman, 1992; Venezia et al., 2004).
In sum, joint attention behaviors, supported by orienting and executive attention processes that emerge in the first two years of life, are predictive of self-regulation (Morales et al., 2005; Vaughan van Hecke et al., 2012) and social competence (Vaughan van Hecke et al., 2007) in the second and third years of life and are associated with positive and negative affect and reactivity, an important component of self-regulation (Mundy et al., 1992; Vaughan et al., 2003). Furthermore, deficits in RJA and IJA are commonly observed in individuals with ASD (Mundy et al., 1992). Thus, joint attention is an important candidate measure of early attentional features that can potentially tap the integrity of the underlying orienting and executive attention networks at 12 months and predict individual differences in later temperamental reactivity, attentional self-regulation and social competence, as well as risk for ASD. Importantly, the above-mentioned research suggests that an attention profile of 12-month-olds should measure responding and initiating behaviors of joint attention
supported by different attention networks, and predict unique aspects of self-regulation and social competence.
Over-focused Attention and Sensory Response Patterns. The above research suggests that deficits in joint attention originate from disrupted mechanisms of the orienting and/or
executive networks early in development. Although some evidence suggests that preschoolers with ASD do not have executive network deficits (Dawson et al., 2002; Griffith et al., 1999; Yerys et al., 2007), orienting network deficits as early as the first year of life are well documented and continue through early childhood. Infants and children with ASD exhibit deficits in two orienting network mechanisms: disengagement and shifting. Disengagement deficits are evident in infant siblings of children with ASD (Elsabbagh et al., 2009) and young children diagnosed with ASD (Landry & Bryson, 2004). At 12 months, longer visual disengagement latencies of infant siblings is predictive of an ASD diagnosis (Sacrey, Bryson, & Zwaigenbaum, 2013; Zwaigenbaum et al., 2005), and these longer disengagement
latencies during play with objects are evident between 12 and 24 months (Sacrey et al., 2013). Infants with ASD also show less attention shifting during free play (Swettenham et al., 1998) and less orienting to visual and auditory social stimuli (Maestro et al., 2002; Osterling & Dawson, 1994; Osterling, Dawson & Munson, 2002). Children with ASD also fail to orient as frequently to social and nonsocial stimuli compared to typical and
developmentally delayed peers (Dawson, Meltzoff, Osterling, Rinaldi & Brown, 1998; Dawson et al., 2004).
attention? Research on attention in children with ASD and my clinical experiences suggest that children with ASD often become very focused on and overly engaged in repetitive and sensory seeking behaviors with toys, objects and features of the sensory environment. Is it possible that an orienting network deficit early in development, and perhaps an emerging executive attention network deficit, contribute to a pattern of over-focused, sensory-focused attention, and pose an elevated risk for heightened negative reactivity, poor attentional self-regulation and social impairment in the toddler and preschool years?
In my clinical experience, I have certainly observed children at risk for and diagnosed with ASD who become attentionally stuck on and overly engaged with a toy, object, or pattern of behavior. Such perseverative over-focusing makes it very difficult to enter into the child’s play and create a joint activity. Often, I would use a strategy of face-to-face play without toys so as to build social reciprocity without the competing presence of a toy. As described earlier, Toddlers B and C often perseverated on patterns of play or features of toys, making it difficult to interact in social, flexible manner. It is possible that these behaviors indicated an underlying orienting and/or executive network deficit.
(e.g., tactile hypersensitivity, irritability) in an effort to accommodate dysregulation (Gomez, Baird, & Jung, 2004). Although focused attention is generally considered a positive feature of attentional control supported by the executive network, it is possible that orienting network deficits lead to over-focused attention. If optimal focused attention is associated with reduced negative emotionality (Gaertner et al., 2008) and emotion regulation (Graziano et al., 2011), is it possible that over-focused attention is associated with increased negative reactivity?
Behavioral responses and reactivity to novelty in ASD are referred to as sensory response patterns. Three primary sensory response patterns, which often co-occur (Baranek, David, Poe, Stone & Watson, 2006; Ben-Sasson, Cermak, Orsmond, Tager-Flusberg, Kadlec & Carter, 2008; Liss et al., 2006), have been reported in ASD: 1) hyporesponsiveness, which refers to failed or delayed responses to sensory stimuli (e.g., failure to orient to one’s name being called) (Baranek, Watson, Boyd, Poe, David & McGuire, 2013; Ben-Sasson et al. 2007); 2) hyperresponsiveness, which refers to exaggerated or avoidant responses to sensory input (e.g., covering ears in response to auditory input) (Baranek, Boyd, Poe, David & Watson, 2007; Ben-Sasson, Hen, Fluss, Cermak, Engel-Yeger & Gal, 2009; Schoen, Miller & Green, 2008); and 3) sensory seeking, which refers to intense sensory interests, cravings or repetitions (e.g., staring at lights, smelling objects) (e.g., Ben-Sasson et al., 2007; Liss et al., 2006).
orienting network. Further, little is known about the association of sensory response patterns with features of temperamental reactivity and regulation. One study explored the association of sensory response patterns with features of temperament in ASD and found that
hyporesponsiveness was correlated with low distractibility and slowness to adapt (Brock, Freuler, Baranek, Watson, & Sabatino, 2012), perhaps indicating a link to over-focused attention and an underlying disengagement deficit. Furthermore, increased sensory features in general were associated with greater withdrawal and more negative affect in ASD (Brock et al., 2012), indicating a link between sensory features and negative affectivity, a feature of temperament that interacts with the development of self-regulation. Another study of
typically-developing, school-aged children (Ben-Sasson, Carter, & Briggs-Gowan, 2009; Ben-Sasson et al., 2009) demonstrated that sensory overresponsivity (i.e.,
hyperresponsiveness) is associated with emotional problems, dysregulation, and social difficulties. Together, these studies suggest that certain behavioral patterns characteristic of ASD may be associated with deficits of the orienting network, including joint attention deficits (Mundy & Jarrold, 2010; Mundy, Sigman, & Kasari, 1994), over-focused attention (Liss et al., 2006), and sensory response patterns (Baranek et al., 2006).
and predictive of differences in temperamental reactivity, attentional self-regulation, sensory responsiveness and social responsiveness/impairment.
1.3 Attention Constructs Derived from the FYI
To investigate these curiosities, I first needed to identify a measure that could tap these features of attention that are supported by the orienting and executive networks and could predict differences in reactivity, attentional regulation, and social competence. The First Year Inventory (FYI; Baranek, Watson, Crais, & Reznick, 2003), a caregiver-report developed to identify 12-month old infants at risk for a diagnosis of ASD (Reznick, Baranek, Reavis, Watson, & Crais, 2007), was identified as a viable tool to address my research interests. Items in the FYI were created based on research evidence of early behavioral risk markers of ASD in the social-communication and sensory-regulatory domains. Thus, the items, although selected and scored to identify atypical behaviors, represent both typical and atypical features of development in the first year. For example, the item “Does your baby turn to look at you when you call your baby’s name?” was selected because one of the earliest and most reliable social behavioral risk markers for ASD is a lack of orienting to one’s name (Osterling & Dawson, 1994; Osterling et al., 2002; Werner, Dawson, Osterling, & Dinno, 2000). However, this item is also relevant to tapping information about individual differences in social attentional orienting skills across all 12-month-olds.
of skills across a community sample. Items in the constructs were scored from 1 (never) to 4 (always), with higher scores representing poor attentional skills at 12 months. Statistical analyses were conducted to determine the constructs’ internal consistency.
The three attention constructs, reflecting features of social and sensory attention in the first year of life, include: 1) response to attention coordination (RAC, 14 items, α = .729,
M = 1.38, SD = 0.27, Range = 1.0-3.667); 2) initiating attention coordination (IAC, 8 items, α = .747, M = 1.62, SD = 0.46, Range = 1.0-4.0); and 3) sensory attentional engagement
(SAE, 12 items, α = .786, M = 1.81, SD = 0.47, Range = 1.0-3.83). Broadly, the first two constructs (RAC, IAC) tap the responding and initiating aspects of social attention
coordination, whereas the third construct (SAE) taps infants’ style of attentional focus on and engagement with objects and sensory features of objects and their own bodies. Operational definitions, as well as a list of included items, for each construct are available in Appendices 1 and 2. A complete list of FYI items, with risk-scoring and dimensional scoring approaches is also available in the Appendix 3.
considered, including aberrant sensory response patterns (Baranek et al., 2006; Baranek et al., 2013), repetitive/perseverative behaviors (Boyd, McBee, Holtzclaw, Baranek & Bodfish, 2009; Boyd et al., 2010), and over-focused attention (Liss et al., 2006). Finally, research on the impact of joint attention and focused attention on features of temperamental reactivity, attentional self-regulation, and social competence were considered. For example, initiating joint attention skills play a role in the development of social responsiveness (Vaughan van Hecke et al., 2007) and social impairment (Lord et al., 2003; Sigman & Ruskin, 1999), whereas responding joint attention behaviors are predictive of emotion regulation strategies in the preschool years (Vaughan Van Hecke et al., 2012).
These attention constructs have the potential to offer unique insights into individual differences in the outcomes of interest, as well as capture a more fine-grained picture of the attentional strengths and weaknesses of those at risk for ASD. Correlational analyses of the new attention constructs, conducted by Stephens et al. (in prep), demonstrate that, although statistically significantly related to the original FYI risk domains, all correlations are primarily in the low to moderate range. See Appendix 4 for correlation coefficients. Importantly, RAC was significantly correlated with both the Social-Communication and Sensory-Regulatory FYI domains, whereas IAC was only significantly related to the Social-Communication domain and SAE was only significantly related to the FYI
Stephens et al. (in prep) tested the predictive utility of the three constructs on social responsiveness/impairment outcomes (Social Responsiveness Scale-Preschool Version, SRS-P; Pine, Luby, Abbacchi, & Constantino, 2006) at 36 months. Multiple linear regressions with all three attention constructs were applied to the SRS-P total raw scores both with (N=732) and without (N=729) outliers, with comparable results. The new attention constructs significantly predicted social responsiveness/impairment at 36 months (F (2, 726)=49.36,
p<0.0001), accounting for 16.96% of the variance in SRS-P total raw scores (Stephens et al., in prep). Furthermore, all three 12-month-old attention constructs were significantly,
positively associated with SRS-P total raw scores at 36 months old. Thus, higher social attention coordination scores (i.e., poorer responding to and initiating of social attention bids) and higher sensory attentional engagement scores (i.e., more over-focused sensory attentional engagement) at 12 months are predictive of higher social responsiveness/impairment scores (i.e., poorer social responsiveness) at 36 months of age.
the three attentional features predict better or worse outcomes. For example, is a child who has poor attentional responding (RAC) and over-focused attention (SAE) at 12 months more likely to have elevated negative reactivity and poor attentional self-regulation than a child who also has over-focused attention (SAE), but good attentional responding (RAC)? Although both Toddlers B and C seemed to have over-focused attention, they had slightly different joint attention capacities, which possibly influenced the success of some strategies over others. For example, Toddler B, who had slightly better responding to joint attention behaviors, could be brought into more interactive play through very silly and highly animated, exaggerated facial expressions and play actions. In contrast, Toddler C, who seemed to have much poorer responding to joint attention behaviors, required very physical, sensation enhancing play to become more affectively and socially interactive. Study 1 will address the goal of using attention profiles developed from the attention constructs to determine group differences in later outcomes.
1.4 Overview of Studies 1 and 2 Goals and Participants
The overall aims of Studies 1 and 2 are to address the following two research questions: 1) To what extent do features of attention at 12 months relate to and predict later functioning in social, sensory, temperament, and attention domains?, and 2) Are there significantly different outcomes in social, sensory, temperament, and attention domains for groups with different attention profiles?
measured by well-validated questionnaires from an existing dataset (Study 1, Risk Cohort, 13-16 months), 3) determining the utility of attention profiles for detecting group differences on social responsiveness/impairment outcomes (Study 1, Norm Cohort, 36 months) and sensory and temperament outcomes (Study 1, Risk Cohort, 13-16 months), and 4) assessing individual and group differences in parent-reported social responsiveness/impairment, sensory, temperament, and attention regulation skills in a normative sample at 30 months (Study 2).
Parents were initially recruited from the community and asked to complete the First Year Inventory. This Complete FYICohort (N=9,582) is comprised of two separate samples, the Normative FYICohort (N = 1,305) and the Early Development Project-2 (EDP-2) FYI Cohort (N = 8,277). The Normative FYICohort includes 12-month-olds from 6 counties surrounding Chapel Hill, NC whose data were used to develop the original risk scoring algorithm for the FYI (for details, see Reznick et al., 2007), and who were subsequently followed at several time points up to eight years of age. The EDP-2 FYICohort includes 12-month-olds within a 9-county radius of Chapel Hill with FYI data. Those who met criteria for risk on both domains of the FYI were invited to participate in a randomized clinical trial and were randomized to either an intervention or a control group following baseline assessments at 13-16 months. Combining these two community-based samples resulted in a total sample of 9,582 participants with FYI data at 12 months (i.e., Complete FYICohort). This Complete FYICohort (N=9,582) was used to develop the attention constructs (Stephens et al., in prep), and to determine cut-off scoring criteria for the attention profiles (Study 1).
Study 1 then made further use of existing caregiver-report data from two
was to further determine the predictive validity of the attention constructs for sensory and temperament outcomes in a high-FYI-risk sample (Study 1 Risk Cohort), and to explore group differences among attention profiles on well-validated measures of social
responsiveness/impairment at 36 months (Study 1 Norm Cohort), and sensory responsiveness and temperament at 13-16 months (Study 1 Risk Cohort).
Study 2 involved recruiting parents of children from the EDP-2 FYICohort. These children did not meet the dual-domain high-FYI risk criteria at 12 months (i.e., they were not part of the Study 1 Risk Cohort analyses), and thus had not yet been re-contacted for follow-up assessments. Parents of the Study 2Cohort were contacted between April and September 2014 and asked to complete on-line questionnaires measuring their child’s social
responsiveness/impairment, sensory responsiveness, temperament, and attention regulation at 30 months.
Due to the relatively small sample sizes of each cohort in both studies, several steps were taken to identify outliers, and explore the impact of outliers on all results. For
II. STUDY 1: DEVELOPING ATTENTION PROFILES FROM THE FYI AND VALIDATING ATTENTION CONSTRUCTS AND PROFILES WITH EXISTING
DATA
Stephens et al. (in prep) demonstrated that measures of social and sensory attention at 12 months have predictive value for understanding individual differences in social
responsiveness/impairment outcomes in the early preschool years. Understanding how these features of attention predict other outcomes (e.g., sensory responsiveness, temperament) may inform efforts to identify individual differences in reactivity and self-regulation, two
important predictors of social competence in the preschool years. These attention constructs also have the potential to be combined to represent attention profiles that can be tested for differences in social, sensory, and temperament outcomes. Understanding differences in outcomes for groups with different profiles of attention at 12 months (i.e., combinations of features of attention that are more or less ideal) may help identify children at greater risk for self-regulation difficulties, and ASD-related social and sensory impairments. This
information could be used to develop intervention strategies tailored to specific attention subgroups.
The Complete FYICohort used by Stephens et al. (in prep) was used to address Aim 1. Existing parent-report data from two sub-samples of the Complete FYICohort were used to achieve Aims 2 and 3, including: 1) a community-based, normative FYI cohort with social responsiveness outcomes at 36 months of age (Study 1 Norm), and 2) a community-based, high-FYI risk cohort with sensory responsiveness and temperament outcomes gathered between 13 and 16 months of age (Study 1 Risk).
2.1 Aim 1: Establishing Attention Profiles from the FYI
The first aim of Study 1 was to develop attention profiles from the FYI-derived attention constructs. Scoring criteria were selected for each construct to represent the best and worst attentional skills, as well as mixed profiles of attention, at 12 months.
2.1.1 Methods
Participants. As in Stephens et al. (in prep), FYI data from participants from the Complete FYICohort (N=9,582) was used to develop scoring criteria for and definitions of attention profiles. This cohort represents two community-based samples of 12-month-olds from counties surrounding Chapel Hill, N.C., who were identified through two different, existing research projects.
The first sub-sample (Study 1 Norm Cohort) was extracted from a set of children from the Normative FYI Cohort (N = 1,305) who had a variety of follow-up measures at 2, 3, 5 and 8 years (for details, see Turner-Brown et al., 2012). All participants with an existing caregiver-report measure of social responsiveness/impairment at 36 months were identified (N=732), and the scoring criteria were applied to determine and test attention profiles.
The second sub-sample (Study 1 RiskCohort), derived from the EDP-2 FYI Cohort (N = 8,277), included 96 toddlers (Mean Age=13.8 months, Range=13-16 months) who met FYI risk cut-off criteria on both the social-communication and sensory-regulatory domains. The scoring criteria for attention profiles were also applied to this sample.
Measures. The First Year Inventory (FYI; Baranek et al., 2003) is a caregiver-report measure of 12-month-olds’ behaviors associated with risk for ASD. The questionnaire consists of 63 questions that represent two ASD-relevant domains of behavior: social-communication and sensory-regulatory. Both domains are comprised of four constructs. Of the 63 questions, 46 items are rated on a 4-point scale (never, seldom, sometimes, often), 14 items are rated on a multiple choice scale with 3 or 4 choices, one item asks caregivers to report consonant sounds produced by their child, and two questions are open-ended, inquiring about parental concerns and physical/medical characteristics of the child. Risk scores are available for the following outcomes: social-communication, sensory-regulatory, total risk, and risk percentile. Stephens et al.’s (in prep) dimensional scoring approach and three attention constructs (RAC, IAC, SAE) were used for all regression and group
differences analyses in Studies 1 and 2.
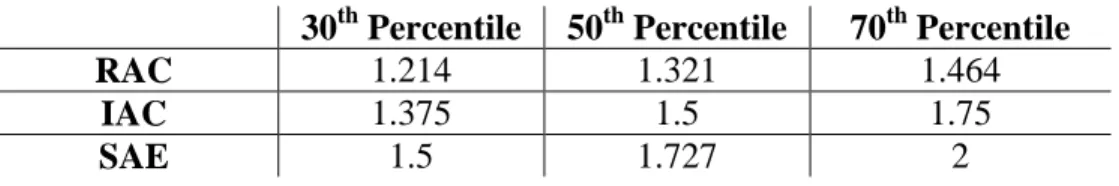
10th, 20th, and 30th percentiles and 70th, 80th, and 90th percentiles were identified for each construct to represent cut-off values for the “best” and “worst” scores, respectively. Scores at the 50th percentile of each constructs’ distribution of means were also identified. Item scores ranged from 1 to 4, with ‘1’ representing the best functioning and ‘4’ representing the poorest functioning on the behavior in question. Thus, on any of the three constructs, “good” scores are closer to means of “1” and “poor” scores are closer to means of “4”.
Two scoring criteria were identified, a restricted (30/70) approach and an expanded
(30/50/70) approach (see Results for a detailed description of both approaches). Both scoring approaches were then applied to the Complete FYICohort, as well as the smaller
sub-samples (Study 1 Norm CohortandStudy 1 RiskCohort). This step informed which scoring criteria would be most successful for analyzing additional, longitudinal data and detecting group differences in later outcomes. All attention profiles were defined (see Table 1.x). Outcomes (FYI risk domains and attention constructs) were then tested for differences between attention profiles for the Study 1 Norm and Risk Cohorts (see Results). FYI risk
outcomes included social-communication risk, sensory-regulatory risk, total risk, and risk percentile, with higher scores representing greater risk. Attention constructs were measured as means of scores for the three constructs, RAC, IAC, and SAE, with higher scores
representing poorer functioning.
2.1.2 Results
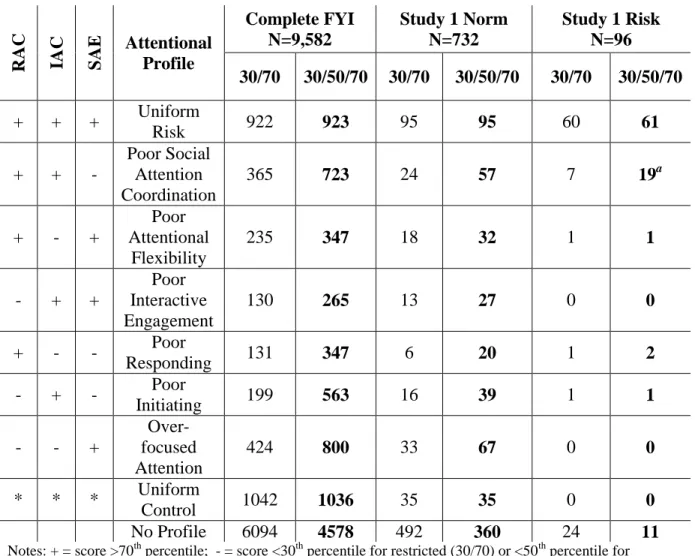
greater than or equal to the 70th percentile cut-off value for each construct. For example, the “Poor Social Attention Coordination” profile is defined as those who have poor responding to and initiating of social attention coordination bids (poor RAC+IAC) AND good sensory attentional engagement (good SAE). Thus, to be characterized in the “Poor Social Attention Coordination” profile, an individual would need scores at or above the 70th percentile cut-off values for both RAC and IAC, and a score at or below the 30th percentile cut-off value for SAE.
The expanded (30/50/70) approach also used the 70th percentile cut-off values to represent “poor” functioning for an attention construct. However, the requirement for “good” functioning for an attention construct for mixed profiles was expanded to include participants with mean scores at or below the 50th percentile cut-off value (rather than the 30th percentile cut-off values) on a construct. For example, under these criteria, “Poor Social Attention Coordination” is still defined as having poor responding and initiating social attention skills (RAC and IAC at or above 70th percentile cut-off values), but “good” sensory attentional engagement (SAE) is defined as a score at or below the 50th percentile cut-off value. In this expanded approach, the 30th percentile cut-off values were only used for one attention profile, the Uniform Control group, which represents a group that is “good” at responding, initiating, and sensory attentional engagement (i.e., scores at or below the 30th percentile cut-off values for RAC, IAC and SAE). This group was formed so as to directly compare later outcomes to a group that is “bad” at all three constructs, Uniform Risk (i.e., scores at or above the 70th percentile cut-off values for each construct). The exact cut-off values
SAE, see Table 1.1. For a graphical representation of the cut-off criteria applied to the distributions of mean scores for each construct, see Figures 1.1 (RAC), 1.2 (IAC), and 1.3 (SAE).
When the cut-off values for the restricted and expanded scoring approaches were applied to the three separate samples with FYI scores, it became evident that the expanded
(30/50/70) approach would be best to use. This approach captures more individuals in each of the mixed attention profiles, and reduces the number of participants who fail to be characterized by any of the attention profiles (see Table 1.2). For example, using the
expanded (30/50/70) scoring approach, 131 additional participants were captured across the eight attention profiles in the Study 1 Norm Cohort, and 15 additional participants were categorized in profiles with the Study 1 RiskCohort (see Table 1.2).
Eight attention profiles were identified and defined: Uniform Risk (RAC+IAC+SAE scores at or above the 70th percentile cut-off values), Uniform Control (RAC+IAC+SAE scores at or below the 30th percentile cut-off values); three groups characterized as poor at just one construct (RAC only; IAC only; SAE only, with scores at or above the 70th
percentile cut-off value for the “poor” construct and scores at or below the 50th percentile for the other two constructs); and three groups characterized as poor at two constructs
(RAC+IAC; RAC+SAE; IAC+SAE, with mean scores at or above the 70th percentile on two constructs, and a mean score at or below the 50th percentile for the remaining construct). See Table 1.3, for a description of each profile.
constructs (e.g., Uniform Risk and Poor Social Attention Coordination groups are both defined as having RAC and IAC mean scores above the 70th percentile cut-off value, and thus should not differ on RAC and IAC means, but should differ on SAE means). FYI risk
and attention construct outcomeswere tested with a series of one-way ANOVAs between all eight attention profiles for the Study 1 Norm Cohort (see Table 1.4 for all means and
contrasts). Separate t-tests were conducted to compare two attention profiles of the Study 1 Risk Cohort on the FYI risk and attention construct outcomes (see Table 1.5 for all means and contrasts).
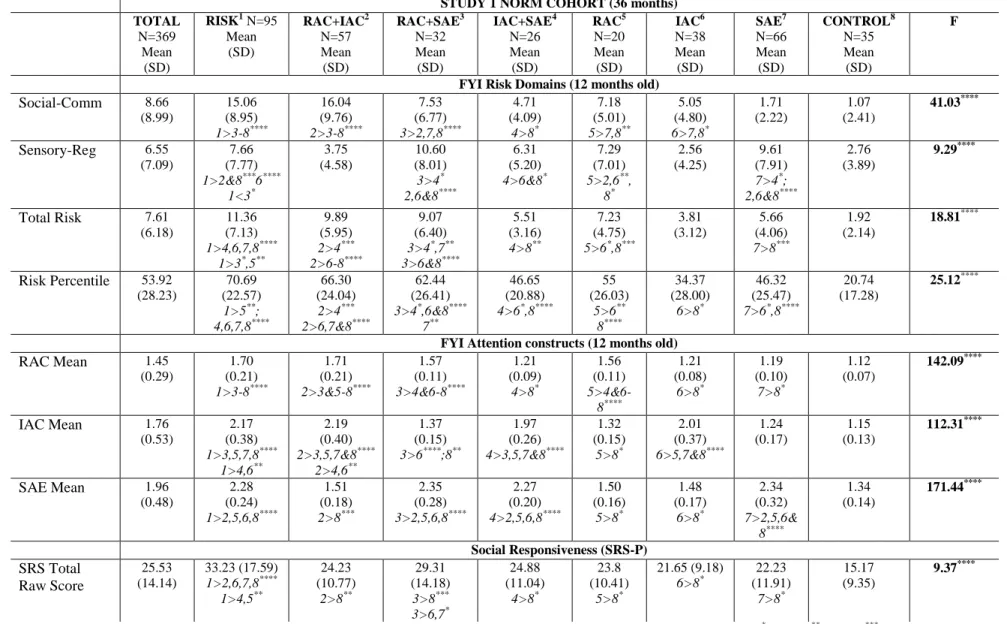
Study 1 Norm Cohort. Two groups (Uniform Risk and Poor Social Attention
Coordination), groups that share poor RAC and poor IAC criteria (i.e., scores at or above the 70th percentile cut-off values), did not significantly differ on either their RAC or IAC means. These two groups share RAC cut-off criteria with two other attention profiles (RAC only; RAC+SAE); here, significant differences in RAC means were detected, such that the
Uniform Risk and Poor Social Attention Coordination profiles had significantly greater RAC means than the RAC only and RAC+SAE groups. The Uniform Risk and Poor Social
Attention Coordination (RAC+IAC) groups also share IAC cut-off criteria with two groups (IAC only; IAC+SAE). When comparing these groups on IAC means, Uniform Risk and Poor Social Attention Coordination had significantly greater IAC means compared to IAC only and IAC+SAE. Finally, groups that share SAE cut-off criteria include Uniform Risk, RAC+SAE, IAC+SAE, and SAE only. Analyses confirmed that there were no significant differences in SAE means among these four groups.
greater FYI social-communication risk scores than groups without RAC and IAC in their profiles (e.g., SAE only, Control). Indeed, analyses confirmed that the Uniform Risk and Poor Social Attention Coordination profiles had the highest FYI social-communication risk
scores, significantly higher than all other attention profiles, even those with a deficit in just one feature of social attention (i.e., either RAC or IAC above the 70th percentile cut-off value). These two groups also had significantly greater FYI total risk and risk percentiles
compared to all other groups. One other group, Poor Attentional Flexibility (RAC+SAE above the 70th percentile cut-off values), had significantly greater FYI total risk and risk percentile than all other groups, and had the highest FYI sensory-regulatory risk compared to all other groups (even Uniform Risk). See Table 1.4 for all means and contrasts for the FYI risk outcomes for all eight attention profiles.
Study 1 Risk Cohort. With high FYI risk scores, most participants in the Study 1 Risk Cohort were identified in the Uniform Risk profile (RAC+IAC+SAE; N=61) and the Poor Social Attention Coordination profile (RAC+IAC; N=20). This finding suggests that in other samples (e.g., normative, non-risk samples), 12-month-olds who meet criteria for the
Uniform Risk and Poor Social Attention Coordination groups may represent attention
profiles with elevated scores on ASD-relevant outcomes (e.g., sensory responsiveness, social impairment).
Coordination (N=19). Uniform Risk includes poor SAE (i.e., SAE mean score above the 70th percentile cut-off value), whereas Poor Social Attention Coordination does not (i.e., SAE mean score below the 50th percentile cut-off value). Analyses confirmed that Uniform Risk had higher FYI sensory-regulatory riskand a greater SAE mean than Poor Social Attention Coordination (RAC+IAC) (see Table 1.5 for means and t-values). In contrast, both groups are defined as meeting criteria for poor RAC and poor IAC (i.e., cut-off scores above the 70th percentile). These definitions were confirmed with no significant differences between groups for FYI social-communication risk or RAC and IAC means (see Table 1.5 for means and t-values).
2.1.3 Summary of Aim 1 Findings
Analyses of the Study 1 Norm and Risk Cohorts’ FYI risk domains and attention construct means for each attention profile demonstrate that, for the most part, groups do not differ on shared features of attention, and do differ on unique features of attention. For example, in the Study 1 Risk Cohort, the group with the highest mean scores on all three attention constructs (Uniform Risk: RAC+IAC+SAE) has significantly greater sensory attentional engagement mean scores (i.e., more over-focused, sensory-focused attention) and greater FYI sensory-regulatory risk, but the same levels of responding and initiating social attention and FYI social-communication risk compared to the Poor Social Attention Coordination group (RAC+IAC).
The Study 1 Norm Cohort, with six additional attention profiles, revealed a slightly different pattern of results. That is, some groups defined as having high RAC or IAC, actually had different mean levels of RAC and IAC, whereas all groups defined as having high SAE had the same mean levels of SAE. The Uniform Risk and Poor Social Attention Coordination groups did not differ from each other in mean RAC or IAC levels (as was found with the Study 1 Risk Cohort), but those two groups did have higher means on RAC and IAC compared to other groups defined as having high RAC (RAC only; RAC+SAE), or IAC (IAC only, IAC+SAE). It is possible that high levels of both RAC and IAC at 12 months (Uniform Risk, Poor Social Attention Coordination) signify greater overall joint attention deficits, a red flag for ASD. In contrast, a deficit in only one domain of social attention (RAC or IAC), either alone or combined with an SAE deficit, may signify a developmental
compared to other 12-month-olds. In contrast, RAC should be well-established at 12 months; thus, a deficit in RAC alone, or in combination with SAE, may be a more concerning pattern of development than a deficit in IAC alone. Nevertheless, an RAC deficit alone, or with SAE, would still not be as strong a red flag as a deficit in both RAC and IAC, or all three attention features, at 12 months. These hypotheses need to be tested and validated with different outcome measures.
Overall, findings related to Aim 1 demonstrate that the attention profiles complement the original FYI risk scoring and two-domain, risk-scoring approach by further distinguishing subgroups of children within a high-FYI risk cohort and a normative cohort. Understanding additional information about the attentional tendencies of subgroups with high FYI risk may serve to inform intervention strategies. For example, while both high-FYI risk groups (Uniform Risk, Poor Social Attention Coordination) might benefit from strategies that target joint attention skills and social responsiveness, children who are characterized as high-FYI risk and Uniform Risk may also benefit from strategies that target over-focused, sensory-focused behaviors and help build more attentional flexibility. Future studies should investigate the use of different attentional strategies for children classified in different attention profiles.
data, and in Study 2 with new data. First, Aim 2 will assess the predictive value of the attention constructs for sensory and temperament outcomes in a high-risk sample. 2.2 Aim 2: Exploring the Predictive Value of Attention Constructs in a High-Risk Cohort
Stephens et al. (in prep) demonstrated the predictive validity of three FYI-derived attention constructs for social responsiveness at 36 months using the Study 1 Norm Cohort (N=732). As previously reviewed, the attention constructs are also hypothesized to be associated with, and predictive of, sensory response patterns and features of temperamental reactivity and self-regulation. The Study 1 Risk Cohort, with available measures of sensory responsiveness and temperamental reactivity and self-regulation at 13-16 months,
represented an opportunity to further test and validate these attention constructs. Thus, the second aim of Study 1 was to explore the predictive value and association of the attention constructs (RAC, IAC, SAE) with existing parent-report data from this high-FYI-risk sub-sample from the Complete FYI Cohort.
2.2.1 Methods
Participants. For Aim 2, participants included the sub-sample from the EDP-2 FYI Cohort (N = 8,277) with high-FYI-risk scores (Study 1 Risk Cohort, N=96). Prior to enrolling in a randomized, controlled trial (RCT) of a parent-mediated intervention, these toddlers were evaluated on a variety of parent-report and observational assessments. For these analyses, the Study 1 RiskCohort included 95 toddlers (Mean Age=13.8 months, Range=13-16 months) who met risk cut-off criteria on both the FYIsocial-communication
participant was dropped from the analyses due to missing data on all temperament outcomes).
Measures.
The First Year Inventory. See the above description.
Sensory Experiences Questionnaire-Version 2.1. The Sensory Experiences
Questionnaire (SEQ; Baranek, 1999a; Baranek et al., 2006) is a 41-item questionnaire for which caregivers rate the frequency of their child’s behavioral responses to sensory input across modalities (visual, auditory, tactile), contexts (social, non-social) and response patterns (i.e., hypo- and hyper-responsiveness, and sensory seeking) on a 5-point Likert scale. The SEQ has been validated for children with ASD, developmental delay (DD), and typical development (TD) between 6 months and 6 years of age (Baranek et al., 2006), and has demonstrated high levels of internal consistency and test–retest reliability (Little et al., 2011). Summary scores can be calculated for hypo and hyper-responsiveness, and sensory seeking to both social and nonsocial stimuli. Hyporesponsiveness refers to a lack of or delayed response to sensory input, hyperresponsiveness refers to avoidance of or defensive response to sensory input, and sensory seeking refers to craving sensory input.
subscales of discomfort, fear, motor activation, sadness, perceptual sensitivity, shyness, soothability, frustration) and surgency/extraversion (with subscales of impulsivity, activity level, high-intensity pleasure, sociability, positive anticipation), and one that represents self-regulation: effortful control (with subscales of inhibitory control, attention shifting, low-intensity pleasure, cuddliness, attention focusing) (Putnam et al., 2006).
Procedures. Questionnaire data was collected and scored as part of the Early
Development Project-2 (EDP-2), a randomized clinical trial that identified children at risk on both domains of the FYI and invited them to participate in a parent-mediated intervention. Analyses of the Study 1 Risk Cohort’s (N=95) data were conducted to determine associations and predictive validity of the constructs with sensory responsiveness and temperament
outcomes at 13-16 months. This sample represents dual-domain, high-FYI risk, and thus a more restricted sample than the Study 1 Norm Cohort (used in Stephens et al.’s regression analyses). Correlations between the three attention constructs and between the attention constructs and FYI risk domains were explored. Correlations and regression analyses were then conducted to determine the degree to which the three attention constructs are associated with, and predictive of, sensory response patterns and temperament features at 13-16 months.
Data Analysis.Sensory responsiveness was measured as mean scores for three sensory response patterns collapsed across context and modality: hyporesponsiveness;
distraction and sustaining attention on an object of attention). Higher scores for
surgency/extraversion and negative affectivity represent more frequent/elevated reactivity behaviors. Lower scores for effortful control reflect less frequent use of self-regulation skills,
and lower scores for attention shifting and attention focusing represent less attentional flexibility and less sustained attention, respectively.
Correlation coefficients were used to explore associations of the three attention constructs (RAC, IAC, SAE) with: 1) FYI risk outcomes; 2) SEQ sensory responsiveness outcomes; and 3) ECBQ temperament factors and subscales, for the Study 1 RiskCohort (N=95). Separate multiple linear regression models were applied for each outcome, with the three attention constructs (RAC, SAE, IAC) as predictors. Influence indicators and
scatterplots were evaluated to detect and remove outliers from each outcome. Analyses were run with and without outliers, and results were compared. For cases in which removal of outliers did not impact the statistical significance of results, the full model’s results are reported. For cases in which removal of outliers did impact the statistical significance of results, the model’s results with and without outliers are reported and discussed. All statistical analyses were conducted using SAS (SAS Institute, Inc., Cary, NC, USA). 2.2.2 Results
Correlations of FYI Risk Domains and Attention Constructs. Correlation coefficients were generated for the three new constructs in relation to each other and to the FYI risk domains (see Table 1.6). The pattern of results for this high-risk sample was similar to that of the Complete FYICohort (Stephens et al., in prep). Both features of social attention
attention are separate skills with the potential for unique predictive value. RAC, but not IAC, was also significantly positively associated with over-focused/sensory-focused attention (SAE), supporting the hypothesis that these two constructs are potentially associated with orienting network deficits (see Table 1.6 for all correlation coefficients).
The pattern of associations of RAC, IAC and SAE with the FYI risk domains were also explored. As expected, social attention coordination skills (RAC and IAC) were significantly, positively correlated with FYI social-communication risk scores. All three constructs were significantly positively correlated with FYI sensory-regulatory risk, total risk and risk percentile (see Table 1.6 for all correlation coefficients). SAE had the highest correlation with sensory-regulatory risk, as expected, and RAC had the highest correlations with total risk and risk percentile.
These patterns of association can inform hypotheses about the predictive value of the attention constructs for individual differences in social, sensory, and temperament outcomes. For example, given that RAC has the strongest association of the three constructs with FYI
total risk and risk percentile suggests that deficits in RAC at 12 months may be a strong predictor of elevated ASD symptoms such as social impairment and clinical sensory features. RAC and IAC, both with strong associations with social-communication risk, may be
uniquely predictive of social outcomes, whereas SAE, with the strongest associations with
sensory-regulatory risk, may be uniquely predictive of sensory and temperament outcomes.
Sensory Responsiveness Correlations and Regressions. Correlation coefficients were
delayed orienting to social and nonsocial sensory information (Baranek et al., 2006). SAE measures the degree to which children are attentionally engaged in, and perhaps overly focused on, sensory and nonsocial stimuli. Given that SAE was correlated with RAC, but not IAC, and with FYI sensory-regulatory risk, it was expected that SAE would be significantly, positively associated with all three sensory response patterns: hyporesponsiveness,
hyperresponsiveness, and sensory seeking.
All three attention constructs were positively, significantly correlated with
hyporesponsiveness. That is, higher (worse) scores on RAC, IAC and SAE at 12 months were associated with higher (worse) hyporesponsiveness between 13 and 16 months. As predicted, only SAE was significantly positively correlated with all three sensory response patterns. That is, higher SAE mean scores (i.e., more over-focused engagement with the sensory environment) at 12 months were associated with greater hyporesponsiveness,
hyperresponsiveness, and sensory seeking at 13-16 months (see Table 1.6 for correlation coefficients).
Together, the three attention constructs significantly predicted all three sensory response patterns, with the three predictors explaining more of the variance in
hyporesponsiveness (34.28%) and seeking (23.06%) scores, than hyperresponsiveness
One potential outlier was detected for hyporesponsiveness and three potential outliers were detected for hyperresponsiveness. Removal of the outliers did not change the statistical significance of the overall model or individual constructs’ contributions to the outcomes. For example, removing one outlier from hyporesponsiveness, the full model was still statistically significant, with slightly more variance accounted for (38.5% versus 34.28%), and all three predictors still had statistically significant regression coefficients. Therefore, results reported reflect all available data points included in the model. These few outliers do not impact the overall pattern of results for the majority of the sample.
Temperament Correlations and Regressions. Correlations among attention constructs (RAC, IAC, SAE) and the reactive (surgency/extraversion; negative affectivity) and
regulatory (effortful control) components of temperament were explored (see Table 1.6 for all correlation coefficients). Separate regression analyses were conducted for each outcome (see Table 1.7 for all regression coefficients).
Surgency/Extraversion. It was predicted that poorer social attention coordination skills at 12 months (i.e., high RAC and IAC) would be associated with lower
surgency/extraversion, a measure of children’s social engagement and activity levels. RAC demonstrated a low, but significant negative correlation with surgency/extraversion, partially supporting the hypothesis (see Table 1.6). The three constructs were not significant
predictors of surgency/extraversion, accounting for only 6.63% of the variance. However, RAC demonstrated a significant negative association with surgency/extraversion, such that an increase in RAC (i.e., less social orienting) was associated with a decrease in
association and resulted in the overall model becoming statistically significant and explaining 9.65% of the variance in surgency/extraversion.
Negative Affectivity. Given previously reviewed evidence that flexible attentional orienting and appropriately focused attention are associated with reduced negative
emotionality, it was hypothesized that less attentional orienting to social stimuli at 12 months (i.e., higher RAC) and more over-focused, sensory-focused attention (i.e., higher SAE) would be associated with higher negative affectivity (i.e., more sensory reactivity and
negative affect). This hypothesis was partially confirmed; SAE and negative affectivity were significantly, positively correlated (see Table 1.6).
Together, all three attention constructs significantly predicted negative affectivity,
accounting for 20.36% of the variance. SAE was the only significant, independent
contributor to differences in negative affectivity (see Table 1.7). Removal of one potential outlier did not alter these results.
Effortful Control. Given the assumption that the attention constructs tap underlying functions of the orienting and executive attention networks, and that effortful control
the constructs were associated with attention focusing; thus, this outcome was not included in the regression analyses.
In the regression analyses, the overall model was not significant for effortful control, but was significant for attention shifting (see Table 3.1). The three attention constructs, together, accounted for only 6.18% of the variance in effortful control scores. In contrast, the attention constructs accounted for 18.21% of the variance in attention shifting scores. RAC scores at 12 months significantly contributed to change in both effortful control and attention shifting scores at 13- to 16- months old. IAC and SAE did not significantly uniquely
contribute to these two outcomes, despite IAC being significantly, negatively correlated with
attention shifting (r=-0.247, p=0.016). Removal of outliers from effortful control and attention shifting did not alter these results.
2.2.3 Summary of Aim 2 Findings
In Aim 2, the associative and predictive value of the three attention constructs with well-validated parent-report measures of sensory and temperament features was explored in a high-risk sample of children. Patterns of associations of the attention constructs with the FYI risk domains were first assessed to determine potential hypotheses about the predictive value of each construct with the sensory and temperament outcomes. Both social attention
constructs (RAC and IAC) were associated with FYI social-communication risk, suggesting that RAC and IAC may predict differences in social outcomes. Surgency/extraversion, a measure of positive temperamental reactivity with social subscales, was the only available measure of social outcomes for this cohort. RAC and IAC were expected to be predictive of