Moving Towards a More Holistic Admissions Process Asta Feng
University of North Carolina—Chapel Hill Gillings School of Public Health
A paper submitted to the faculty of the University of North Carolina at Chapel Hill in partial fulfillment of the requirements for the degree of Master of Public Health in the Department of
Nutrition December 5, 2019
Approved by: _______________________ (Paper Advisor)
Introduction
Dietitians are uniquely positioned within the healthcare system to tackle many of the chronic diseases on the rise in the US. Obesity and diabetes continue to have high prevalence in US adults. 39.8% of US adults are considered obese, while 33.9% have prediabetes and 9.4% have been diagnosed with diabetes (Hales, Carroll, Fryar & Ogden, 2017). Obesity, diabetes, and their numerous complications can be prevented or managed with nutritional knowledge and guidance that a dietitian can provide.
However, the same chronic diseases disproportionately affect communities of color. More Hispanic and non-Hispanic black adults are obese, 47% and 46.8% respectively, when compared to both the national prevalence and the prevalence in non-Hispanic whites, 37.9% (Hales, Carroll, Fryar & Ogden, 2017). Likewise, diabetes is more common in communities of color. African-American adults are not only 1.8 times more likely than non-Hispanic white adults to be diagnosed with diabetes, but are also twice as likely to die from the disease (Office of Minority Health, 2016). Hispanic adults are also 1.7 times more likely than non-Hispanic whites to be diagnosed with diabetes and are 1.4 times more likely to die from the disease (Office of Minority Health, 2016).
Schmittdiel, Uratsu, Mangione, & Subramanian, 2010). In addition, minority providers “are significantly more likely than their white counterparts to serve in minority and medically underserved communities” (The Sullivan Commission, 2004). Increasing diversity in the healthcare workforce has the dual benefit of increasing access to care and bettering health outcomes to those who are most affected by chronic health conditions.
Like the rest of the healthcare workforce, dietetics is overwhelmingly white and does not reflect the rapidly changing American demographics. 73% of dietitians identify as White, while 4% identify as Asian, 3.4% identify as Hispanic, 2.4% identify as Black or African-American, 0.5% identify as American Indian or Alaskan Native, and 0.9% identify as Native Hawaiian or Pacific Islander (Commission on Dietetic Registration, 2019). The 2018 US Census estimates indicates that the American population is 60.4% White, 5.9% Asian, 18.3% Hispanic, 13.4% Black or African-American, 1.3% American Indian or Alaskan Native, and 0.2% Native Hawaiian or Pacific Island,. The biggest mismatch between the dietetic workforce and the general American population lies in the lack of Hispanic and Black or African-American
dietitians. This mismatch likely contributes to health disparities found in chronic conditions like obesity and diabetes.
One way of increasing the diversity among dietitians is to increase the diversity in
dietitian education programs. As the profession will require a master’s degree in 2024, this paper will look specifically at the impact of graduate admission practices on diversity across
The Difficulty with GRE Scores
Admissions for many master’s programs, including UNC Chapel Hill’s MPH-RD program, require students to take the Graduate Record Examination (GRE) General Test. The GRE is purported to “feature question types that closely reflect the kind of thinking” that is expected of students in graduate and professional schools and is meant to measure an applicant’s “verbal reasoning, quantitative reasoning, critical thinking, and analytical writing skills”
(Educational Testing Service, 2019). The test is meant to provide admissions committees with a standardized way to compare across a wide variety of students.
Despite the GRE’s attempt at making a test that seeks to measure thinking skills across disciplines, the test still tends to reflect the demographics of the test takers than their actual abilities, especially for the quantitative portion of the test. ETS data reveals that women score 80 points lower than men, and African American test takers score 200 points lower than white test takers (Miller and Stassun, 2014). Even though these two groups score lower on the GRE, there is no evidence to suggest that they perform poorer in graduate education settings.
The fact that the GRE correlates with demographics better than ability becomes
problematic when graduate admissions use GRE cut offs as a quick method to sort students. As a result, underrepresented and minority students will be more adversely affected. ETS, the test maker of the GRE, even directly cautions against this practice. They warn that “used alone, these measures can heighten the role that implicit bias plays in the review and selection processes and result in other unintended consequences that are potentially harmful to applicants and
In order to minimize the effect of the bias found in the GRE test, some institutions have moved towards a holistic review of applicants, where the GRE score becomes weighted much less. In the context of health professions education, shifting towards a holistic review of applicants can be conceptualized as shifting away “from determining how successful an applicant will be as a student to the contribution that the applicant can make to the profession” (Scott and Zerwic, 2015). Specifically within dietetics, it is important to select for individuals who are not only motivated to learn about nutrition, but are also self-aware, resilient, and empathetic in order to connect with and educate patients successfully. By moving towards a more holistic application process, graduate dietetic programs may also recruit more diverse students and are thus training professionals to provide care to the more diverse American population.
Case Studies
These case studies will demonstrate that relying less heavily on traditional markers of student ability (GPAs and GRE scores) will not lead to a decline in the quality of the admitted student. In fact, using a holistic review of applicants has led to an improvement in student outcomes and quality in graduate programs across multiple fields.
University of Texas MD Anderson Cancer Center UTHealth Graduate School of Biomedical Sciences (GSBS)
The study conducted by Wilson, Odems, Walters, DePass, and Bean (2019) focuses on how the UTHealth GSBS has been working to remove barriers for underrepresented minority students to start and complete their doctoral programs. Prior to 2013, GSBS applicants were screened first using their GPAs and GREs. Any applicant with a cumulative undergraduate and graduate GPA below 3.0 and a GRE score below the 50th percentile on either test were
automatically excluded from admission. Applicants who did not meet these quantitative
requirements did not even have their applications read unless directors of specific PhD programs asked for them. For the applicants who made it past this first hurdle, their applications were then evaluated by a committee looking for academic qualifications, research experience, sophisticated research and personal statements, and strong letters of recommendation. Applicants could also submit an optional statement of adversity that described hardships they overcame in order to achieve academic success. Each applicant was scored based on the strength of their application, and the scores determined admissions decisions.
In 2013, the GSBS shifted its application process away from using quantitative measures as gatekeepers for admissions. The new holistic application review process first stopped using rolling admissions. The new process still triaged applicants by GRE and GPA, but it ensured that all applications were read. Students who met the quantitative metrics were labeled Tier I and sent immediately for review by the primary admissions committee. Applicants who did not meet the GRE and GPA cut offs were reviewed by a second admissions committee. The second
admissions committee would then look at other parts of the application and could move applications from Tier II to Tier I. The tier status of all students were kept hidden from the primary admissions committee.
By reviewing all of the applications regardless of quantitative measures, the GSBS increased the number of underrepresented minority applicants that were reviewed and subsequently also offered more URM students admission into the program. As a result, the number of American Indian/Pacific Islander, disabled, and Hispanic male and female students increased, and the number of Black female students increased.
One concern of relying less on quantitative measures such as GRE and GPA to evaluate applicants is that the quality of the admitted applicant would decline. However, this did not occur for the GSBS. There was no significant difference when the GPAs of admitted students pre-intervention were compared with the GPAs of admitted students post-pre-intervention. Likewise, there was no significant difference between the GRE Quantitative scores of students pre- and post-intervention. However, the researchers found a significant difference between the GRE Verbal scores of students pre- and post-intervention. Hispanic female students and White male and female students actually had higher GRE Verbal scores after holistic review was
Thus, relying less on quantitative measures of applicants enabled the GSBS to increase the diversity of its student population without negatively impacting the quality of the students admitted.
Ponce Health Sciences University (Pacheco, Noel, Porter, & Appleyard, 2015)
Ponce Health Sciences University’s (PHSU) PhD applicants are overwhelmingly low-income, non-native English speaking Puerto Rico residents. As such, many of the applicants score below the 15th percentile on the GRE, making the test a poor marker for student potential in the program. To combat this, PHSU developed a composite score that incorporated other relevant markers of student competency in STEM research in addition to student GRE score and GPA. The composite score included factors such as prior research experience, course work in the medical sciences, presentations, and publications. Each of the components carries an equal amount of weight. The result of such a measure is it de-emphasizes the GPA and GRE scores of applicants and brings forth a fuller picture of student potential in STEM PhD programs. PHSU then analyzed the ability of the composite score to predict student retention beyond the 3rd year
However, researchers found that an applicant’s composite score was highly correlated when comparing those who withdrew from the program and those who stayed with their studies. Those with higher composite scores were more likely to stay than those with lower composite scores. The significance is retained when the GRE component of the composite score is removed, further indicating that student success can be predicted without the use of this standardized test score.
In addition to looking at student retention past the 3rd year, the researchers also analyzed how well the composite score predicted student completion of PhD programs. The findings are similar to those of student retention. The composite score showed a significant difference between those who withdrew and those who completed their PhDs, while the GRE failed to predict who would complete the program. In addition, the statistical significance is retained when the GRE component is removed from the composite score. Students with higher composite scores were also more likely to complete their PhD programs.
The researchers also looked further out at student outcomes after graduation. They analyzed the data to determine whether the composite score would be able to predict which students would earn fellowships after receiving their doctoral degrees. Once again, an applicant with a higher composite score was more likely to be accepted into a fellowship for further training. The GRE failed to reveal any statistical differences between these two groups. The composite score still retained its predictive ability after the GRE score component was removed.
Flagships State Universities with STEM PhDs (Petersen, Erenrich, Levine, Vigoreaux, & Gile, 2018)
The inability of the GRE to predict program completion illustrated by the Pone Health Sciences University study was replicated when data from four flagship state universities was analyzed in a broader STEM PhD setting. GRE scores from 1800 students enrolled in biological sciences, physical sciences, chemical sciences, computer and information sciences, engineering, geosciences, mathematical sciences, and other technology areas were obtained and analyzed to see if GRE scores could predict PhD completion. These 1800 students were enrolled in four flagship state universities in the United States: University of Massachusetts, Amherst; Rutgers, The State University of New Jersey; University of New Hampshire; and University of Vermont, Burlington.
Researchers found that there was no statistically significant difference in GRE Verbal or Quantitative scores when comparing students who left in their first year and students who stayed in the program. In addition, there was also no difference between GRE Verbal or Quantitative quartiles when analyzing time to PhD completion. The lack of a difference in GRE scores further bolsters the claim that the GRE is not a good predictor of student performance in graduate
education.
Surprisingly, the researchers found results that are contrary to common belief—men with GRE Quantitative scores in the lowest quartile had the highest rates of completing their doctoral programs. Men with GRE Verbal scores in the 3rd quartile also had the highest rates of
As shown by this study and the study conducted on students at the Ponce Health Sciences University, the GRE may not be the best predictor of student performance and retention in graduate programs. Other factors may be important in determining how well an applicant will perform once admitted.
UNC Biological and Biomedical Sciences Program (Hall, O’Connell, & Cook, 2017)
University of North Carolina Chapel Hill’s Biological and Biomedical Sciences Program (BBSP) is another PhD program that analyzed the how effective various factors considered for admission are for predicting student productivity. The factors researchers analyzed were GRE scores, GPA, months of previous research experience, recommendation letter ratings, and interview scores. Researchers defined student productivity as the number of first-author publications students produce during their doctoral studies. For analysis purposes, student outcomes were sorted into four groups: 0 first author publications, at least 1 middle author publication, 1-2 first author publications, and more than 3 first author publications.
In order to see if GRE or GPA affected graduate student productivity, researchers compared the mean GRE scores and mean GPAs across the 4 groups of student productivity outcomes. There was no statistically significant difference in mean GRE scores or mean GPAs, indicating that these two factors could not accurately predict which applicants would excel in their doctoral studies. This finding reinforces the findings found by researchers at Ponce Health Sciences University.
experience and higher interview scores did not translate into more first author publications published.
The one factor that did show promise in predicting graduate student productivity was the strength of letters of recommendations. These letters asked recommenders to not only speak about the strengths of the applicant but also rate them as “Exceptional,” “Outstanding,” “Very Good,” “Above Average,” or “Below Average.” These ratings were then translated into numeral scores (1=Exception, 5=Below Average) for the purposes of analysis. The mean ratings for each group of student productivity outcomes were then compared. Students who had the most number of first author publications also had the highest mean recommendation scores than those in any of the other groups.
The researchers also categorized students by recommender scores to see how these would affect the number of first author publications. Again, the researchers found that students who had higher recommendation scores also had more first author publications.
The researchers hypothesized that recommender score was able to predict student ability because it comes from experts in the scientific field who were able to evaluate a student’s traits over time. This relationship then allowed the recommender to provide a more qualitative assessment of student abilities that may not be evident from test scores and coursework assessments.
consider additional factors during the admissions process and to take a holistic approach when assessing applicants.
Dietetic Programs
There were only three papers that examined how well the GRE, along with other admissions factors, influence dietetic graduate student education outcomes in the form of first time pass rates on the Registered Dietitian Exam.
Tabata (2005) analyzed which factors could influence first time pass rates on the Registered Dietitian Exam. This study used past students from Lamar University and had a relatively small sample size of 22. Tabata found that the GRE Verbal score was weakly
correlated with first time passes on the credentialing exam and had a p-value of 0.07 in the chi-squared analysis. When creating a linear regression model, Tabata found that total GRE score was correlated with first time pass rates. When creating a multiple regression model, Tabata found that GRE Verbal scores, once again, were more strongly correlated with pass rates, with a p-value of 0.02 in this specific model.
However, the third study conducted by Clark, Cole, and Funderburk (2017) analyzed data from 72 students enrolled in the US Military-Baylor Graduate Program. Clark et. al failed to find a correlation between student success and GRE scores. They also failed to find a correlation between student success and GPAs.
While 2 of the 3 articles found that GRE scores were somewhat correlated with student success on the Registered Dietitian Exam, it should be noted that the sample size for the Lamar University study conducted by Tabata is the smallest number out of all the case studies
presented. That, coupled with only a weak correlation, indicates that the results from this study should not be taken as strong evidence that the GRE is a good predictor for student success.
In addition, according to the demographics reported by Tabata, 21 out of 22 total participants in that study identified as Caucasian. Even though this study did not analyze the effect of using GRE scores on the diversity of the graduate program, it can be hypothesized that requiring a GRE score may be one cause of the severe lack of diversity in that program.
All three studies used pass rates on the Registered Dietitian exam as evidence of student success. While the exam would indicate who would be able to become entry-level dietitians, cultural competency and cultural humility are not tested to any great extent. Thus, the success on the Registered Dietitian Exam may not be the best measure to see which newly minted dietitians are able to better serve populations of color who suffer disproportionately more from the burdens of chronic disease.
Methodology
applicant pool based on a GRE cut off. A GRE cut off is similarly enforced by the UNC Graduate School in the admission process. Applicant data from 2016-2018 were analyzed to determine the extent of the loss of the underrepresented minority student applicant pool as a result of the 50th percentile GRE cut off. Students who self-reported more than one race were
counted based on their non-white race. In addition, only complete applications with scores were considered for analysis. Data from students who voluntarily withdrew, had an administrative withdrawal, did not report GRE scores, or otherwise were not required to submit a GRE score were not included in the analysis.
For the purposes of this paper, student diversity will be considered based on race and age. While it would be beneficial to understand other aspects of diversity, such as sexual orientation and socioeconomic status, other data are not currently being collected during the application process.
applicants, the overarching university bureaucracy and mechanisms have made this change towards holistic review very slow.
Results
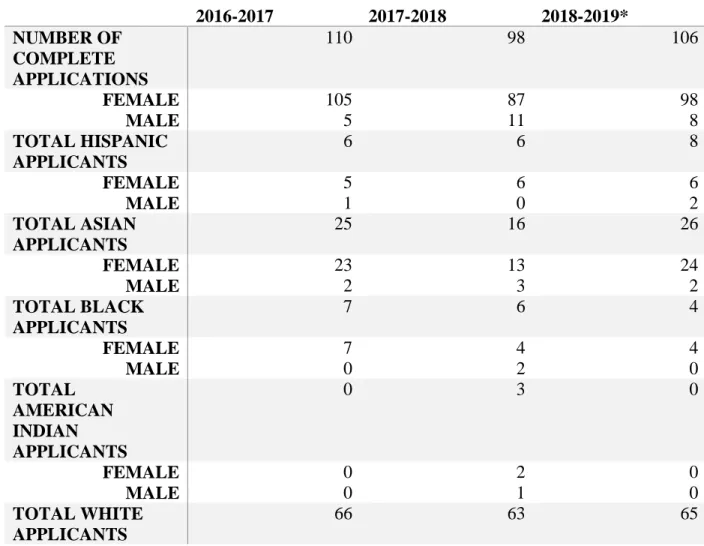
A total of 314 student application data was analyzed. In general, applicants to UNC’s program were white and female. As shown in Table 1a, women accounted for 92.4% of all applicants, and 61.5% of applicants self-identified as white. The number of applicants across all racial groups stayed relatively constant in all three years. The average age of applicants also stayed relatively constant across all three years.
Table 1a. Descriptive Statistics of Applicants
2016-2017 2017-2018 2018-2019* NUMBER OF
COMPLETE APPLICATIONS
110 98 106
FEMALE MALE 105 5 87 11 98 8 TOTAL HISPANIC APPLICANTS
6 6 8
FEMALE MALE 5 1 6 0 6 2 TOTAL ASIAN APPLICANTS
25 16 26
FEMALE MALE 23 2 13 3 24 2 TOTAL BLACK APPLICANTS
7 6 4
FEMALE MALE 7 0 4 2 4 0 TOTAL AMERICAN INDIAN APPLICANTS
0 3 0
FEMALE MALE 0 0 2 1 0 0 TOTAL WHITE APPLICANTS
FEMALE MALE 64 2 58 5 61 4 DECLINE TO ANSWER
6 4 3
FIRST
GENERATION COLLEGE GRADUATES
16 13 12
FIRST
GENERATION GRADUATE SCHOOL APPLICANTS
49 42 45
INTERNATIONAL APPLICANTS
18 8 18
AVERAGE AGE OF APPLICANTS (YEARS)
24.1 24.0 23.9
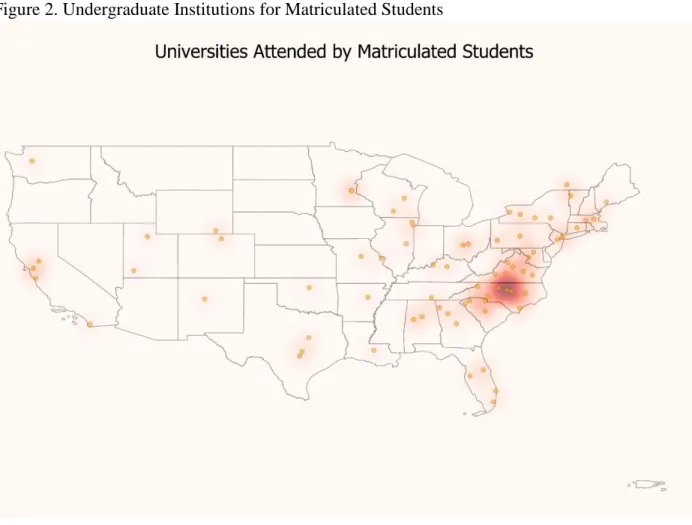
MOST COMMON UNDERGRADUATE INSTITUTIONS
University of North Carolina—Chapel Hill (8) Cornell University (3) University of Wisconsin— Madison (3)
UNC Chapel Hill (8) East Carolina University (4) UNC Greensboro (4) North Carolina State University (3) University of Michigan—Ann Arbor (3) UNC Wilmington (3)
Appalachian State University (4) UC Davis (4) Cornell University (3) Furman University (3) Pennsylvania State University (3) University of Illinois—Urbana Champaign (3) MOST COMMON UNDERGRADUATE MAJORS Nutrition/Dietetics (45) Biology (11) Psychology (8) Nutrition/Dietetics (24) Biology (17) Exercise Science (11) Nutrition/Dietetics (40) Biology (12) Exercise Science (12) Public Health (10)
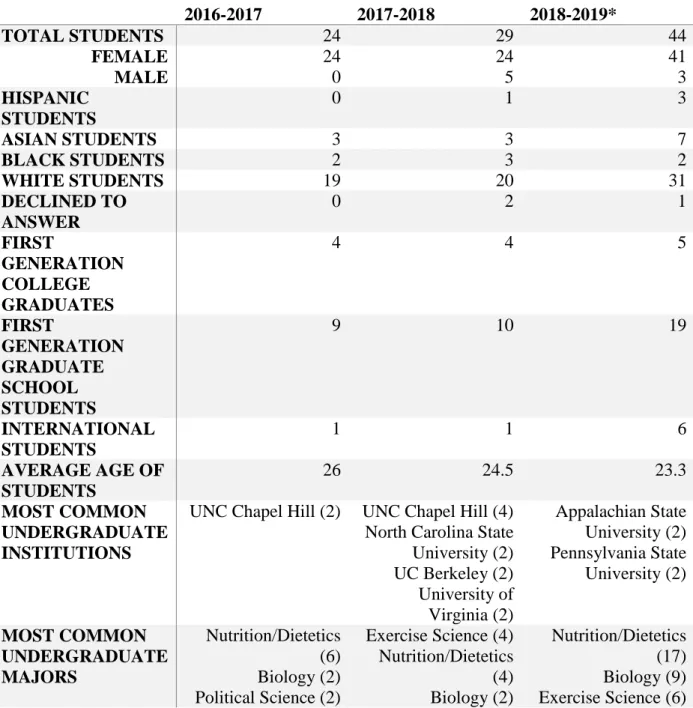
Overall, matriculating classes are less racially diverse than the initial applicant pool. Each matriculating class had a greater proportion of students who identified with white when
60% of the 2016-2017 application pool identifying as white. The class from the 2017-2018 application cycle was 69.0% white, as compared to 64.3% of the corresponding application pool identifying as white. The class from the 2018-2019 application cycle was 75.6% White, as compared to 61.3% of the application pool identifying as white. The average age also decreased for each subsequent class, decreasing from 26 to 23.3.
Table 1b. Descriptive Statistics of Matriculated Students
2016-2017 2017-2018 2018-2019*
TOTAL STUDENTS 24 29 44
FEMALE MALE 24 0 24 5 41 3 HISPANIC STUDENTS
0 1 3
ASIAN STUDENTS 3 3 7
BLACK STUDENTS 2 3 2
WHITE STUDENTS 19 20 31
DECLINED TO ANSWER
0 2 1
FIRST
GENERATION COLLEGE GRADUATES
4 4 5
FIRST
GENERATION GRADUATE SCHOOL STUDENTS
9 10 19
INTERNATIONAL STUDENTS
1 1 6
AVERAGE AGE OF STUDENTS
26 24.5 23.3
MOST COMMON UNDERGRADUATE INSTITUTIONS
UNC Chapel Hill (2) UNC Chapel Hill (4) North Carolina State University (2) UC Berkeley (2) University of Virginia (2) Appalachian State University (2) Pennsylvania State University (2) MOST COMMON UNDERGRADUATE MAJORS Nutrition/Dietetics (6) Biology (2) Political Science (2)
Psychology (2) International Studies (2)
*MPH-RD applicants only. The data for the other 2 years do not separate out MPH only applicants from MPH-RD.
The proportion of students lost in each racial group due to the GRE cut off was then analyzed. White and Asian applicant pools were the least affected, with 37.9% and 35.6% lost respectively. Half of the Hispanic applicant pool was lost to the GRE cut off, while 70.6% of the Black applicant pool was lost.
Table 2. Number and Percentage of Students Lost Due to 50th Percentile GRE Cut Off by Race
16-17 17-18 18-19 Total % Lost
Hispanic
Total 6 6 8 20
GRE <50 2 4 4 10 50
Asian
Total 25 14 24 63
GRE<50 9 3 11 23 35.6
Black
Total 6 6 5 17
GRE<50 5 4 3 12 70.6
White
Total 65 61 64 190
GRE<50 23 22 27 72 37.9
Black students were excluded after applying the cut off as compared to 37.9% of White students, with a p-value of 0.01. No other statistically significant results were found when comparing Hispanic and Asian students with White students.
Table 3. Fisher’s Exact Test Results of When Comparing Percentage Below GRE Cut Offs: Non-White Students to Non-White Students
Race p-value
Black 0.0105**
Hispanic 0.3384
Asian 0.8816
**denotes statistical significance with a p-value <0.05
In addition to analyzing the effect of race on the proportion of students lost to the GRE cut off, the effects of age were also analyzed. Applicants were grouped into <26 years of age and ≥26 years of age. As shown in Table 3, there was no significant difference found between these two groups.
Table 4. Number and Percentage of Students Lost to GRE Cut Off by Age
16-17 17-18 18-19 Total % Lost
Age <26
Total 86 75 79 240
GRE <50 36 28 37 101 42.1
Age≥26
Total 22 21 25 78
GRE<50 5 9 10 24 35.3
Discussion
The purpose of this paper was to analyze how the GRE score cut off would affect
underrepresented minority pools. The results of this analysis mirrors similar findings at different institutions and by the Educational Testing Service. For UNC’s MPH-RD program, the GRE cut off adversely affected Black and Hispanic applicants the most. Black applicants were
Graduate School adversely impacts the diversity of the matriculating classes and adversely impacts the future demographics of the dietetics profession.
Both the literature and data presented in this paper suggest that removing the GRE cut off for admission requirement may improve the overall diversity of matriculating classes without sacrificing quality of entering students. While some of the students of color who were adversely impacted by the GRE cut off did matriculate into the program, this required extra effort on the part of faculty and staff in the department to lobby for these students. Since GRE scores do not necessarily correlate to better students and better practitioners, this extra step may not be needed and removing it can save faculty and staff valuable time.
In addition, removing the GRE cut off may also encourage more students of color and students of lower socioeconomic status to apply, as there would be one component of an application to pay for (Moneta-Kohler, Brown, Petrie, Evans, & Chalkley, 2017).
Removing the GRE cut off is just one way to improve the diversity of the program and ought to be done in conjunction with other recruiting activities to achieve the most effect. In addition to removing the GRE requirement, the department could also expand its recruitment efforts to target institutions with a greater percentage of minority students. This
cross-institutional approach has been successfully implemented by Brown University and the
from Brown and UT-GSBS have partnered with faculty at these target institutions to help improve curricula to increase graduate school application success.
While increasing the diversity of incoming classes is important, it is equally important to ensure that these students feel supported, socially and academically after they have enrolled in the program. Strategies to increase student support can include building a community, providing mentoring opportunities, reaching across cohorts with alumni involvement, and educating faculty and staff on inclusiveness and implicit bias (Thompson and Campbell, 2013; Wilson, DePass, & Bean, 2018; Healey, 2013; Enard et. al, 2017; Kreuter et. al, 2011).
Limitations
The main limitation for this analysis is the small sample sizes for minority applications. Many of these were well under 10 students, which would affect the statistical significance for results. In addition, this analysis only included race and age in its definition of diversity due to the available data. A more robust definition of diversity may yield other insights.
Conclusions
Removing the GRE requirement may be advantageous for increasing the diversity of the student body in UNC’s MPH-RD program and is one small step that can be taken to help
diversify not only the student body but also the profession of dietetics in general. By taking steps to increase student diversity, UNC can help to make strides in ensuring that the demographics of healthcare practitioners can start to mirror that of the overall United States population. In
Appendix
References
Office of Minority Health. (2016a). Diabetes and African-Americans. Retrieved October 14, 2019, from https://minorityhealth.hhs.gov/omh/browse.aspx?lvl=4&lvlid=18
Office of Minority Health. (2016b). Diabetes and Hispanic Americans. Retrieved October 14, 2019, from https://minorityhealth.hhs.gov/omh/browse.aspx?lvl=4&lvlid=63
Clark, H. L., Cole, R. E., & Funderburk, L. K. (2018). US Military Dietetic Internship and Graduate Program: Retrospective Analysis of Selection Criteria and Student Success. Journal of the Academy of Nutrition and Dietetics, 118(6), 1057–1064.
https://doi.org/10.1016/j.jand.2017.12.002
Enard, K. R., Dotson, E., Broom, K., Dean, C., Wiltshire, J., & Elder, K. (2017). Diversity and
Inclusion in Graduate Healthcare Management Education: Perspectives from program directors
and students. 23.
ETS. (2019). GRE: Guide to the Usage of Scores 2019-2020. Educational Testing Services. ETS. (n.d.). About the GRE General Test (For Test Takers). Retrieved November 12, 2019, from
https://www.ets.org/gre/revised_general/about
Farkas, E. (2010). Predictors of Success in a Combined Dietetic Internship/Master’s of Science Degree Program.
Hales CM, Carroll MD, Fryar CD, Ogden CL. Prevalence of obesity among adults and youth: United States, 2015–2016. NCHS data brief, no 288. Hyattsville, MD: National Center for Health Statistics. 2017.
Hall, J. D., O’Connell, A. B., & Cook, J. G. (2017). Predictors of Student Productivity in Biomedical Graduate School Applications. PLOS ONE, 12(1), e0169121.
Healey, C. (2013). Development of a plan for improved recruitment and retention of Hispanic practical nursing students. Nurse Education Today, 33(1), 10–12.
https://doi.org/10.1016/j.nedt.2012.05.015
Kreuter, M. W., Griffith, D. J., Thompson, V., Brownson, R. C., McClure, S., Scharff, D. P., … Haire-Joshu, D. (2011). Lessons Learned From a Decade of Focused Recruitment and Training to Develop Minority Public Health Professionals. American Journal of Public Health, 101(S1), S188–S195. https://doi.org/10.2105/AJPH.2011.300122
Miller, C., Stassun, K. A test that fails. Nature 510, 303–304 (2014) doi:10.1038/nj7504-303a
Moneta-Koehler, L., Brown, A. M., Petrie, K. A., Evans, B. J., & Chalkley, R. (2017). The Limitations of the GRE in Predicting Success in Biomedical Graduate School. PLOS ONE, 12(1), e0166742. https://doi.org/10.1371/journal.pone.0166742
Pacheco, W. I., Noel, R. J., Porter, J. T., & Appleyard, C. B. (2015). Beyond the GRE: Using a Composite Score to Predict the Success of Puerto Rican Students in a Biomedical PhD Program. CBE—Life Sciences Education, 14(2), ar13. https://doi.org/10.1187/cbe.14-11-0216
Petersen, S. L., Erenrich, E. S., Levine, D. L., Vigoreaux, J., & Gile, K. (2018). Multi-institutional study of GRE scores as predictors of STEM PhD degree completion: GRE gets a low mark. PLoS ONE, 13(10). https://doi.org/10.1371/journal.pone.0206570
Registry Statistics—Commission on Dietetic Registration. (2019). Retrieved October 14, 2019, from Registry Statistics website: https://www.cdrnet.org/registry-statistics
Scott, L. D., & Zerwic, J. (2015). Holistic review in admissions: A strategy to diversify the nursing workforce. Nursing Outlook, 63(4), 488–495. https://doi.org/10.1016/j.outlook.2015.01.001 Tabata, B. (2005). Indicators of Success on the Registration Examination for Dietitians of Dietetic
The Sullivan Commission. (2004). Missing Persons: Minorities in the Health Professions.
Thompson, N. L., & Campbell, A. G. (2013). Addressing the Challenge of Diversity in the Graduate Ranks: Good Practices Yield Good Outcomes. CBE—Life Sciences Education, 12(1), 19–29. https://doi.org/10.1187/cbe.12-04-0054
Traylor, A. H., Schmittdiel, J. A., Uratsu, C. S., Mangione, C. M., & Subramanian, U. (2010). Adherence to Cardiovascular Disease Medications: Does Patient-Provider Race/Ethnicity and Language Concordance Matter? Journal of General Internal Medicine, 25(11), 1172–1177. https://doi.org/10.1007/s11606-010-1424-8
Wilson, M. A., DePass, A. L., & Bean, A. J. (2018). Institutional Interventions That Remove Barriers to Recruit and Retain Diverse Biomedical PhD Students. CBE—Life Sciences Education, 17(2), ar27. https://doi.org/10.1187/cbe.17-09-0210