i
EPIGENETIC REGULATION OF MURINE STAB2 EXPRESSION IN
DETERMINING ATHEROSCLEROTIC SUSCEPTIBILITY
Sharlene Dong
A thesis submitted to the faculty of the University of North Carolina at Chapel Hill in partial fulfillment of the requirements for the degree of Master of Science in the Department of
Nutrition (Nutritional Biochemistry) in the Gillings School of Global Public Health
Chapel Hill 2017
Approved by:
Nobuyo Maeda
Rosalind Coleman
iii
ABSTRACT
Sharlene Dong: Epigenetic regulation of murine Stab2expression in determining atherosclerotic susceptibility
(Under the direction of Nobuyo Maeda)
Atherosclerosis is a progressive disease characterized by the accumulation of lipids and
fibrous elements in the arteries. In mice, the aortic arch and root show distinct patterns of lesion
development. A quantitative trait locus (QTL) analysis of an intercross between apoE-null mice
on 129S6 and DBA/2J backgrounds has revealed a significant locus on chromosome 10, Aath5,
that affects plaque size in the arch. One candidate gene in the Aath5 locus is the Stab2 gene,
which encodes a receptor for hyaluronan. The DBA allele of the Stab2 gene includes a unique
intracisternal A-particle (IAP) retrotransposon inserted in reverse in the promoter region, which
drives Stab2 expression. Methylation status of this region was analyzed through allele-specific
bisulfite sequencing and correlated with ectopic Stab2 expression in the heart and kidneys. Thus,
epigenetic regulation of this IAP element may play a role in regulating Stab2 expression and
iv
To my mom and dad and all my friends
v
ACKNOWLEDGEMENTS
My first and foremost acknowledgements goes to Dr. Nobuyo Maeda, my supervisor and
research mentor, for her constant support and guidance throughout my two years working in the
Smithies-Maeda Lab. Her never-ending curiosity and relentless dedication to benchwork are
truly trademarks of an incredible scientist. I would also like to thank my lab members: Dr.
Yukako Kayashima for helping to teach me the essential lab techniques when I first began
working in the lab, Sylvia Hiller for her kindness, companionship and endless patience with
helping me to troubleshoot my experiments, Dr. Marlon Lawrence for being a fantastic mentor,
both inside and outside of the lab, and Dr. Feng Li for her incredible positive spirit and joy for
science. I am irrevocably indebted to Dr. Oliver Smithies, whom I was blessed to have worked
with and whose memory I will carry with me for many years to come. I am also grateful for my
committee members, Dr. Rosalind Coleman and Dr. Eric Klett. Dr. Coleman was instrumental in
my decision to pursue my Master’s degree at UNC-Chapel Hill and she has proved to be a truly
wonderful advisor and mentor in the past two years. Finally, I would like to thank the Nutrition
department for the invaluable experiences and lessons learned throughout my time here that I
vi
TABLE OF CONTENTS
LIST OF TABLES……….……….….viii
LIST OF FIGURES………...………...ix
LIST OF ABBREVIATIONS………...………...x
CHAPTER I: INTRODUCTION………...1
1.1 Overview………..………….…1
1.2 Molecular Pathogenesis of Atherosclerosis……….…...1
1.3 Genetic Basis of Atherosclerosis………...3
1.4 Quantitative Trait Locus (QTL) Analysis………..…………5
1.5 Identifying Aortic-Arch Specific QTL for Atherosclerosis………...7
1.6 Significance of Stab2………...…...8
1.7 Retrotransposon Activity and Impact………..10
CHAPTER II: EPIGENETIC REGULATION OF STAB2D GENE..………12
2.1 Insertion of Intracisternal A-Particle (IAP) Within Promoter Region of Stab2D………12
2.2 CpG Methylation in 5’ LTR of Stab2D………13
CHAPTER III: TRANSIENT CHANGES IN GENE EXPRESSION INDUCED BY BACTERIAL ARTIFICIAL CHROMOSOME (BAC).…….………...……15
3.1 Determining Gene Expression Driven by IAP Insert..………...15
vii
3.3 Characterization of BAC………18
3.4 Assessing Changes in Expression Patterns with Transfection of BAC………..……..18
CHAPTER IV: TRANSIENT CHANGES IN GENE EXPRESSION INDUCED BY GENES RSL1 AND RSL2……….………..……….21
4.1 Selection of Rsl1 and Rsl2 Genes………...21
4.2 Assessing Changes in Expression with Transfection of Rsl1 and Rsl2………23
CHAPTER V: MATERIALS AND METHODS……..………26
5.1 Identifying IAP Insert Upstream of Stab2D………26
5.2 Assessing methylation profile in 5’ LTR of Stab2D………...26
5.3 Characterizing Bacterial Artificial Chromosome (BAC)………...28
5.4 Transfecting HEK293 Cells with BAC………..30
5.5 Selecting Rsl1 and Rsl2 Genes………...31
5.6 Transfecting HEK293 with Rsl1 and Rsl2……….31
CHAPTER VI: CONCLUSION...……….33
REFERENCES…….………...58
viii
LIST OF TABLES
Table 1: Atherosclerosis Loci Identified From QTL Studies in Mice*……….37
Table 2: Mice Strains and Tissues Used for Methylation Analysis………...38
Table 3: Selection of Appropriate HEK293 Cell Lines for Transfection Experiments………….39
Table 4: BAC Clone Characterization………...40
ix
LIST OF FIGURES
Figure 1: LOD Curves for Atherosclerotic Plaque Size at the Arch*………42
Figure 2: DBA-Allele Dependent Upregulation of Stab2*………43
Figure 3: Stab2D and Upstream Promoter Region………...44
Figure 4: Methylation Status of 5’ LTR Region of IAP Insert………...………...45
Figure 5: 5’ LTR Sequence in Reverse Orientation Drives Stab2 Expression in HEK293 Cells……….46
Figure 6: Transcription of Stab2D is Subject to Epigenetic Repression……….…...47
Figure 7: BAC Clone Gel Visualization and Characterization………...………...48
Figure 8: HEK293 6-6 Cell Lines Produces Highest Luciferase Expression………49
Figure 9: Increasing Dosages of Transfected BAC Show Trends in Luminescence…...50
Figure 10: Transfection with BAC Clone 349F18 Suggest Repressive Effects………51
Figure 11: Initial Experimental Workflow for Transfection with Rsl1 and Rsl2………..53
Figure 12: Transfection of HEK293 Cells with Rsl1 and Rsl2 May Alter Gene Expression………...54
Figure 13: Modified Experimental Workflow for Transfection with Rsl1 and Rsl2……….55
x
LIST OF ABBREVIATIONS
129 129S6 mouse
ApoE Apolipoprotein E
ApoE-/- Apolipoprotein E knockout
BP Base pair
B6 C57BL/6J mouse
CM Centimorgan
DBA DBA/2J mouse
FH Familial hypercholesterolemia
F1 Filial 1 (generation)
HA Hyaluronic acid
HEK293 Human embryonic kidney 293 (cell line)
HHMR Hyaluronan mediated motility receptor
IAP Intracisternal A-particle
KB Kilobases
LDL Low density lipoprotein
LDLR Low density lipoprotein receptor
LOD Logarithm of odds
QPCR Quantitative polymerase chain reaction
QTL Quantitative trait locus
RFLP Restriction fragment length polymorphisms
RT-PCR Reverse transcription polymerase chain reaction
SMC Smooth muscle cell
SNP Single nucleotide polymorphisms
SSR Simple sequence repeats
TCFA Thin-cap fibroatheroma
xi
TK Thymidine kinase
1
CHAPTER I: INTRODUCTION
1.1 Overview
Atherosclerosis is a systemic disease in which plaques, consisting of fat, cholesterol,
calcium and other blood-soluble factors, build up inside the arteries, hardening and narrowing
the vessels to reduce blood flow. Limiting the flow of oxygen-rich blood to vital organs can
often cause heart attacks or strokes and lead to comorbidities such as coronary heart disease,
peripheral artery disease and chronic kidney disease. Atherosclerosis is a major problem on both
the national and global scale. In the United States, heart disease and stroke are the first and
second causes of death respectively [1]. Globally, heart disease, stroke and other cardiovascular
diseases cause one out of every three deaths [1]. There are many genetic predispositions to
atherosclerosis as well as many lifestyle risk factors such as hypertension, tobacco smoking,
diabetes and obesity. However, fully understanding the linkage between atherosclerosis and its
underlying risk factors requires a clearer view of how atherosclerosis develops in humans.
Consequently, understanding the molecular and genetic pathogenesis of atherosclerosis is key to
developing a deeper understanding of the disease.
1.2 Molecular Pathogenesis of Atherosclerosis
The development of atherosclerosis is a complex process that takes place throughout a
person’s lifetime, typically from childhood onwards. Atherogenesis encompasses a continuum of
2
the accompanying inflammatory responses. Chronic inflammation at weakened or susceptible
sites may cause fatty streaks to change into fibrous plaques, which could rupture and cause
thrombosis or stenosis. This process of atherogenesis can typically be categorized into several
stages defined by their underlying biological mechanisms [2].
During early fatty streak development, low density lipoprotein (LDL) levels increase in
the bloodstream and accumulate in the arterial intima, which is the innermost layer of an artery
or vein. LDL typically carries phospholipids, cholesterol, and triglycerides and distributes these
lipids throughout the bloodstream to be taken up by the peripheral tissues and organs. LDL levels
have been found to correlate positively with progression of atherosclerosis [3]. As LDL
accumulates in the arterial wall, it can become oxidized into proinflammatory particles such as
oxidized LDL. Oxidized LDL can react with tissue surroundings and lead to tissue damage.
Overall, these changes stimulate inflammation pathways within the arterial tissue. Endothelial
and smooth muscle cells (SMCs) begin to secrete adhesion molecules and chemokines, which
then attract monocytes, lymphocytes, mast cells and neutrophils into the arterial wall. Monocytes
can differentiate into macrophages which take up lipids and become foam cells. Some
pathological standards define the start of atherosclerosis as when “lipid accumulation appears as
confluent extracellular lipid pools and extracellular lipid cores with decreased cellularity” [2].
Following the development of a fatty streak, a fibroatheroma typically develops, which is
an atheroma with a fibrous cap. The atheroma is caused by the accumulation of fatty deposits
and scar tissue in the inner layer of the artery wall. Naturally, between the time when the first
fatty streak develops and the time when the fibroatheroma develops, there is considerable cell
necrosis caused by excessive lipid accumulation and the prolific death of macrophages and
3
extracellular lipid continues to accumulate to form a lipid-rich core. When fibrous tissue forms to
cover up this core, this complex will form the fibrous plaque lesion that will become the
dominant lesion. As a person ages, this early stage fibroatheroma becomes a thin-cap
fibroatheroma (TCFA). However, this fibrous cap is subject to many proteolytic enzymes and
continuous degradation may cause it to rupture, leading to thrombus. As the plaque grows, the
local arterial wall continuously undergoes remodeling to attempt to enlarge the arterial diameter
to compensate for the compromised blood flow. However, this remodeling will typically stop
when the plaque has grown to occupy approximately 40% of the area of the artery [4].
Throughout the entire process of atherogenesis, calcium deposits also form on the vessel walls,
further hardening arteries. In complex lesions, the cycle of rupture, thrombosis and healing can
occur multiple times, leading to many layers of tissue that obstruct blood flow
1.3 Genetic Basis of Atherosclerosis
In the past few decades, much research has been directed towards studying the genetic
basis of atherosclerosis. Atherosclerosis is common disease, meaning that the incidence and
prevalence is very high in the general population and it is responsible for a significant portion of
the morbidity, mortality and health care costs of the developing world. By understanding the
genetic basis of such common disorders, the hope is that research will lead to better therapies and
more accurate identification of at-risk populations [5].
Atherosclerosis is a heterogenous disease with many potential underlying causes. In some
cases, single gene or Mendelian disorders can lead to many genetic contributions to the disease.
Understanding these rare Mendelian disorders can give insight into mechanisms and pathways of
4
chromosomal disorders, such as abnormalities in chromosome number or structure, Mendelian
disorders due to abnormalities in a single gene, or non-Mendelian disorders caused by other
factors such as mitochondrial mutations [5]. Take for example, familial hypercholesterolemia
(FH) and familial defective apolipoprotein B, which was later found to be due to mutations in the
LDL receptor and apoB respectively [6-8].
Although there has been significant success in understanding the genetic basis of rare,
single gene disorders for atherosclerosis, little is known about the common, complex forms. In
complex diseases, there may be a single gene involved, more than one major gene or a group of
major genes and polygenes [5]. Polygenes are genes that have small effects on development of
disease and are usually additive. In addition, complex diseases often also implicate gene-gene
interactions and gene-environment interactions. Most all cases of atherosclerosis are due to
“many genes with small effects that are modified by the environment and the effects of other
genes, rather than of the single, highly penetrant gene” [9]. In other words, complex forms of
atherosclerosis are due to “many little things” [10]. Studying the genetic etiology of complex
diseases are difficult but can be aided by techniques such as candidate gene studies, linkage
analysis, association studies and other methodologies using both forward and reverse genetics.
Overall, the goal remains to identify the specific gene or genes involved in a disease and to
identify the different variants of these genes that lead to the predisposition [5]. In this project, our
5
1.4 Quantitative Trait Locus (QTL) Analysis
Quantitative Trait Locus (QTL) Analysis is a statistical method used to explain the
genetic basis of variation in complex traits by linking phenotypic data, such as trait
measurements, to genotypic data, such as molecular markers [11-13]. To do a QTL analysis,
researchers first begin with two strains of organisms, such as mice, that differ genetically in the
desired trait or at least contain two different alleles. For example, researchers could begin with
two strains of mice with differing susceptibility to atherosclerosis. The trait of interest should be
able to be characterized and measured, thus generating the phenotypic data to be linked.
Genotypic data can be generated by molecular markers such as single nucleotide polymorphisms
(SNPs), simple sequence repeats (SSRs), restriction fragment length polymorphisms (RFLPs)
and transposable element positions [14-17]. The two different parental strains are crossed to
generate a heterozygous F1 generation. The F1 generation can then be either crossed back to one
of the parental strain (backcross) or crossed with each other (intercross). This unique mating
scheme will generate genetically unique F2 animals due to the independent segregation of
chromosomes and crossovers [18]. Finally, the phenotypes and genotypes of the F2 animals will
be evaluated and scored. The molecular markers that are genetically linked to a locus that
influences the trait of interest will segregate more frequently with the phenotypic trait while
unlinked markers will not show any association [19]. A specific metric called the logarithm of
odds (LOD) score is used to evaluate genetic linkage. Typically, a peak LOD score greater than
2.8 is deemed to be suggestive evidence for linkage while a score greater than 4.3 is deemed to
be significant evidence [20].
There are many advantages and limitations of using QTL analysis to discover genetic
6
multigenic and complex traits and can be done by at least an order of magnitude greater than in
human studies. QTL analysis is one of the most powerful methods to use in a mouse model [21].
Another advantage is that QTL mapping can provide a new way to identify novel genes that
otherwise would not have been considered [21]. Thus, QTL mapping can also be used for
hypothesis generation. This method has proven to be very useful for discovering genes possibly
involved in atherosclerosis susceptibility. Many QTL studies have been conducted on many
inbred strains of mice that have maintained on an atherogenic diet or bred onto a sensitized
genetic background such as apoE-null or LDLR-null. The results, which are adapted from a 2003
publication from Allayee et al, are shown in Table 1. Nevertheless, the QTL method is not
without caveats. One limitation of QTL analyses is that they require extremely large sample
sizes. For mice, this requires significant time and resources to uphold the mouse population. This
method can only map differences captured between the initial parental strains and the overall
goal is to identify loci rather than alleles. Because the loci captured by QTL often encompass
several genes, it can be difficult to determine which genes are truly responsible for causing a
certain phenotype. Others have criticized that the loci for atherosclerosis identified in mice do
not alter clinical endpoints such as plasma lipid levels and blood pressure but instead only act at
the cellular level [21]. To definitively prove causality, researchers must resort to methods such as
positional cloning [22], targeted gene replacement [23], functional complementation [24] or
deletion mapping [25]. Despite the limitations, QTL mapping has proved to be a useful and
7
1.5 Identifying Aortic-Arch Specific QTL for Atherosclerosis
Previous work in the Maeda lab group has focused on the differences in genetic
susceptibility for atherosclerosis at the aortic arch and at the aortic root. Location of lesion
development is relevant because different risk profiles can correlate to specific patterns of
atherogenesis which later impacts cardiovascular health. For example, smoking increases the risk
of plaques only in the abdominal aorta without influencing right coronary artery lesions in people
ages 25-34 [26]. Similarly, diabetes disproportionately increases risk of plaques in the lower
limbs and hypertension impacts risk in the carotid artery [27]. Such distinct patterns suggest that
the pathology of atherosclerosis can occur as distinct processes depending on the region.
Experiments have shown that patterns of lesion development differ between
apolipoprotein E-knockout (Apoe-/-) on a C57BL6/J genetic background or a 129S6 background
[28]. At the aortic root, plaque development is slower in the 129-apoE mice than in the B6-apoE
mice. However, the opposite is true in the arch, where plaque development is much faster in the
129-apoE mice compared to the B6-apoE mice. QTL mapping was used to determine the genetic
loci that may be responsible for these variations. Using a cross between these 129-apoE and
B6-apoE mice, Kayashima et al revealed three loci (Aath1 and Aath2 on Chromosome 1 and Aath3
on Chromosome 15) that may be responsible for determining susceptibility of the aortic arch to
developing lesions [29]. Afterwards, a different cross, this time between DBA-apoE and
129-apoE mice, was used and the genome wide scan showed two more significant loci that may
affect plaque size in the arch (Aath4 on Chromosome 2 and Aath5 on Chromosome 10) [30]. The
respective LOD score for the two loci are LOD = 7.0 and LOD = 5.1, which are shown in Figure
1. Both scores were deemed to be above the threshold for significance. The DBA allele of Aath4
8
129 allele of Aath5 is associated with increased plaque size in the arch compared to the DBA
allele [30]. In other words, the DBA allele of Aath5 is considered protective. In humans, the
chromosomal regions that correlate to Aath4 and Aath5 include regions containing SNPS
associated with stroke, plasma VLDL concentrations, heart rate, platelet count, blood pressure
and stroke. To further investigate these loci, functional SNPs were analyzed using SHIFT [31]
and Polyphen-2 [32] prediction programs. The major candidate gene for Aath5 was determined
to be the Stab2 gene, which is the subject of extensive further investigation. Overall, better
understanding of these loci in the mouse model could lead to improved therapies and diagnostics
for humans.
1.6 Significance of Stab2
The Stabilin-2 (Stab2) gene is a 166,827 bp protein coding gene found on Chromosome 10
at position 43.14 cM [33]. The gene is sometimes also called FEEL-2 (Fasciclin, EGF-like,
laminin-type, EGF-like and link domain-containing scavenger receptor 2) or HARE (Hyaluronic
acid receptor for endocytosis). The Stab2 gene codes for the STAB2 protein, which is a
transmembrane receptor protein that is expressed by sinusoidal endothelial cells in the human
liver, spleen, lymph nodes and resident tissue macrophages. It acts as a receptor for
clathrin-mediated endocytosis for ligands such as hyaluronic acid (HA), acetylated LDL, apoptotic cells,
heparin, bacteria and advanced glycation end products [34-37].
Hyaluronan has been implicated in atherogenesis but its definitive function has still not
been clearly defined. Interestingly, research findings have supported both pro and
anti-atherogenic roles. On the one hand, hyaluronic acid may promote atherosclerosis because
9
Hyaluronic acid also mediates leukocyte extravasation, smooth muscle cell migration and
neointimal proliferation after vascular injury by binding to the hyaluronan mediated motility
receptor (HMMR). Further supporting this hypothesis is a 2005 study by Chai et al that showed
that smooth muscle-specific overexpression of hyaluronan promoted the development of aortic
atherosclerosis in apoE-knockout mice [38]. On the other hand, the role of hyaluronan in
atherogenesis may be context-dependent because hyaluronan also imparts certain viscoelastic
properties to the vasculature that prevents leukocyte adhesion and can inhibit vascular smooth
muscle cell (VSMC) growth [39]. If hyaluronan synthesis is blocked by a pharmaceutical agent
in apoE-null mice, then atherosclerotic plaque development rapidly increases and leads to
pro-thrombotic states [40]. However, the model of a Stab2-null mouse does not show any specific
phenotype except for higher than normal levels of circulating hyaluronan [41, 42].
Plasma hyaluronan was measured first in the inbred 129S6, DBA/2J and C57BL/6J
inbred mice. The DBA mice were found to have ten times higher levels of plasma hyaluronan
than the other strains and this difference was attributed to SNP genotypes near the Stab2 gene on
Chromosome 10. Nevertheless, these differences in plasma hyaluronan could be due to many
other differences besides differences in scavenger receptor uptake, such as variation in synthesis,
degradation or interaction with other receptors [30]. The association between plasma hyaluronan
level and various hyaluronan synthases, hyaluronidases, hyaluronan-related receptors were tested
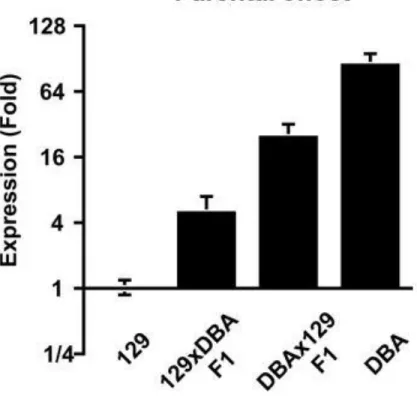
but none were found to be significant [30]. Expression level of Stab2 was also tested in various
tissues and strains through real-time PCR, as shown in Figure 2. Understandably, Stab2 levels in
the liver are high in all strains (129S6, DBA/2J and C57BL/6J) but are the highest in the DBA
mouse, although the differences between the strains are not significant. Also, surprisingly, Stab2
10
and C57BL/6J strains, suggesting significantly greater ectopic Stab2 expression [30]. Thus, the
significantly higher levels of plasma hyaluronan found in the DBA mice could be due to
decreased hyaluronan clearance (ie. nonfunctional STAB2 protein), which could explain the
DBA allele’s protective effects against atherosclerosis. However, this is only one possible theory
since STAB2 binds many ligands and there are potentially many more complicating interactions
at play. Nevertheless, experimental evidence suggests that Stab2 is a strong candidate gene for
the Aath5 locus and should be further investigated thoroughly.
1.7 Retrotransposon Activity and Impact
This ectopic expression of Stab2 in the heart, aorta and kidneys is attributed to a
DBA-specific insertion of a transposable element upstream of the Stab2 allele. Transposable elements
(TEs), also known as “jumping genes” or “transposons”, are sequences of DNA that can “jump”
from one area of the genome to another. TEs play an essential role in epigenetics because they
are involved in silencing of gene expression, both at the level of a single gene and across wider
chromosomal regions. In fact, TEs make up close to 50% of the entire human genome [43].
When active, TEs can become highly mutagenic, inserting into protein coding regions and
disrupting normal protein translation and causing chromosomal breakage and genomic
rearrangements. They can also impact the expression of neighboring genes by leading to
alternative splicing, polyadenylation and enhancement of expression. Because of these myriad
negative impacts, TEs are often called “selfish” or “parasitic elements” and their activity is
typically negatively correlated with genomic stability or fitness of the organism. However, most
TEs are not active and remain silent as cryptic elements. The genome has evolved many
11
heterochromatinization, post-transcriptional silencing by RNA interference, DNA methylation,
and germline silencing [44]. Nevertheless, TEs are an important part of the “regulatory toolkit of
the genome” [44].
There are two main categories of transposons, type I elements and type II elements. Type
I elements, or retrotransposons, replicate through a reverse transcription step. Thus, their mode
of propagation is called duplicative, or “copy and paste” transposition. Type I retrotransposons
can be categorized into two groups, long terminal repeat (LTR) retrotransposons and non-LTR
retrotransposons, based on whether the element contains direct repeats at the ends of the
elements. Type II elements, or transposons, on the other hand, integrate directly into the genome
without an additional reverse transcription step. Thus, the mode of propagation used by Type II
transposons is called “cut and paste” transposition. Rather than reverse transcription, a
transposase enzyme will recognize certain sequences that flank the element of interest, cut out
the element and integrate it into the new position [44]. The transposon of interest in this project
is a Type I retrotransposon, specifically an intracisternal A-particle (IAP) element. IAP elements
are endogenous retrovirus-like mobile sequences and there are approximately 1000 copies in the
mouse genome [45]. In IAP elements, the promoter regions of the LTRs can be especially
influenced by other genetic or environmental factors [46]. Epigenetic modes of regulation such
12
CHAPTER II: EPIGENETIC REGULATION OF STAB2D GENE
The Stab2 gene is a protein-coding gene that is located on Chromosome 10. It is the
major candidate gene of the Aath5 quantitative trait locus for atherosclerotic susceptibility at the
aortic arch, which was determined from the F2 population of an intercross between DBA-apoE
mice and 129-apoE mice [30]. The DBA allele for Stab2, hereby labeled as Stab2D, appears to
confer resistance towards atherosclerotic lesions. Thus, the Stab2D is being explored as a possible
causative gene for atheroprotective effects.
2.1 Insertion of Intracisternal A-Particle (IAP) Within Promoter Region of Stab2D
Initial investigation, spearheaded by Prof. Nobuyo Maeda, sought to explore the
structure-function relationship of the Stab2D gene. The inserted transposon sequence was first
identified by comparing the promoter regions of the DBA/2J and C56BL/6J alleles of the Stab2
gene using Sanger sequencing. A Southern blot analysis of the genomic DNA using probes
flanking the insertion sites was used to deduce that the insert is about 5.6 kb in length. The 3’
stend of the insertion element was cloned and sequenced and found to be highly homologous to
the 5’ LTR of an intracisternal A-particle. Therefore, the inserted element must have been
inserted in a reverse orientation relative to the direction of transcription of the Stab2 gene. In
addition to that, the sequence was further supported to be a 5’ LTR because it also contained
characteristic sequences such as a CAT-box and TATA-box in the U3 domain to initiate
13
nucleotide differences at the 5’ LTR at the end of the U5 region. Because the Stab2 IAP element
is flanked by two 6 bp direct repeats, AGATCT, at the insertion point, it is reasonable to
conclude that the insertion was only a single event. The proposed model of the Stab2D gene is shown in Figure 3.
2.2 CpG Methylation in 5’ LTR of Stab2D
Previous literature has shown that the 5’ LTR regions in retrotransposons may be subject
to CpG dinucleotide methylation, which may induce transcriptional repression of nearby genes
[citation]. A CpG dinucleotide is a cytosine separated by a guanosine by a phosphate bridge in a
linear sequence of nucleotide bases. Cytosine can become methylated to form 5-methylcytosine
and this consistent alteration will change gene expression. CpG islands, or regions with high
prevalence of CpG dinucleotides, are often found in promoter regions, near the transcription start
site of genes, such as in the case of Stab2. The 5’ LTR sequence of Stab2D contains 25 CpG
dinucleotides. Bisulfite sequencing of genomic DNA was then used to assess the methylation
status of this dinucleotide region.
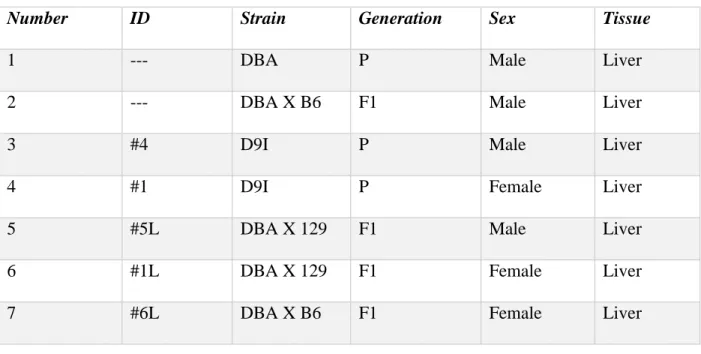
Genomic DNA was extracted from various organs of male and female mice of many
different strains to give a holistic view of methylation patterns. The current analysis focuses on
genomic DNA from the liver of a DBA male, the liver of a F1 male from a DBA X B6 cross, the
liver of a D9I male, the liver of a D9I female, the liver of a F1 male from a DBA X 129 cross,
the liver of a F1 female from a DBA X 129 cross and the liver of a F1 female from a DBA X B6
cross. The D9I mouse is a congenic strain that is homozygous for the Stab2D allele placed on a
129S6 background. A shorthand guide for referencing the animals is included in Table 2. Stab2
14
Although genomic DNA from the heart was also collected, the results will not be discussed in
this project.
After isolating, purifying and suspending the genomic DNA, the DNA underwent
bisulfite treatment, which converted cytosine residues into uracil but left 5-methylcytosines
untouched. Bisulfite treatment essentially helps to distinguish between methylated and
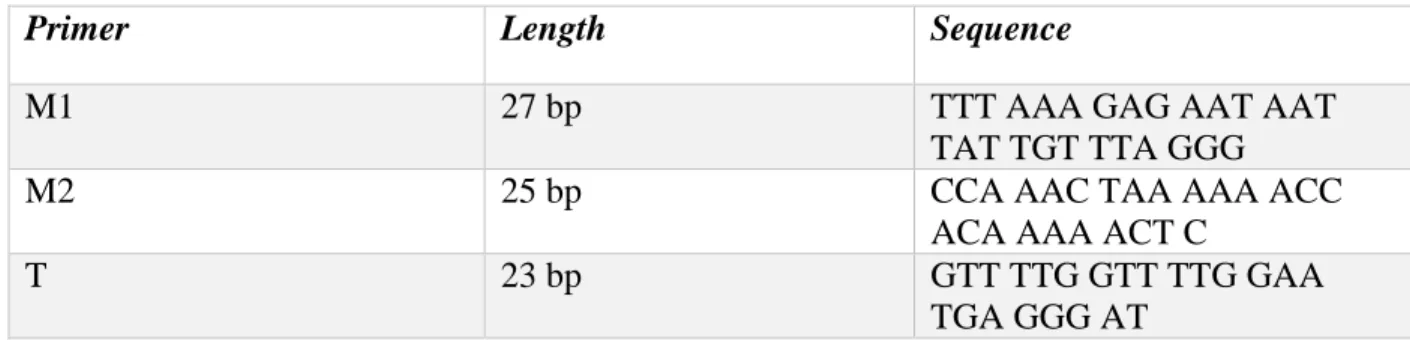
unmethylated CpG dinucleotides. The genomic DNA was PCR-amplified to amplify two
different segments, a 300 bp and a 600 bp segment, in the 5’ LTR region of the IAP insert. The
two segments were amplified using two different sets of primers, shown in Table 5, and
temperature cycle conditions were optimized for maximum yield. The segments were cloned and
grown up in culture. Once the DNA was isolated, a diagnostic cut using the AseI enzyme
followed by gel visualization was used to confirm that the correct regions were amplified. The
DNA was then sequenced using Sanger sequencing and the methylation status of the CpG
dinucleotides was compared to the original sequence. This procedure was repeated numerous
times to gather enough data to form conclusions.
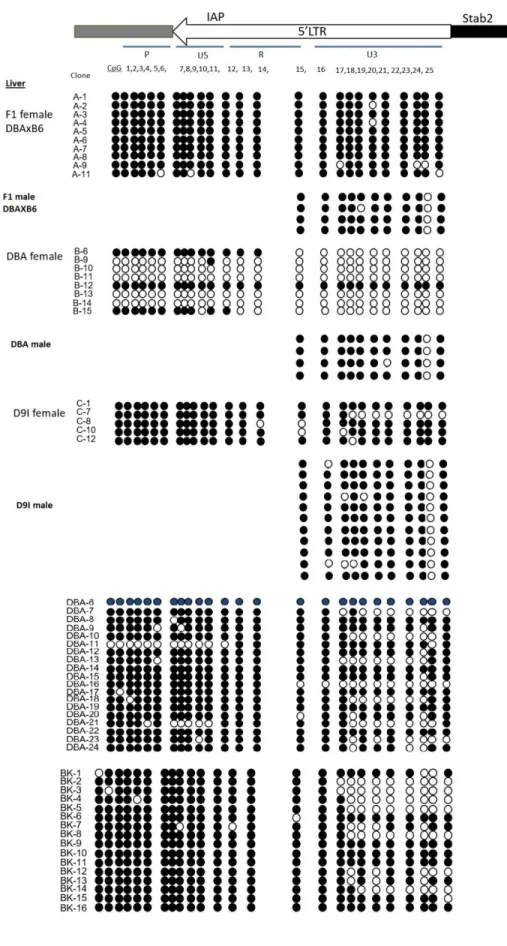
The methylation status of the 5’ LTR of the inserted IAP of the various strains is shown
in Figure 4. Several trends emerge. The methylation pattern of the DBA female liver is distinct
from that of the DBA male liver. The U3 region of the 5’ LTR of the Stab2D gene in the female
liver contains far fewer methylated CpG dinucleotides compared to the male liver. However,
interestingly, there was no difference in Stab2 expression in the liver between male and female
DBA mice. The methylation patterns between D9I male and female livers do not show any
drastic differences. A majority of CpG dinucleotides are methylated in both sexes. This same
15
CHAPTER III: TRANSIENT CHANGES IN GENE EXPRESSION INDUCED BY BACTERIAL ARTIFICIAL CHROMOSOME (BAC)
3.1 Determining Gene Expression Driven by IAP Insert
The previous section discussed the presence of an IAP element inserted in the reverse
orientation relative to the direction of transcription of the Stab2 gene. However, it was unclear
whether the insert drove expression of Stab2. Several different configurations were tested using a
luciferase reporter assay in human embryonic kidney (HEK293) cells with several different
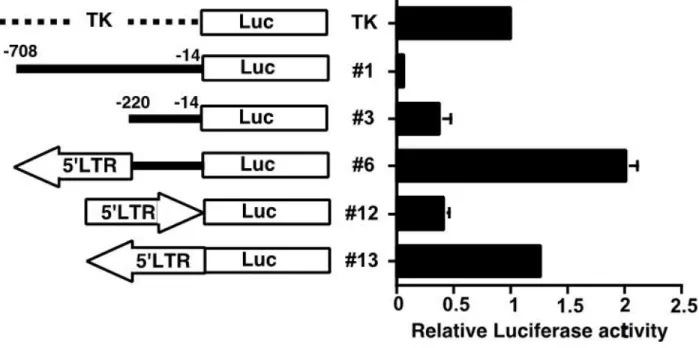
reporter plasmids, as shown in Figure 5. In this figure the top configuration shows luciferase
gene expression being driven by a thymidine kinase (TK) promoter, to show the basal level of
luciferase expression. Configurations 1 and 3 show a difference between presence and absence of
a 500 bp fragment upstream of the luciferase gene. Upon removing this 500 bp segment,
luciferase expression drops drastically, suggesting that perhaps there is a repressive gene element
located within. Separation of the basal promoter from this repression due to the insertion of the
IAP element may explain the extremely high levels of Stab2 expression in the liver as well as the
ectopic expression in the heart, aorta and kidneys in DBA/2J animals. Previous reports indicate
that the 5’ LTR is inserted in reverse orientation, thus validating the low expression found in
configuration 12. As seen in the differences in configurations 6 and 13, the addition of a 500 bp
Eco RI/Bgl II containing the 5’ LTR led to a 5-fold increase in expression over the 220 bp
minimum Stab2 promoter. Although the IAP element is oriented in the reverse direction relative
16
transcription and alter normal expression patterns of nearby genes. These experiments,
spearheaded by technician and lab manager Sylvia Hiller, lead to strong conclusions that
configuration 6 is the correct orientation. All subsequent experiments testing for epigenetic
effects on the IAP element and Stab2 were carried out using plasmid 6.
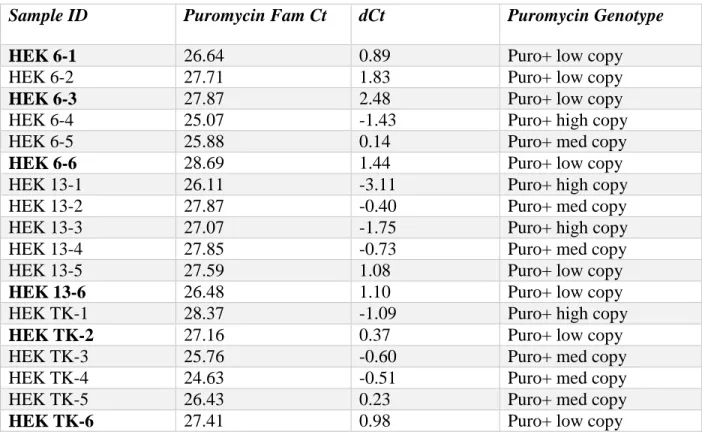
The plasmid with configuration 6 was introduced into HEK293 cells with stable
transfection. Several cell lines with this plasmid were expanded and qPCR was used to select for
the lines with the lowest copy number based on puromycin copy number and genotype. For
stable cell transfection, transfected cells were grown and expanded in the presence of puromycin.
Data from qPCR is shown in Table 3. The final cell lines chosen for further experimentation
included HEK 6-1, 6-3, 6-6, 13-6, TK-2 and TK-6.
3.2 Selection of Appropriate BAC
The previous section discussed the possibility that transcription of the Stab2D allele was
subject to epigenetic repression, notably methylation in the 5’ LTR sequence. In addition to
methylation, there also may be significant gene-gene effects due to putative modifier genes in the
129S6 and C57BL/6J mouse genomes. As shown in Figure 6, the F1 offspring from a DBA X
129 cross experience nearly a 4-fold decrease in Stab2 expression compared to a wildtype DBA
parent. There also may be significant parental effects in play because the F1 offspring from a 129
X DBA cross experience an even more drastic decrease, a nearly 16-fold decrease, in Stab2
expression. This data suggests that certain elements in the 129 genome may be repressing Stab2
17
Next, the 129 X DBA - F1 females were crossed with 129 males and B6 X DBA - F1
females were crossed with B6 males. Stab2 expression from the heart was compared between the
two groups. None of the B6-backcrossed mice showed any expression, suggesting that factors
from the B6 genome may also dominantly repress expression. In the 129-backcrossed mice,
expression was only detected in 5 out of 29 tested mice. This suggests that one modifier on the
129 genome is necessary but not sufficient to completely repress Stab2 expression. In the
literature, there are several reports of genetic modifiers located on chromosome 13 that regulate
ectopic expression of retrovirus-like sequences. These two modifiers are the modifier of
dactylaplasia, Mdac, which is mapped between 56 to 65 Mb on chromosome 13, [47] and the
modifier of cleft-palate, Clef2, which is mapped between 64.95 and 67.9 Mb [48]. Thus, regions
of chromosome 13 were also investigated for B6-derived genetic modifiers of Stab2 expression.
Data on recombinant inbred strains between DBA and B6 were compared to heat maps of Stab2
in adipose, aorta, heart, liver and macrophages, which were obtained from the Systems Genetics
Resource database. Chromosomes of the individual lines were then compared based on the
patterns of expression. Among the low Stab2-expressing lines, many of these lines carried the
regions of chr13:50-80 Mb from the B6 genome while simultaneously carrying the Stab2D gene. After a more fine-grained analysis, this region was further clarified. Comparison of the
recombinants showed that the modifier of the Stab2D gene was most likely to be found between
59.7 and 73.0 Mb of chromosome 13 in the mouse genome.
To test the hypothesis of modifier genes in this range affecting Stab2 expression, a
standard transfection experiment coupled with a luciferase reporter gene is suitable. However,
because this range of 59.7 to 73.0 Mb is large, normal plasmids cannot accommodate these
18
insert size is far larger, ranging from 150 to 350 kbp [49]. The BAC is essentially a piece of
bacterial DNA that can act as a vector to carry other DNA segments into the cell, where it can
then be identified and copied. Many BAC libraries have been formed to sequence the genome of
model organisms and can easily be accessed. Luckily, there were several BACs available that
contained inserts within the range of interest on chromosome 13. These BACs are RP23-161C4,
RP23-349F18, and RP23-30O22. Together, these 3 clones span the regions from 67 to 67.5 Mb.
Characteristics of these BACs are listed in Table 4. The BACs were obtained from the Roswell
Park Cancer Institute and after delivery, were subsequently confirmed and characterized.
3.3 Characterization of BAC
The BAC clones were grown on LB agar plates with chloramphenicol antibiotic. After
confirming growth, several colonies were sub-cultured and then subsequently grown up in liquid
culture. DNA was isolated from these cultures and digested with EcoRI enzyme. Gel
visualization showed distinct patterns between the 3 BAC clones that matched with a
computer-simulated restriction digest, as shown in Figure 7. A Southern transfer was done to preserve the
DNA bands.
3.4 Assessing Changes in Expression Patterns with Transfection of BAC
Initial experiments sought to determine which HEK293 cell line out of the 6 (1, 3,
6-6, 13-6-6, TK-2 and TK-6) produced the highest expression. Because these cell lines already
contained the plasmid carrying promoter elements and the luciferase gene, the cells could be
19
48 hours and the Cypridina luciferase assay was used to assess luciferase expression at these
time points. The results are shown in Figure 8. From this figure, it is evident that the 6-6 cell line
produces the highest expression, nearly twice the levels of even the second-highest expressing
cell line (6-3). The HEK293 6-6 cell line is used in all subsequent experiments.
The next step was to determine what dosage of BAC DNA to transfect into the HEK293
cells. Based on the literature, a range of dosages from 0 to 10.2 ug of DNA was used (0 ug, 0.4
ug, 3.4 ug, 6.8 ug and 10.2 ug) [50]. The Gli2 BAC is used in this experiment because although
it does not contain any sequences that may impact the luciferase gene or the upstream promoter
elements, the size (approximately 200 kb) is comparable to that of the RP23-161C4, 30O22 and
349F18 BAC clones. Adding varying amounts of Gli2 DNA and assessing its impact on gene
expression will help to construct a dosage curve and help to determine at which levels toxicity
occurs. A vehicle control consisting solely of transfection reagent is also used for comparison.
Approximately 10,000 cells from the HEK293 6-6 cell line were plated in a 96-well plate
and the transfection mix was added to the wells. After incubation for 48 hours, luciferase levels
were assessed with the Cypridina luciferase assay. The results are shown in Figure 9. At low and
high concentrations of DNA (0, 0.4 and 10.2 ug of DNA), expression levels plateau at around
75,000 relative light units (RLU). However, expression doubles to close to 200,000 RLU when
increasing the DNA amount over 8-fold (from 0.4 ug to 3.4 ug). Expression then increases by
about a third when doubling the DNA amount from 3.4 to 6.8 ug. The peak luciferase expression
is achieved when transfecting with 6.8 ug of BAC DNA. At 10.2 ug, the luciferase expression
falls drastically to nearly a sixth of its previous expression level at 6.8 ug. This finding
20
expression level at 10.2 ug is comparable to that established by transfection of the vehicle
control.
Next, the RP23 BAC clones (161C4, 30O22 and 349F18) were transfected into the
HEK293 6-6 cells at the same dosage of 6.8 ug per well. The media was assayed for luciferase
expression at 48 hours. The cells were washed afterward to eliminate excessive accumulation
and then measured again 20 hours later. The results are shown in Figure 10. In the vehicle
control, expression remained constant between 48 hours and the subsequent 20 hours. This is
consistent with previous assumptions because the vehicle control should not interact at all with
upstream promoter elements and therefore should not have any impact on luciferase gene
expression. The same consistency between time points is also observed in the experimental
groups transfected with 161C4 and 30O22 BAC clones. Curiously, transfection with the Gli2
BAC clone led to extremely high levels of luciferase expression in the first 48 hours, nearly
double that of the other groups. Although this expression decreased after washing, it remained
higher than the other groups. Because expression levels by Gli2 differed so much from that
induced by the BAC clones of interest, Gli2 may not be the appropriate negative control to be
used for comparison. However, this experiment also yielded interesting results concerning the
349F18 BAC clone. Although luciferase expression at 48 hours was comparable to the other
BAC groups, expression significantly decreased by about a third of the initial luminescence at 20
hours after washing. This is the only BAC experimental group that experienced decreased
expression and could be indicative of late repressive effects on the upstream promoter elements
21
CHAPTER IV: TRANSIENT CHANGES IN GENE EXPRESSION INDUCED BY GENES RSL1 AND RSL2
The overall goal of these experiments is to determine whether certain elements of the B6
genome can impact Stab2D expression. To this extent, a luciferase reporter construct containing
the luciferase gene driven by a DBA-specific promoter sequence containing the IAP
retrotransposon has been made. An established cell line (HEK293 6-6) has been made containing
low copies of the construct and expressing luciferase. The best candidate locus on chromosome
13 is a Kruppel-associated box domain-zinc finger protein (KRAB-ZFP) gene cluster. Since
most of this region is covered by three BAC plasmids, transfection experiments have been
carried out to introduce these plasmids into the HEK293 6-6 cell model. So far these tests have
shown that transient transfection of one of these BAC plasmids, RP23-349F18, has led to
decreased luciferase expression. This supports the hypothesis that elements in the B6 genome
contained in this BAC plasmid can repress gene expression in DBA mice by affecting upstream
promoter elements containing the IAP insert.
4.1 Selection of Rsl1 and Rsl2 Genes
Although the data appear to suggest that regions of RP23-349F18 may be responsible for
repressing Stab2D, this specific BAC clone contains a 200 kb insert which may contain dozens of
potential genes of interest. To further investigate this problem, the genetic region of interest must
first be further narrowed down. Within this 200 kb sequence, there are multiple zinc finger
22
comparison of the coding sequences indicates that Rsl1 of 129 and DBA animals share the same
amino acid sequence. Rsl2 (Zfp429) is also promising because the DBA sequence is different
from 129 and B6.
Rsl1 and Rsl2 stand for regulator of sex-limitation and these two genes have been implicated in sexually dimorphic liver gene expression in mice [51]. This is significant because
Stab2 expression is prominent in the liver and transcription of Stab2D is subject to epigenetic
repression and the parental effect. Stab2 expression levels will depend on whether the DBA
allele is inherited from the mother or father. Previous results have shown that if the DBA allele is
inherited from the mother, Stab2 levels are four-fold greater than if the DBA allele were
inherited from the father. It is possible that sexual dimorphism of gene expression could account
for these changes.
Also, KRAB-ZFPs constitute the largest family of transcriptional repressors and their
induced repression affects all cellular processes from apoptosis to proliferation to differentiation
[52]. The regulatory functions of KRAB-ZFPs could also extend to affect Stab2 gene expression
as well. Rsl1 and Rsl2 have been extensively studied by the Robins lab at the University of
Michigan and their reports have also utilized BAC transgenic rescue to test functionality of the
Rsl1 and Rsl2 genes. Thus, the previous use of BACS described in the previous section was justified. However, to assess which gene of interest may be responsible for the observed
repressive effects, it is useful to move to transfection experiments using a smaller and more well
23
4.2 Assessing Changes in Expression with Transfection of Rsl1 and Rsl2
A similar protocol as the one used for BAC transfection was carried out to test changes in
gene expression patterns due to the Rsl1 and Rsl2 genes. In the initial experiments, the total time
frame for sampling extended to 72 hours. The experiment workflow is illustrated in Figure 11.
Essentially, HEK293 6-6 cells were plated at 10,000 cells per well in a 96-well plate and grown
for 24 hours. After the 24 hours, the wells were transfected with 0.50 ug of DNA per well. After
48 hours, media was collected and assayed with the Cypridina luciferase assay. Then the cells
were washed and the media was replaced. After another 24 hours, more media was collected and
assayed again. The wash step was incorporated because it was suspected that after a total of 72
hours, the accumulated levels of luciferase would mask slight changes in expression patterns.
The results from this initial experiment are shown in Figure 12. In Figure 12, the control group
is a vehicle control containing all the components of the transfection mix except for the DNA.
The “Rsl1 Transfected” experimental group is the group transfected with 0.50 ug of Rsl1
plasmid. Similarly, the “Rsl2 Transfected” group is transfected with 0.50 ug of Rsl2 plasmid. As
seen in the figure, all experimental groups show similar levels of luciferase expression at 72
hours. However, there is wide variation in expression within the first 48 hours. The expression
level at 48 hours in the Control group is nearly five-fold compared to that of the Rsl1 and Rsl2
groups. These results suggest that Rsl1 and Rsl2 may contribute to repressive effects on Stab2D.
This data also shows that if there are any changes in expression, it would manifest within the first
48 hours. Consequently, the protocol was altered slightly to decrease the total time and optimize
procedures.
The adjusted protocol is shown in Figure 13. In this new procedure, cells were plated at
24
configuration was altered to allow greater uptake of plasmid into the cells and to allow for more
frequent sampling. If higher volumes of media were to be taken at more frequent intervals, the
original well must contain more cells and media to begin with. In addition to these changes, a
Gaussia plasmid control was also incorporated. The 80,000 cells/well were grown for 24 hours
before being transfected with 0.50 ug of DNA. Afterwards, media was sampled and assayed
every 8 hours for 48 hours. A cell proliferation assay was performed at the end of the experiment
using the cell lysate to evaluate how many cells were present. Four experimental groups were
used in this second experiment. The Control group contained only Gaussia plasmid. The Control
and Empty Vector group contained Gaussia plasmid and an empty vector pCMV6. The Rsl1 and
Rsl2 Transfected groups contain Gaussia plasmid and respectively Rsl1 and Rsl2 plasmids.
The trends in the Cypridina luciferase expression is shown in Figure 14A. The
expression of all four groups begin at roughly 0 RLU. As time progresses, the expression of the
Control and Control and EV groups rises at a more rapid rate compared to the Rsl1 and Rsl2
groups. At 16 hours, the expression of Control and Control and EV groups reach approximately
55,000 RLU while expression of Rsl1 and Rsl2 groups is slightly above 40,000 RLU. The
difference is most accentuated at 16 hours. At 28 hours, the differences begin to decrease and all
four groups begin to equilibrate at approximately 55,000 RLU. These results suggest that Rsl1
and Rsl2 do, in fact, have repressive effects. Although these studies do not directly prove that the
repressive effects are due to interaction with the upstream promoter elements of the Stab2D gene, this is the implied mechanism and further experiments must be carried out to confirm this.
In addition to the Cypridina assay, a Gaussia luciferase assay was also carried out.
Gaussia expression patterns would indicate how much of the Gaussia plasmid was incorporated
25
Gaussia expression are shown in Figure 14B. From 0 to 8 hours, expression of all four
experimental groups increased linearly and were consistent with each other. However, after 8
hours, the Gaussia expression of the Control and Rsl2 groups increased at a faster rate than the
Rsl1 group. Curiously, the expression level of the Control and EV group increased at a linear rate
compared to the exponential rate of the other three groups. When the Cypridina expression levels
are normalized by the Gaussia expression levels, slightly different trends emerge, as shown in
Figure 14C. While the Cypridina expression levels suggested that both Rsl1 and Rsl2 groups had
decreased expression, the newly normalized data suggest that only Rsl2 confers these effects.
The expression levels of the Rsl1 group match closely to that of the Control group but are not
significantly different. The same trends emerged when the expression patterns were normalized
by cell number, which was determined by a terminal cell proliferation assay. However, another
possibility is that the Rsl1 and Rsl2 groups should be compared against the Control and EV
group instead of the Control group because the Control group contains less DNA in each well.
Relative quantities of DNA are further elaborated in the following Materials and Methods
26
CHAPTER V: MATERIALS AND METHODS
5.1 Identifying IAP Insert Upstream of Stab2D
To clone the 3’ end of the insertion element, genomic DNA from a DBA/2J mouse was
first digested with an Eco-RI enzyme and a 600 bp fragment was PCR amplified from this
genomic DNA. The 600 bp fragment was self-ligated at a low concentration of 5 ng/uL using a
reverse primer that corresponds to the sequence in the promoter region of Stab2 and a forward
primer corresponding to the Eco-RI site in the intron 1 of Stab2.
5.2 Assessing methylation profile in 5’ LTR of Stab2D
Genomic DNA was extracted from the target tissue using the Qiagen DNeasy Blood and
Tissue Kit. The genomic DNA was then purified using a chloroform extraction and suspended in
Tris-EDTA buffer. Bisulfite conversion was done using the EpiTect Bisulfite Kit. The EpiTect
Bisulfite Kit can convert 1 ng to 2 ug of DNA with equal efficiency so approximately 1.5 ug of
genomic DNA was used each time. Analysis of the kit by the manufacturer shows over 99%
conversion of unmethylated cytosines. The protocol used differed slightly from the listed
protocol. The bisulfite reaction set up consisted of 1 uL of DNA (1.5-1.7 ug), 19 uL of RNase
free H2O, 85 uL of bisulfite solution and 35 uL of DNA Protect Buffer to form a 140 uL
solution. Cycle conditions were extended to allow for complete denaturation in CG rich regions.
27
incubation at 60 degrees Celsius for 20 minutes (extended), (3) denaturation at 95 degrees
Celsius for 5 minutes, (4) incubation at 60 degrees Celsius for 20 minutes, and finally (5)
indefinite hold at 20 degrees Celsius. The cycling was followed by a cleanup of the converted
DNA, following the protocol as prescribed by the EpiTect kit.
The PCR reaction setup used a 50 uL reaction mixture consisting of 5 uL of dimethyl
sulfoxide (DMSO), 2.5 uL of 20X Buffer, 1 uL of dNTP, 1 uL of DNA, 1 uL of each primer, 38
uL of ddH2O and 0.5 uL of Taq polymerase added after heating at 93 degrees Celsius for 3
minutes. A table of primers is shown in Table X. Temperature cycling conditions included (1)
initialization at 93 degrees Celsius for 4 minutes with a hot start, (2) denaturation at 93 degrees
Celsius for 30 seconds, (3) annealing at 58 degrees Celsius for 1 minute, (4) extension/elongation
at 68 degrees Celsius for 30 seconds (with steps 2-4 undergoing 40 total cycles), (5) final
elongation at 68 degrees Celsius for 5 minutes and (6) final hold at 25 degrees Celsius for an
indefinite period. The PCR products were visualized on a 2% agarose gel made from a 1:1 ratio
of agarose and SeaPlaque and 1X Helling’s solution. SeaPlaque agarose is used because it
produces gels that can distinguish smaller bands and gives higher clarity. The correct bands were
visualized, excised and then underwent gel purification. The 300 bp fragment was far easier to
amplify compared to the 600 bp fragment so much of the subsequent analysis focused on the
methylation status of the 300 bp fragment.
The purified PCR product was then ligated into TaKaRa T-vector pMD20, a 2.7 kb
plasmid with Ampicillin resistance. The ligation mix was composed of 1-2 uL of T-vector, 4 uL
of the PCR fragment, 1 uL of 10X ligation buffer, 1 uL of T4 ligase, and 1 uL of ddH2O. This
mix was stored at 4 degrees Celsius overnight before being mixed with DH5α competent cells,
28
product insert was found to be 1:4. Typically, 30 uL of competent cells were mixed with 4 uL of
ligation mix. The cells and ligation mix were plated onto a 2X Ampicillin NZY plate along with
X-gal in dimethylformamide (DMF) for blue-white screening. The plates were grown for up to
24 hours and the white colonies indicated successful plasmid uptake.
The white colonies were then sub-cultured into a 2 mL liquid culture of LB broth with 1X
Ampicillin. The liquid cultures were grown overnight for 12-16 hours at approximately 37
degrees Celsius in a shaker rotating at 225 rpm. The DNA was isolated using a mini-prep
procedure with home-made solutions of glucose Tris-EDTA, 0.4N NaCl, and 5M KOAc.
Quantity and purity of DNA was assessed using the BioTek Gen5 microplate reader. Finally, the
DNA from the liquid cultures were digested with NEB enzyme Ase I to confirm which cultures
contained the correct plasmid. Correct inserts would yield a 400 bp fragment on a gel. The DNA
for the successful clones would be sent to the UNC-Chapel Hill Genome Analysis Facility. The
completed sequences could be manually checked to see whether the CpG dinucleotide sites were
methylated or unmethylated.
5.3 Characterizing Bacterial Artificial Chromosome (BAC)
The BAC clones RP23-161C4, RP23-30O22 and RP23-349F18 were obtained from the
Children’s Hospital Oakland Research Institute (CHORI). The RP23 (RPCI-23) BAC library was
developed at the Roswell Park Cancer Institute and constructed by Kazutoyo Osoegawa and
Minako Tateno [53]. All three BAC clones used in this experiment were derived from the pooled
tissues of three 5-week old female C57BL/6J mice obtained from the Jackson Laboratory [53].
Mouse kidney and brain genomic DNA were isolated and partially digested with EcoRI and
29
which is 11,612 bp long. The average insert size for the RPCI-23 library is approximately 197 kb
long, making the total product approximately 200 kb long [53]. The ligation products were
transformed into DH10B electro-competent cells obtained from BRL Life Technologies. Upon
arrival, the BAC clones were in LB agar stab culture form and were immediately plated on LB
agar plates with 12.5 ug/mL of chloramphenicol antibiotic. The cultures were grown overnight at
37 degree Celsius and were sub-cultured onto another plate the following day while the original
plate was preserved in 4 degrees Celsius. Liquid cultures (5 mL) containing 12.5 ug/mL of
chloramphenicol were grown overnight for 12-16 hours in a shaker rotating at 225 rpm. A
portion of the liquid cultures were used to form frozen glycerol stocks which were stored at -80
degrees Celsius. The remaining portion of the liquid culture was used as an initial subculture and
expanded into 200 mL cultures. The large liquid cultures were grown in 500 mL flasks for
sufficient aeration for 12-16 hours until exponential logarithmic growth phase. Because of the
large size of BACs, DNA isolation can be difficult to achieve without shearing the DNA.
Consequently, a specific rapid alkaline lysis mini prep method from BACPAC CHORI was used
to assist in DNA isolation. This method is a modification of the standard Qiagen method but
does not use any organic extraction or columns, which would cause DNA shearing. Quantity and
purity of the BAC DNA was assessed using the BioTek Gen5 plate reader. The purified DNA
was then concentrated using a Speed Vac centrifugal evaporator. Afterwards, the restriction
digest of the BAC DNA was done using the EcoRI enzyme (from NEB) to excise the insert from
the vector. The digest was run at three different concentrations (30 ug/lane; 50 ug/lane; 100
ug/lane) on a 0.8% 4X Helling’s gel overnight at 20 V. For the Southern transfer, the DNA gel
was placed into an alkaline NaOH solution to denature the DNA and the DNA was transferred
30
5.4 Transfecting HEK293 Cells with BAC
Human embryonic kidney (HEK) 293 cells were purchased from Sigma-Aldrich. The
HEK293 6-6 cell line was previously established by Sylvia Hiller by stably transfecting the cells
with the luciferase reporter plasmid. The cell line was expanded at the fifth passage and stored as
frozen stocks preserved in DMSO. Passage number can significantly affect cell behavior and
uptake of foreign material so preserving stocks will ensure that all experiments begin with the
same passage number. HEK293 cells are used in these experiments because they are easy to
grow in culture and are readily transfectable. The cell line is grown in a 10% fetal bovine serum
(FBS) Dulbecco’s Modified Eagle’s Medium (DMEM) with 0.1% penicillin streptomycin.
The PierceTM Cypridina Luciferase Glow Assay Kit was used for all subsequent
luciferase assays. This assay kit provides a very sensitive system for detecting secreted or
intracellular luciferase activity in mammalian cell culture experiments. The assay is based on
luminescence measurement and luminescence is produced from the oxidation of vargulin by
Cypridina luciferase. The light produced is proportional to the activity of the promoter for Cypridina expression. The luciferase assay experiments were first carried out by plating 10,000 cells per well in a 96 well plate. This analysis focused on secreted luciferase so media was
sampled at select time points and frozen. Afterwards, a 10 uL sample of media was used for the
assay and once the reagent or working solution was added, the luminescence signal could be
immediately detected by the BioTeK Gen5 microplate reader. For transfection experiments, the
FuGene® HD transfection reagent was used and proportions and volumes were calculated
31
5.5 Selecting Rsl1 and Rsl2 Genes
The Rsl1 and Rsl2 plasmids were generously provided by Prof. Diane Robins of the
Department of Human Genetics at the University of Michigan Medical School. The Robins lab
has studied Rsl1 and Rsl2 extensively for many years and authored many publications on the
genes’ role in sexual dimorphism in the liver of mice. Several plasmids were provided. Rsl1 and
Rsl2 were cloned into expression vectors with 3 different epitope tags. Those with the
hemagglutinin (HA) tag and the V5 epitope tag are contained in the pcDNA3 backbone while the
constructs with the Flag tag are contained in the pCMV backbone. The plasmids were grown up
in DH5α competent cells. Cultures were picked and grown in liquid culture with ampicillin
resistance. DNA was isolated using an alkaline lysis method.
5.6 Transfecting HEK293 with Rsl1 and Rsl2
Transfection with the Rsl1 and Rsl2 plasmids was accomplished using the FuGene® HD
transfection reagent. The ratio of Gaussia plasmid to Rsl1, Rsl2 or pCMV6 empty vector DNA
was 1:3. The total amount of DNA added to the wells of all groups except for the Control group
was 0.5 ug per well. The Control group contained less DNA because it only contained the same
amount of Gaussia plasmid as was used in the other groups. The transfection mix was composed
of DNA solution and Opti-MEM reduced serum medium. The same volume of FuGene® HD
transfection reagent was then added to each mix and the final mixture of 155 uL was incubated at
room temperature for 12-15 minutes. An aliquot of 25 uL was added to each well afterwards.
The cells were consistently washed and the media was changed before transfection. At 8 hours
after transfection, the cells were washed and the media was replaced again to remove the
32
intervals. Other time intervals could have also been used but 8 hours was chosen for
convenience. The Cypridina and Gaussia luciferase assays were done in opaque 96-well plates
and luminescence was detected immediately with the BioTeK Gen5 microplate reader. The
luminescence signal was normalized to 80,000 RLU to the highest well and all filter sets were
changed to detect luminescence. The cell proliferation assay used was the CyQuant Cell
Proliferation Assay Kit from Thermo Fisher which used a fluorometric dye that binds to the
33
CHAPTER VI: CONCLUSION
Evaluating these collected data, it is possible that the genes Rsl1 and Rsl2 may be
responsible for the repressive effects of BAC clone 349F18. Experiments introducing BAC
clones into the HEK293 6-6 cell model have shown that while expression is not significantly
different from that of the Control group, it is significantly different from that of the Gli2 empty
vector group. For example, as shown in Figure 10, at 48 hours, expression levels from 161C4,
349F18 and 30O22 are approximately the same level as the Control, hovering at around 80,000
RLU, but are about a half of the level of expression from the Gli2 empty vector group. At 68
hours, after a wash, expression from 161C4 and 30O22 are still the same as that of the Control
but still lower than that of the Gli2 empty vector group. The 349F18 group is the only group that
shows decreased expression after the wash that is significantly different from that of the Control
(p=0.005259), 161C4 (p=0.017724), and Gli2 (p=0.017522), which could be indicative of more
long term repression of target gene expression. The problem of whether the experimental group
should be compared against the Control or against the Gli2 empty vector group is not resolved.
If the groups are to be compared against the Control, only 349F18 at 68 hours would suggest
repression. However, if the groups are compared against the Gli2 empty vector, potentially all
the groups (at 48 hours) or at least 349F18 and 30O22 (at 68 hours) would suggest repression.
The Gli2 BAC DNA was chosen because it is approximately the same size as the other BAC
clones used (~200 kb) but is not reported to have any effect on Stab2 or nearby gene elements. In
34
changes besides the intended repression effect. Therefore, the Gli2 BAC empty vector should
serve as a more accurate control group than the vehicle control containing no DNA.
This question reappears during the experiments using transfection of Rsl1 and Rsl2
plasmids. As shown in Figure 14A, the expression of the Control and Control and EV groups
increases at a steady rate but the Rsl1 and Rsl2 groups show slightly dampened levels of
expression. However, when the Cypridina expression levels are normalized to the Gaussia
expression levels, the trend, shown in Figure 14C is not so clear. The expression of the Control
and EV group peaks at 8 hours transfection, plateaus and then levels off after 16 hours
post-transfection. A similar trend manifests for the remaining groups (Control, Rsl1 and Rsl2) but the
expression is roughly half the level of the Control and EV group. If the proper control for
comparison is held to be the Control group, then only Rsl2 may have a chance of exhibiting
repressive effects. However, if Control and EV is held to be the proper control, then both Rsl1
and Rsl2 show significant repressive effects. Once again, the Control and EV group, containing
both Gaussia plasmid and the pCMV6 empty vector, possesses the same amount of DNA
compared to the Rsl1 and Rsl2 groups. Theoretically, the Control and EV group should be
considered the appropriate control. Additionally, one other possibility for future work is to
simply use another empty vector to replace Gli2 for BAC transfection experiments and pCMV6
for Rsl1/Rsl2 transfection experiments. If the trend repeats, then the transient albeit elevated
levels of expression is not endogenous to the sequence but rather the additional amounts of
DNA.
Normalization poses another problem to this experiment setup. Currently, Cypridina
expression levels are normalized to Gaussia expression levels. Gaussia plasmid serves as a