*Corresponding author: Muchdie ISSN: 0976-3031
Research Article
SPATIAL VARIATIONS IN TECHNICAL EFFICIENCY AND RETURN TO SCALE IN THE
INDONESIAN ECONOMY
Muchdie
Department of Management, Post Graduate School Muhammadiyah University of
Prof. DR. HAMKA (UHAMKA)
ARTICLE INFO ABSTRACT
This paper reports an analysis of technical efficiency and returns to scale in the Indonesia economy during 1983-2013 with special attention to the spatial dimension of the economy. The study focused on seven group of islands: Sumatera (10 Provinces), Java (6 Provinces), Kalimantan (4 Provinces), Sulawesi (6 Provinces), Bali-Nusa Tenggara (3 Provinces), and Maluku (2 Provinces) and Papua (2 Provinces). Cobb Douglass production function was employed to calculate technical efficiency and return to scale using regression analysis. Time series data during 1983-2013 on Gross Regional Domestic Bruto, Capital Stock, and Employment were collected from many sources at the National Statistics Agency. The results show that technical efficiency in production varies among regions. Provinces with coefficients of technical efficiency below that at national level exhibited increasing return to scale. Otherwise, the Provinces with coefficients of technical efficiency above that at national level exhibited decreasing return to scale.
INTRODUCTION
Economists have long recognised that technology is a factor of production, and even the most important factor, given its role in labor quality and the design of capital good. Technological advances play a crucial role in improving productivity and thus the standard of living of a system; economic system (Adam,
2006).
Most economists today agree with the hypothesis that both innovation and technological spilovers are the main engine for explaining productivity growth. According to the theory of location, it is reasonable to view that economic growth unevenly happened in a national economy. Regional disparities do exist in Indonesia economy. There are some regions that grow very fast and there are others that grow very slowly. In Indonesia, some provinces grow very fast such as provinces in Java Island and those in Sumatera Island. Some others grow very slowly, such as in West Nusa Tenggara and in East Nusa Tenggara.
Measuring the effect of technology on productivity is a difficult pursuit. It is generally approached through metrics such as Gross Domestic Product, GDP per capita and Total Factor Productivity (TFP). The former two attempts to capture the overall output of a given economy from a macro-environmental perspective. The latter is attempting to measure technologically driven advancement through noting increase in overall output
without increasing in input. This is done through utilising production function equations and identifying when the output is greater than the supposed input, implying an advance in external technological environment (Boundless, 2016). The technology can be regarded as a primary resource in economic development. The level of technology is also an important determinant of economic growth. The rapid rate of growth can be achieved through high level of technology. It was observed that innovation or technological progress is the only determinant of economic progress. But if the level of technology is constant the process of growth will stop. Thus, it is the technological progress which keeps the economy moving. Inventions and innovations have been largely responsible for rapid economic growth in developed countries
(Debasish, 2016).
In economics, the Cobb-Douglas production function is widely used to represent the relationship of an output to input (Bao
Hong, 2008). It was proposed by Knut Wicksell (1851-1926)
and tested against statistical evident by Cobb, C and Douglas, P
(1928). From Cobb-Douglas production function, technical efficiency also known as total factor productivity, retun to scale, and output-capital elasticity as well as output-labor elasticity can easily be calculated by employing regression analysis (Salvator, 1996).
Previous research on technical efficiency, return to scale and output elasticities has been conducted, among others by Biresh
Recent Scientific
Research
International Journal of Recent Scientific Research
Vol. 7, Issue, 10, pp. 13625-13629, October, 2016
Copyright © Muchdie., 2016, this is an open-access article distributed under the terms of the Creative Commons Attribution License, which permits unrestricted use, distribution and reproduction in any medium, provided the original work is properly cited.
Article History:
Received 20th June, 2016
Received in revised form 29th August, 2016 Accepted 30th September, 2016
Published online 28th October, 2016
Key Words:
Indonesian Economy
K. Sahoo, at. al. (2014), Krivonozhko,V. E. at.al (2007),
Tewodros G. Gebreselasie (2008), Feng, G and Serletis, A
(2010), Nondo, C (2014), Holyk, S (2016), Jatto. N. A (2013),
Page, John M. Jr (1980), Erkoc, T. E.(2012), Kui-Wai Li, at.al
(2007), and Yudistira, D (2004). Measuring Indonesia’s
sectoral efficiencies has been conducted by Rizaldi Akbar
(2015). As far, no study on Indonesian’s regional technical efficiency has been done.
METHODS
Cobb-Douglas production function, Q = K L, was employed in this exercise to calculate technical efficiency (return to scale (+), output-capital elasticityand output-labor elasticityThis production function was developed and statistically tester by Cobb, C. and Douglas, P., during 1927-1947, where:
Q = total production (the real value of all good and services produced in a year;
K = capital input (the real value of all machinery, equipment, and building;
L = labor input (the total number of person-hours worked in a year;
technical efficiency in production process, known as total factor productivity;
= output-capital elasticity;
= output-labor elasticity.
Technical efficiency (, or total factor productivity (TFP) is the portion of output not explained by the amount of input used in production (Comin, 2006). This is a method of measuring overall productivity of business, industries or economies. Technical efficiency is the effectiveness with which a given set inputs is used to produced an output. An economy is said to be technically efficient if an economy is producing the maximum output from the minimum quantity of inputs, such as labor, capital and technology. Technical efficiency is related to productive efficiency wich is a concern with producing at the lowest point on the short run averaga cost curve. Thus productive efficiency required technical efficiency (Pettinger,
2012).
The values of andare basically determined by available technology. Output elasticity measure the responsiveness of output to a change in levels either capital or labor used in production. Further more, if = 1, the production function has a constant return to scale, meaning that doubling the usage of capital (K) and labor (L) will also double output (Q). If +
< 1, return to scale are decreasing and if > 1, return to scale are increasing.
The output elasticity of capital, EK = Q/K.K/Q = Q/K.K/Q = Similarly, the output elasticity of labor, EL = Q/L.L/Q =
Q/L.L/Q = and EK + EL = + = return to scale (Salvator, 1996). Converting the production function from Q = K L into a logarithms form that is, ln Q = ln + lnK + ln L. As this is a linear form, then the coefficients (, and can easily be estimated by regression analysis (Gaspersz. 1996). The Cobb-Douglas production function can be estimated either from data for a single firm, industry, region or nation over time using time-series analysis or for a single firm, industry, region
or national one point in time using cross-sectional data
(Salvator, 1996).
Data needed for this exercise were sectoral data on Gross Domestic Regional Product, Regional Capital Stock and Regional Employment. Yearly data on GDRP, Regional Capital Stock and Regional Employment were collected from the Central Bureau of Statistics. Fortunately, data were available from the year of 1983-2013.
Gross Domestic Regional Bruto, Regional Capital Stocks and Regional Employment
Figure 1 presents Gross Domestic Regional Bruto (GDRB) by Island in million Rupiah during 1983 t0 2013, thirty year period. Java and Sumatera Islands dominated Indonesian economy, followed by the Island of Kalimantan, Sulawesi, Bali-Nusa Tenggara Barat, and Maluku-Papua. There were no spatial change in economic structure in term of GDRB among islands during that period. Even, disparities between Java and the rest of Indonesia became worse and worse. For instance, in 1983, the share of Java Island to Indonesian GDP was 58.19 % and in 2013 have increased to 61.24%. Meanwhile the share of Sumatera Island have decrease from 25.10% in 1983 to 21.15%. Kalimantan Island also experienced decreasing share from 9.63% in 1983 to 8.13% in 2013. The share of Sulawesi Island, Bali-Nusa Tenggara Island and Maluku-Papua Islands experienced in increasing share.
In term of growth of GDRB, Sulawesi Island had the highest growth during that period, in average of 6.97%, followed by
Figure 1 Gross Domestic Regional Bruto by Island (1983-2013)
-200,000,000 400,000,000 600,000,000 800,000,000 1,000,000,000 1,200,000,000 1,400,000,000 1,600,000,000 1,800,000,000 1 9 8 3 1 9 8 5 1 9 8 7 1 9 8 9 1 9 9 1 1 9 9 3 1 9 9 5 1 9 9 7 1 9 9 9 2 0 0 1 2 0 0 3 2 0 0 5 2 0 0 7 2 0 0 9 2 0 1 1 2 0 1 3 G ro ss D o m es ti c R eg io n a l B ru to (M il li o n R p ) Sumatera Java Kalimantan Sulawesi Bali-Nusa Tenggara Maluku-Papua
Figure 2 Capital Stock by Island (1983-2013)
Maluku-Papua Island (6.02%), Bali-Nusa Tenggara Island, (5.95%), Java Island (5.66%), Kalimantan Island (4.81%) and Sumatera Island (4.79%).
In term of growth of capital stock, Maluku-Papua Island had the highest growth during that period, in average of 8.33%, followed by Bali-Nusa Tenggara Island (7.76%), Sulawesi Island, (7.51%), Sumatera Island (6.93%), Kalimantan Island (6.79%) and Java Island (6.63%).
Figure 2 present the trend of capital stock in Indonesian economy during 1983 to 2013. Again, Java and Sumatera Island dominated capital stock of Indonesia, followed by Kalimantan Island, Sulawesi Island, Bali-Nusa Tenggara Island, and Maluku-Papua Island. There were no significant spatial change in economic structure in term of capital stock among islands during that period. Even, the share of Java Island decreasing from 68.9% in 1983 to 65.98% in 2013. The share of Java Island in term of capital stock still three times more than of that at Sumatera Island (19.21% in 1983 to 20.20% in 2013). Meanwhile, the Kalimantan Island and the rest of Indonesia experienced no significant increase in the share of capital stock. The share of capital stock of Kalimantan island increase from 6.23% in 1983 to 6.26% in 2013. The share of Sulawesi Island, Bali-Nusa Tenggara Island and Maluku-Papua Islands have increased from 2.34% to 2.88%, 1.99% to 2.64%, and 1.32% to 2.05% consecutively from 1983 to 2013.
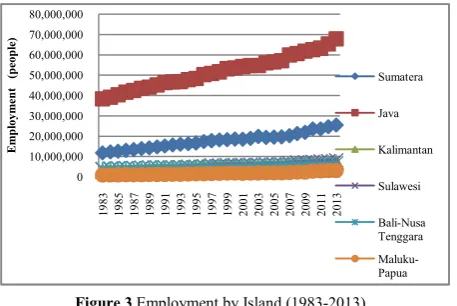
Figure 3 presents the employment trends by Island during 1983 to 2013. Java and Sumatera Islands have dominated the Indonesian economy in term of employment, followed by Kalimantan and sometimes Sulawesi, Bali-Nusa Tenggara and Maluku-Papua. During the period, there were no significant spatial change in employment. As Java Island dominated the economy indicated by 62.41% share of Java Island in Indonesian employment in 1983 and decrease to 57.3% in 2013. The share of Sumatera Island was 19.10% in 1983 and 21.49% in 2013. Followed by the share of Sulawesi Island of 6.16% in 1983 to 6.83% in 2013, Kalimantan Island of 4.33% in 1983 to 6.10% in 2013. The Island of Bali-Nusa Tenggara experienced decreasing share from 6.58% in 1983 to 5.65% in 2013. Meanwhile, the share of employment of Maluku-Papua Island have increased slightly from 1.42% in 1983 to 2.63% in 2013.
In term of growth of employment, Maluku-Papua Island had the highest growth during that period, in an average of 4.40 followed by Kalimantan Island (3.41%), Sumatera Island,
(2.63%), Sulawesi Island (2.58%), Java Island (1.93%) and Bali-Nusa Tenggara Island (1.71%).
RESULTS AND DISCUSSION
The coeffcient of technical efficiency in Indonesian production function from 1983 to 2013 was negative (-4.0073), with = 0.2715 and = 1.2413 resulting the coefficient of return to scale ( + ) =1.5128. It means that the production function of the Indonesian economy from 1983 to 2013 exhibiting increasing return to scale. Three group of islands in wich the coefficients of technical efficiency above that at the national level were Kalimantan, Maluku and Papua. These Islands have exhibited decreasing return to scale as the sum of the coefficients of output-capital elasticity () and the coefficients of output-labor elasticity () were more than unity; Kalimantan Island ( + ) = 0.6997, Maluku Island (+ ) =0.5692, and Papua Island (+) = 0.6175. Another four groups of islands in which the coefficients of technical efficiency below that at the national level were Sumatera, Java, Sulawesi and Bali-Nusa Tenggara. These group of islands in turn exhibiting increasing return to scale as the summation of the coefficients of output-capital elasticity () and the coefficients of output-labor elasticity () were less than unity; Sumatera Island with ( + ) =1.1819, Java Island ( + ) = 2.0449, Sulawesi ( + ) = 2,1467 and Bali-Nusa Tenggara Island (+ ) = 1.2373.
Table 1 presents the kuadrant of technical efficiency’s coefficient (above and below that at national level) and return to scale (increasing and decreasing return to scale). The group of islands with the coefficients of technical efficiency that was higher than that at national level also exhibited decreasing return to scale. These group of islands were Kalimantan, Maluku and Papua. The others with the coefficient of technical efficiency less than that at national level and exhibited increasing return to scale were Sumatera, Java, Sulawesi and Bali-Nusa Tenggara.
In Sumatera Islands, there were six provinces in which the coefficients of technical efficiency were higher than that at the national level. The provinces were Nangroe Aceh Darussalam, North Sumatera, Riau, The Islands of Riau, South Sumatera and Bangka-Belitung. But these provinces exhibited decreasing return to scale as the sum of the coefficient of output-capital elasticity () and the coefficient of output-labor elasticity () were less than unity. Nangroe Aceh Darussalam with (+ ) =0.7756, North Sumatera with ( +) =0.9185, Riau with ( +
) = 0.5948, The Islands of Riau with (+ ) =0.7553, South Sumatera with ( +) = 0.3435 and Bangka-Belitung with (
+) =0.6142. Another four provinces in the Island of
Figure 3 Employment by Island (1983-2013)
0 10,000,000 20,000,000 30,000,000 40,000,000 50,000,000 60,000,000 70,000,000 80,000,000
1
9
8
3
1
9
8
5
1
9
8
7
1
9
8
9
1
9
9
1
1
9
9
3
1
9
9
5
1
9
9
7
1
9
9
9
2
0
0
1
2
0
0
3
2
0
0
5
2
0
0
7
2
0
0
9
2
0
1
1
2
0
1
3
E
m
p
lo
y
m
en
t
(p
eo
p
le
)
Sumatera
Java
Kalimantan
Sulawesi
Bali-Nusa Tenggara Maluku-Papua
Tabel 1 Technical Efficiency and Return to Scale: Seven Big Islands
Technical efficiency/ RTS
Incerasing Return to Scale
Decreasing Return to Scale
Above national
Kalimantan Island Maluku Islands
Papua Island
Below national
Sumatera Island Java Island Sulawesi Island Bali-Nusa Tenggara
Indonesian Economy
Sumatera, that were West Sumatera, Jambi, Bengkulu and Lampung in which the coefficients of technical efficiency were less than that at the national level. These provinces exhibited increasing return to scale as the sum of the coefficient of output-capital elasticity () and the coefficient of output-labor elasticity () were more than unity. The sum of ( + ) at West Sumatera was 1.5466, at Jambi was 1.6472, at Bengkulu was 1.8314 and at Lampung was 1.8369.
In the Island of Java, five out of six provinces in which the coefficients of technical efficiency below that at the national level, namely: Special Region of Jakarta the Capital City, Banten, West Java, Central Java and East Java. Only the Province of Yogyakarta that had the coefficient of technical efficiency higher than that at national level. The earlier five provinces exhibited increasing return to scale, meanwhile the latter exhibited decreasing return to scale. The sum of ( + ) for Jakarta was 1.3789, for Banten was 1.0197, for West Java 1.7006, Central Java was 1.0680, and East Java was 2.6049. Meanwhile the sum of (+for Yogyakarta was 0.6930.
In Kalimantan Island, there were two provinces in which the coefficients of technical efficiency above that at national level, namely South Kalimantan and East Kalimantan. These two provinces exhibit decreasing return to scale as the summation of (+ ) less than unity. The return to scale coefficient of the Province of South Kalimantan was 0.8837 and the Province of East Kalimantan was 0.8469. The other two provinces, namely West Kalimantan and Central Kalimantan had the coefficients of technical efficiency that less than that at national level. These two provinces also exhibited increasing return to scale as the summation of ( +) greater than unity. The summation of ( + ) for West Kalimantan was 1.6099 and for Central Kalimantan was 1.2459.
In the Island of Sulawesi, five out of six provinces had the coefficients of technical efficiency that less than that at national level. These provinces were North Sulawesi, Central Sulawesi, South-East Sulawesi, West Sulawesi and South Sulawesi. Only the province of Gorontalo with the coefficient of technical efficiency greater than that at national level. The first 5 provinced exhibited increasing return to scale, meanwhile, the latter exhibited decreasing return to scale. The summation of (+ ) for North Sulawesi was 1.8151, for Central Sulawesi was 1.6135, for South-East Sulawesi was 2.5249, for West Sulawesi was 1.1959 and for South Sulawesi was 2.5249. Meanwhile, the summation of ( + ) for the Province of Gorontalo was 0.8154.
In the Island of Bali and Nusa Tenggara, all provinces in Nusa Tenggara, namely Nusa Tenggara Barat and Nusa Tenggara Timur had the coefficient of technical efficiency in which less than that at national level. The Province of Bali (Bali Island) had the coefficient of technical efficiency greater than that at national level. The first two provinces, Nusa Tengara Barat and Nusa Tenggara Timur exhibited increasing return to scale as the summation of (+ ) for Nusa Tenggara Barat was 1.1946 and for Nusa Tenggara Timur was 1.4549. Meanwhile, the Province of Bali Island exhibited decreasing return to scale as the summation of ( +) for that province was 0.7954.
There are two provinces in Maluku Island, Maluku and North Maluku had the coefficient of technical efficiency above that at national level. These two provinces also exhibited decreasing return to scale as the summation ( + ) less than unity; for Maluku the summation of ( + ) was 0.5146 and for North Maluku was 0.5804.
In the island of Papua, there were two provinces, namely the Province of Papua and the the West Papua Province. The Province of Papua had the coefficient of technical efficiency above that at the national level and exhibiting decreasing retun to scale with the summation of ( + ) was 0.1681. Meanwhile the West Papua Province had the coefficient of technical efficiency below that at national level, and exhibiting increasing return to scale as the summation of ( + ) greater than unity, for West Papua Province was 1.8827.
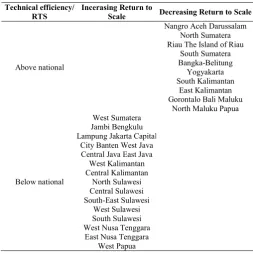
As shown in Table 2, provinces in which the coefficient of technical efficiency above that at national level and exhibiting decreasing return to scale were : Nangro Aceh Darussalam, North Sumatera, Riau, The Island of Riau, South Sumatera, Bangka-Belitung, Yogyakarta, South Kalimantan, East Kalimantan, Gorontalo, Bali, Maluku, North Maluku and Papua. Other provinces in which the coefficients of technical efficiency below that at national level and exhibiting increasing return to scale were : West Sumatera, Jambi, Bengkulu, Lampung, Jakarta Capital City, Banten, West Java, Central Java, East Java, West Kalimantan, Central Kalimantan, North Sulawesi, Central Sulawesi, South-East Sulawesi, West Sulawesi, South Sulawesi, West Nusa Tenggara, East Nusa Tenggara, and West Papua.
There are two limitations of the study. Firstly, the time covered in this study was limited to thirty years period; 1983-2013, meanwhile the Indonesian economy have lasted for seventy years. Secondly, the scope of the study was aggregated in macro environment. The study of technical efficiency and
Table 2 Technical Efficiency and Return to Scale: Provincial Levels
Technical efficiency/ RTS
Incerasing Return to
Scale Decreasing Return to Scale
Above national
Nangro Aceh Darussalam North Sumatera Riau The Island of Riau
South Sumatera Bangka-Belitung
Yogyakarta South Kalimantan
East Kalimantan Gorontalo Bali Maluku
North Maluku Papua
Below national
West Sumatera Jambi Bengkulu Lampung Jakarta Capital
City Banten West Java Central Java East Java
West Kalimantan Central Kalimantan
North Sulawesi Central Sulawesi South-East Sulawesi
West Sulawesi South Sulawesi West Nusa Tenggara
return to scale usually conducted in a firm or industry as technical production was more homogeneus at the firm level. In the national economy, there might be a risk in aggregating technology.
CONCLUSION
Spatial variations in technical efficiency do exist in the Indonesian economy. The group of islands in which the coefficient of technical efficiency above that at national level, exhibited decreasing return to scale. On the contrary, the group of island in which the coefficients of technical efficiency below that at national level, exhibited increasing return to scale. At the provincial level, the provinces in which the coefficients of technical efficiency above that at national level, exhibited decreasing return to scale. The provinces in which the coefficients of technical efficiency below that at national level, exhibited increasing return to scale.
It could be suggested that the provinces with the coefficients of technical efficiency higher than that at the national level to not increase the inputs of production as the economy experiencing decreasing return to scale. Meanwhile the provinces that had the coefficients of technical efficiency lower than that at the national level to increase all inputs in production in order to increase output as the economy experiencing increasing return to scale.
References
Adams, J. (2006), the Contribution of Science and Technology to Production, the National Bureau of Economic Research, Cambridge Massachusett.
Bao Hong, Tan, (2008), “Cobb-Douglas Production Function” retrive on 22 June 2016 from
http://docentes.fe.unl.pt/jamador/Macro/cobb-douglas.pdf
Biresh K. Sahoo, Joe Zhu , Kaoru Tone, Bernhard M. Klemen, (2014), “Decomposing technical efficiency and scale elasticity in two-stage network DEA”, European Journal of Operational Research, Volume 233, Issue 3, 584–594.
Boundless,(2016), “Impacts of Technological Change on Productivity”, Boundless economics. 26 May 2016.
Retrived 22 June 2016 from
https://www.boundless.com/economics/texbook/boundle
ss-economics-texbook/economic-growth- 20/productivity-98/impacts-of-technological-change-on-productivity-370-12467/
Cobb C.W, and Douglas, P.H. (1928). “A Theory of Production”. American Economic Review 18 (Supplement), 139-165.
Comin, D., (2006), Total Factor Productivity, New York University, New York.
Debasish (2016), “Role of Technology in Economic
Development”, Economicsdiscussion.net, retrive 22 June 2016 from http://www.economics discussion.net/articles/role-of-technoloy-in-economic-development/4455.
Erkoc, T. E, (2012), “Estimation Methodology of Economic Efficiency: Stochastic Frontier Analysis versus Data Envelopment Analysis”, International Journal of
Academic Research in Economics and Management Sciences, January 2012, Vol. 1, No. 1, 1-23.
Feng, G and Serletis, A, (2010), “Efficiency, Technical Change, and Returns to Scale in Large US Banks: Panel Data Evidence from an Output Distance Function Satisfying Theoretical Regularity”. Journal of Banking & Finance 34(1), 127-138.
Gaspersz. V, (1996), Ekonomi Manajerial, Penerapan Konsep-Konsep Ekonomi DalamManajemen Bisnis Total (Mangerial Economics: Application of Economic Concepts in Total Business Management), PT Gramedia Pustaka Utama, Jakarta.
Gebreselasie, T.G. (2008) “Sectoral Elasticity of Substitution and Returns to Scale in South Africa”, South African Journal of Economics, Special Issue: Industrial growth and employment in South Africa, Volume 76, Issue Supplement s2, S110–S125.
Holyk, S, (2016), “Measuring Technical Efficiency and Economy on Scale in Finnish Food Processing Industry”. International Journal of Science: Basic and Applied Research, Vol 27, No 3, 226-238.
Jatto. N.A., (2013), “Assessing The Return to Scale: Evidence from Fish Farmers in Ilorin, Kwara State”, Russian Journal of Agricultural and Socio-Economic Sciences, 1(13), 56-59.
Krivonozhko, V. E. , Dvorkovich, A. V. , Utkin, O. B. , Zharkov I. D, Patrin, M. V. and Lyche A. V., (2007), “Computation of elasticity and scale effect in technical efficiency analysis of complex systems”. Computational Mathematics and Modeling, Volume 18, Issue 4, 432-452.
Kui-Wai Li, Tung Liu, and Lihong Yun, (2007), “Technology Progress, Efficiency, and Scale of Economy in Post-reform China”. Working Paper, Department of Economics and Finance, City University of Hong Kong, Hong Kong.
Nondo, C. (2014), “Evaluating the technical efficiency of African economies using DEA and the bootstrap approach”, African Journal of Economic and Sustainable Development, Volume 3, Issue 2 , 156-178.
Ondrej, M., (2012), “Data Issued in Total Factor Productivity Benchmarking: A Central European Perspective”, University Economics in Praque, Faculty of Business Administration Working Paper, 219-225.
Page, J. M. Jr, (1980), “Technical Efficiency and Economic Performance: Some Evidence from Ghana”, Oxford Economic Papers, New Series, Vol. 32, No. 2, 319-339. Pettinger, T, (2012), “Technical Efficiency Definition”, Get
Economic Help in www.economichelp.org/ blog/glossary/technical-efficiency.
Rizaldi Akbar, (2015), “Measuring Indonesia’s Sectoral Efficiencies: A Data Envelopment Analysis Approach”, Working Paper, University of Western Australia. Salvator, D, (1996), Managerial Economic in a Global
Economy, Irwin McGraw Hill, Boston.
Wikipedia (2016),: “Post Suharto Era”, retrive on 22 June
2016 from https:en.wikipedia.org/wiki/Post-Suharto_era. Yudistira, D. (2004),”Efficiency in Islamic Banking: An