R E S E A R C H A R T I C L E
Open Access
Application of a new dietary pattern
analysis method in nutritional
epidemiology
Fengqing Zhang
1*, Tinashe M. Tapera
1and Jiangtao Gou
2Abstract
Background:Diet plays an important role in chronic disease, and the use of dietary pattern analysis has grown rapidly as a way of deconstructing the complexity of nutritional intake and its relation to health. Pattern analysis methods, such as principal component analysis (PCA), have been used to investigate various dimensions of diet. Existing analytic methods, however, do not fully utilize the predictive potential of dietary assessment data. In particular, these methods are often suboptimal at predicting clinically important variables.
Methods:We propose a new dietary pattern analysis method using the advanced LASSO (Least Absolute Shrinkage and Selection Operator) model to improve the prediction of disease-related risk factors. Despite the potential advantages of LASSO, this is the first time that the model has been adapted for dietary pattern analysis. Hence, the systematic evaluation of the LASSO model as applied to dietary data and health outcomes is highly innovative and novel. Using Food Frequency Questionnaire data from NHANES 2005–2006, we apply PCA and LASSO to identify dietary patterns related to cardiovascular disease risk factors in healthy US adults (n= 2609) after controlling for confounding variables (e.g., age and BMI). Both analyses account for the sampling weights. Model performance in terms of prediction accuracy is evaluated using an independent test set.
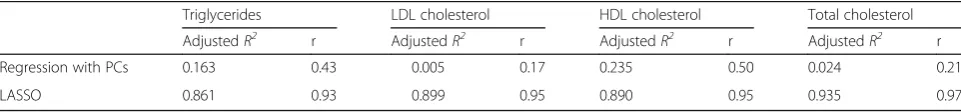
Results:PCA yields 10 principal components (PCs) that together account for 65% of the variation in the data set and represent distinct dietary patterns. These PCs are then used as predictors in a regression model to predict cardiovascular disease risk factors. We find that LASSO better predicts levels of triglycerides, LDL cholesterol, HDL cholesterol, and total cholesterol (adjustedR2= 0.861, 0.899, 0.890, and 0.935 respectively) than does the traditional, linear-regression-based, dietary pattern analysis method (adjustedR2= 0.163, 0.005, 0.235, and 0.024 respectively) when the latter is applied to components derived from PCA.
Conclusions:The proposed method is shown to be an appropriate and promising statistical means of deriving dietary patterns predictive of cardiovascular disease risk. Future studies, involving different diseases and risk factors, will be necessary before LASSO’s broader usefulness in nutritional epidemiology can be established.
Keywords:Dietary pattern analysis, LASSO, Principal component analysis, Cardiovascular disease, Food-frequency questionnaire, NHANES
* Correspondence:[email protected]
1Department of Psychology, Drexel University, Philadelphia, PA 19104, USA
Full list of author information is available at the end of the article
Background
With the global prevalence of chronic diseases increas-ing, it is now widely accepted that diet has an important role to play, as many of these diseases are affected by unhealthy dietary habits [1, 2]. A set of studies across cohorts [3–5] found that higher diet quality (top quintile) was consistently associated with an 11–28% reduced risk of death from all causes, cardiovascular disease, and can-cer when compared with the lowest quintile. This associ-ation was observed independent of known confounders. Given these disparities, it is essential to examine dietary intake in greater detail. Doing so will help to establish the role of diet in chronic diseases, assist in the development of targeted disease prevention initiatives, and improve the effectiveness of public health recommendations [6].
The complexities of nutrient intake and metabolism make the relationship between diet and health a multifa-ceted one. To capture the multidimensionality of diet, studies of the overall diet examine the combined effect of total dietary intake. This is important, since dietary components are consumed in combination and corre-lated with one another [7]. Complex and cumulative effects cannot be sufficiently captured by examining dietary components in isolation.
Currently, methods utilized by researchers in this field fall into two categories:investigator-drivenanddata-driven
[7]. The investigator-driven approach defines scores or in-dices of dietary quality based on a priori guidelines in the literature, then uses these measures to predict health sta-tus. The Healthy Eating Index (HEI), for example, has been used in the literature to summarize dietary quality [8], and has been shown to correlate with nutritional biomarkers [9]. In the data-driven approach, dietary patterns are empirically derived from the underlying dietary data using statistical models, such as principal component analysis (PCA), factor analysis, cluster analysis, and k -means, among others [1,10].
The implementation of the investigator-driven ap-proach is simple and reliable. In some cases, however, the indices defined by the literature are unable to pre-dict the current prevalence of diet-related chronic dis-ease with sufficient accuracy [7]. This problem arises partly because dietary quality scores combine many in-dividual foods without considering the correlated na-ture of the components. For example, people with a midrange HEI score can have very different contribut-ing dietary constituents – whether the individual con-stituents are all in the midrange, or whether some components are high while others are low. Additionally, dietary scores constructed by health professionals may miss important patterns of nutritional intake that affect cardiometabolic risk factors (e.g., blood lipids or gly-cemic control) and could be identified by a data-driven approach.
Meanwhile, data-driven methods have become popular among machine learning professionals, who have deployed such methods with increasing success. Cluster analysis and
k-means, for example, can be used to empirically discover subgroups of participants with distinct dietary patterns [11–15], while factor and principal component analyses can be used to reduce the number of variables (e.g., individual foods) in a data set to those which explain most of the vari-ability in the data [11,16]. These methods, however, have been found to be sensitive to extrema and to have relatively low prediction accuracy [17, 18]. Additionally, these me-thods are not entirely data-driven: rather, they require mul-tiple decisions from the investigators (e.g., the number of groups ink-means and the choice of the metrics quantify-ing group dissimilarity). These decisions may vary by inves-tigator and hence the empirically derived dietary patterns are not entirely data driven, which could lead to problems in the validity and reproducibility of these pattern analysis models [7,12].
In order to enhance the prediction of clinically mean-ingful risk factors and the identification of predictive dietary patterns, we propose a new dietary pattern ana-lysis method using the advanced LASSO (Least Absolute Shrinkage and Selection Operator) model [19]. LASSO is a regression-based method that penalizes the absolute value of the regression coefficients; in doing so, it regu-larizes the impact a coefficient may have in the overall regression [19]. The greater the penalization, the greater the shrinkage of a coefficient, with some coefficients shrinking to zero. The LASSO model is hence a form of automatic feature selection, an approach which has found successful application in such fields as neuroimag-ing, genomics, and computational chemistry [20–22]. Despite the potential advantages of LASSO, this is the first time the model will be applied to the identification and examination of dietary patterns predictive of health outcomes. Hence, the systematic evaluation of the LASSO model in analyzing dietary data related to health outcomes is considered highly innovative and novel.
The following paper describes an attempt to predict risk factors for cardiovascular disease using the LASSO model on food intake data collected through the Food Frequency Questionnaire. In this instance, risk is quanti-fied as the levels of triglycerides, LDL cholesterol, HDL cholesterol, and total cholesterol in the blood. In addition, we compare the predictive performance of LASSO against the traditional dietary pattern analysis method utilizing linear regression, applying the latter to components de-rived from PCA.
Methods
Data set
from 2005 to 2006. As part of the nationwide survey, which involves about 5000 persons each year, participants com-pleted the Household Adult Questionnaire and the Dietary Food Frequency Questionnaire. Additionally, participants were invited to a mobile examination center, where blood and urine specimens were obtained, and a number of tests and measurements—including body measurements and blood pressure testing—were performed [23].
Analytic sample
A number of restrictive criteria were applied to the data. Participants in our final data set were at least 20 years old; were not pregnant or lactating at the time of data collection; were not currently suffering from heart dis-ease; and were not diabetic. Moreover, our data set in-cluded only participants who had completed the Food Frequency Questionnaire. The resulting sample included 2609 participants with a mean age of 49.56 and a mean BMI of 28.45 kg/m2. 54% of the participants in our sample were female. Laboratory measures of biomarkers for cardiovascular disease (triglycerides, LDL cholesterol, HDL cholesterol, and total cholesterol) were obtained from NHANES.
Dietary assessment methods
Participants in the NHANES study completed a full Food Frequency Questionnaire (FFQ), which collects quan-titative information about how many times foods had been consumed in the past month. FFQ has been validated to be a reasonable tool to assess relationships between dietary habits and cardiovascular risk factors [6,24]. Following the recommendation in the literature [6], the individual food items and beverages measured in FFQ were combined into 35 food groups that represented all major food groups con-sumed by the US population. FFQ raw scores were available from NHANES website.
Laboratory methods
The NHANES dataset also includes significant labora-tory test results. Among these were blood tests, which were conducted via venipuncture, with necessary precau-tions taken to ensure participants could safely complete the test. Blood levels of triglycerides, LDL cholesterol, HDL cholesterol, and total cholesterol were available from NHANES.
Statistical analysis Statistical software
Data preparation and analysis were completed in R Statistical Software (version 3.2.3 [2015-12-10]). Be-cause NHANES studies tend to oversample underrepre-sented ethnicities, NHANES provides guidelines for sample weighting and stratification in the data set. LASSO is available in the “glmnet” R package (Version 2.5).
Appropriate sampling weights were used in all statistical analyses to account for the unequal probability of selec-tion, noncoverage, and nonresponse bias. The “survey” package in R allows for principal component analysis, automatically incorporating the sampling weights pro-vided by NHANES. Before we applied the LASSO model, each observation was weighted by its sampling weight as recommended by NHANES [23].
Statistical methods
Principal Component Analysis (PCA) is a popular ana-lytical tool used commonly in dimension-reduction problems. Consider a data matrix X wherein each of the
nrows represents an observation and each of the p col-umns represents a variable or feature. The transform-ation that PCA utilizes is p-dimensional vectors of loadings that map old data points to new data points along principal components. The first principal compo-nent explains the largest possible variance; each succeed-ing component accounts for the highest possible remaining variance, under the constraint that it is or-thogonal to preceding components.
The LASSO model is a shrinkage method, inspired by stepwise selection, that actively selects for a subset of predictors for regression; this results in a more interpret-able and relevant set of predictors [19]. LASSO performs similarly to the ridge regression approach, which shrinks regression coefficients in order to reduce the likelihood of overfitting. In the case of LASSO, however, this shrinkage technique is computed so as to shrink the sum of the absolute value of regression coefficients, for-cing some of the coefficients to zero and hence selecting for non-zero features. Ridge regression, by contrast, is unable to shrink coefficients to exact zeros. In this sense, LASSO is a sparse model.
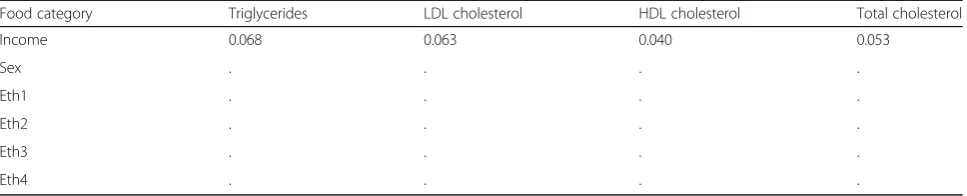
the test set was used to evaluate the model performance. Model evaluation using an independent test set was an objective way to examine how well the trained model could be generalized to a new set of data. Correlation coefficients and adjusted R2 for each model on the test data were computed for model comparison. Covariates such as age, sex, BMI, income, and ethnicity were con-trolled for in all analyses.
Results
Principal component analysis
PCA yielded 10 principal components (PCs) that to-gether accounted for 65% of the variation in the data set. The top 10 PCs were selected based on the scree plot, eigenvalues, and parallel analysis, as well as consider-ation of content and theoretical consistency. To inter-pret the dietary patterns represented by these PCs, we focused on the top and bottom 10th percentile of the PC loadings for each food category (Table 1). Both the magnitude and direction of the loadings were inter-preted. For example, the first principal component (PC1) has high positive loadings of organ meats (e.g., liver and other organ meats), fish, chili peppers, and gravy, indi-cating that participants who followed the dietary pattern represented by PC1 typically consumed greater amounts of these foods. The second principal component (PC2) represents a healthy dietary pattern with high consump-tion of fruits and vegetables (green, dark-yellow, and other) and low consumption of liquor, soft drinks, beer, and gravy. In contrast, the third principal component (PC3) characterizes a relatively unhealthy dietary pattern with high consumption of high-fat dairy, red meat, fined grains, sweets and low consumption of meal re-placements, organ meats, liquor, and wine. Additionally, PC4 identifies a large number of liquids with positive loadings of juice, fruit juices, and soft drinks as well as negative loadings of coffee and tea. PC4 also has large negative loadings of non-dairy cream and sweets. PC5 has high positive loadings of vegetables, salad dressing, and beer as well as large negative loadings of low-fat dairy, sweets, whole grains, and margarine. PC 6 repre-sents a dietary pattern with high consumption of low-fat dairy and alcoholic beverages (e.g., liquor, beer, wine). The remaining principal components can be interpreted in a similar way based on the sign and absolute value of the PC loadings.
Linear regression with selected principal components The 10 selected principal components were included in the multiple linear regression model to predict the levels of triglycerides, LDL cholesterol, HDL cholesterol, and total cholesterol. The regression model was first esti-mated using the training set and then evaluated using the test set. During the training stage, the regression
model was statistically significant for triglycerides (F(18, 760) = 6.04,p< .001), LDL cholesterol (F(18, 736) = 3.85,
p< .001), HDL cholesterol (F(18, 1617) = 6.04, p< .001), and total cholesterol (F(18, 1617) = 7.21, p< .001). To avoid model overfitting, model performance was evalu-ated using the independent test set. The correlation co-efficient between the observed outcome and the predicted outcome for the test data was 0.43, 0.17, 0.50, and 0.21 for triglycerides, LDL cholesterol, HDL chol-esterol, and total cholesterol respectively (Table 2). Additionally, adjusted R2, the modified version of R2
that has been adjusted for the number of predictors in the model, was calculated for each regression model using the test data (adjusted R2= 0.163, 0.005, 0.235, and 0.024 for triglycerides, LDL cholesterol, HDL chol-esterol, and total cholesterol respectively).
The LASSO model
The LASSO model was directly applied to the defined food categories to predict the levels of triglycerides, LDL cholesterol, HDL cholesterol, and total cholesterol. The model tuning parameter lambda was automatically se-lected using cross-validation to zero out the coefficients of categories not helpful for predicting the outcomes. For triglycerides, the model included 12 predictors with non-zero coefficients and yielded a correlation coeffi-cient of 0.93 and adjustedR2of 0.861 for the independ-ent test set (Table 2). For LDL, the model identified 18 predictors with non-zero coefficients and produced a correlation coefficient of 0.95 and adjusted R2 of 0.899 for the test set. For predicting HDL and total choles-terol, the model selected 25 and 29 predictors. As shown in Table 2, the correlation coefficients calculated using the test set were 0.95 and 0.97 for HDL and total choles-terol respectively. The corresponding adjusted R2values were 0.890 and 0.935.
Triglycerides
In the multiple regression with selected principal com-ponents, significant predictors for triglycerides were PC2 (b=−0.037,t=−2.99,p= 0.003), and PC3 (b= 0.039,
Table 1Top and bottom 10th percentile of PC loadings for given food categories
Food Category PC1 PC2 PC3 PC4 PC5 PC6 PC7 PC8 PC9 PC10
Low-fat Dairy 0.055 . . . −0.475 0.312 −0.266 . . .
High-fat Dairy . . 0.318 . . . 0.282 . . .
Non-dairy Cream . . . −0.354 . −0.227 . −0.266 . .
Meal Replacement . . −0.213 . . . .
Red Meats . . 0.298 . . . 0.222 −0.286
Processed Meats . . . 0.189 .
Organ Meats 0.239 . −0.19 . . . .
Poultry . . . −0.164 0.334 . −0.367
Fish 0.211 . . . 0.206 . −0.245
Eggs . . . 0.233 .
Soups . . . .
Refined Grains . . 0.376 . . . .
Sweets 0.059 . 0.306 −0.365 −0.271 . . . −0.237 .
Snacks . . . 0.188 . 0.293
Nuts . . . 0.365
Whole Grains . . . . −0.413 . . . . .
Fruit . 0.335 . . . .
Juice . . . 0.163 . . 0.25 −0.234 . −0.273
Legumes . . . −0.21 . . . .
Chili Peppers 0.237 . . . .
Potatoes . . . 0.176
Green, leafy vegetables . 0.302 . . 0.236 . . . . .
Dark-yellow Vegetables . 0.248 . . . .
Tomatoes . . . 0.166 . . . . −0.283 .
Other Vegetables . 0.34 . . 0.23 . . . . .
Margarine . . . . −0.254 −0.211 −0.394 −0.227 . 0.308
Butter . . . 0.499 . 0.358 .
Salad Dressings . . . . 0.228 . . . . .
Coffee 0.068 . . −0.592 . . . −0.318 . .
Tea . . . −0.273 . −0.372 . 0.404 −0.436 .
Liquor . −0.202 −0.16 . . 0.241 . . . .
Fruit Juices . . . 0.224 . . 0.273 . −0.273 .
Soft Drinks 0.047 −0.238 . 0.14 . . −0.283 . . .
Beer . −0.208 . . 0.198 0.377 . . . .
Wine . . −0.221 . . 0.276 . . . .
Gravy 0.215 −0.188 . . . .
Note: food categories were based on those used by Kerver et al. [6]
Table 2Model comparison between linear regression with selected principal components and the LASSO model in terms of adjustedR2and correlation coefficient
r
Triglycerides LDL cholesterol HDL cholesterol Total cholesterol
AdjustedR2 r AdjustedR2 r AdjustedR2 r AdjustedR2 r
Regression with PCs 0.163 0.43 0.005 0.17 0.235 0.50 0.024 0.21
organ meat, chili, dark-yellow vegetables, tea, and wine was negatively associated with the level of triglycerides.
LDL cholesterol
Multiple regression analysis with selected principal com-ponents yielded significant predictors for LDL choles-terol, including PC4 (b=−0.025, t=−2.55, p= 0.011) and PC6 (b=−0.032,t=−2.76,p= 0.006). This suggests that both PC4 and PC6 negatively correlated with the level of LDL cholesterol. PC4 contained large negative loadings of non-dairy cream and sweets. PC6 represented a dietary pattern with high consumption of low-fat dairy and alcoholic beverages (e.g., liquor, beer, wine). Similar findings were suggested by the LASSO model. From Table 3, we can see that high consumption of low-fat dairy, meal replacements, organ meats, soups, chili, liquor, and wine predicted a decreased level of LDL cholesterol, while high consumption of high-fat dairy, red meat, re-fined grains, and sweets predicted an increased LDL chol-esterol level.
HDL cholesterol
Significant predictors for HDL cholesterol in the multiple regression model were PC2 (b= 0.008,t= 2.11,p= 0.035), PC3 (b=−0.009,t=−2.29, p= 0.022), PC4 (b=−0.015,
t=−2.86, p= 0.004), PC5 (b= 0.029, t= 5.38, p< .001), and PC6 (b= 0.040, t= 6.43, p< .001). This suggests that the level of HDL cholesterol, known as “good” cholesterol, positively correlated with high consump-tion of fruits and vegetables (represented by PC2) and low consumption of high-fat dairy, sweets and red meats (characteristics of PC3). Additionally, increased consumption of vegetables, salad dressing and beer (de-noted by PC5) as well as low-fat dairy and alcoholic beverages (PC6) predicted an increased HDL choles-terol level. PC4 represented a dietary pattern with high consumption of a number of liquids (e.g., juice, fruit juices and soft drinks) and low consumption of non-dairy cream and sweets. Hence, the dietary pattern characterized by PC4 was negatively associated with the level of both “good” and “bad” cholesterol levels. Results from the LASSO model suggest that increased consumption of veg-etables and decreased consumption of a number of liquids (e.g., juice and soft drinks) predicted increases in the level of HDL cholesterol. Additionally, consumption of proteins such as organ meats, nuts, chili peppers, and eggs pre-dicted decreases in HDL, while high-fat dairy and refined grains predicted increases in HDL level.
Total cholesterol
For total cholesterol levels, PC3 (b= 0.007, t= 2.41,
p= 0.016), PC4 (b=−0.013, t=−3.07, p= 0.002), and PC5 (b= 0.016,t= 3.79, p< .001) were significant predic-tors in the multiple regression model. As described
previously, PC3 represented a relatively unhealthy dietary pattern with high consumption of high-fat dairy, red meat, refined grains, and sweets. Thus, PC3 was positively asso-ciated with the level of total cholesterol. The dietary pat-tern characterized by high consumption of a number of liquids and low consumption of non-dairy cream and sweets (PC4) was negatively associated with the level of total cholesterol. Additionally, PC5, characterized by high consumption of vegetables, salad dressing and beer, was positively related to the level of total cholesterol. Re-sults from the LASSO model suggested similar findings. The increased consumption of high-fat dairy, red meat, sweets, and certain vegetables (e.g., peppers, green beans) predicted an increase in total cholesterol, while higher consumption of non-dairy cream, meal replace-ments, organ meats, legumes, liquor and soft drinks predicted a decrease.
Discussion
The study marks the first application of the LASSO model, a powerful analytic tool, to the identification of dietary patterns predictive of cardiovascular disease re-lated risk factors. Results show that LASSO achieved higher prediction accuracy and explained a much larger percent of variability in all four risk factors than did a multiple regression model with derived principal compo-nents. The major limitation of PCA in dietary pattern identification is that patterns explaining most of the variation in diet intake don’t necessarily explain an equivalent amount of variation in the outcome variable. This is because PCA uses only the covariance matrix of predictors without taking the outcome variable into con-sideration. In general, PCA, factor and cluster analyses are not prediction techniques; therefore, identified pat-terns are not guaranteed to be predictive of specific health outcomes. In contrast, the LASSO model per-forms variable selection and prediction simultaneously, resulting in a sparse model including only food groups predictive of the outcome.
Table 3Estimated coefficients for the individual food categories according to the LASSO model
Food category Triglycerides LDL cholesterol HDL cholesterol Total cholesterol
(Intercept) 86.702 85.593 97.060 101.835
Lfat_dairy . −0.002 . −0.001
Hfat_dairy . 0.007 0.037 0.045
Non_dairy_cream −0.006 . −0.007 −0.013
Meal_repl −0.058 −0.087 −0.052 −0.066
Red_meat . 0.001 . 0.043
Processed_meat . . . .
Organ_meats −0.333 −0.383 −0.394 −0.472
Poultry . . . .
Fish . . . .
Eggs . . −0.011 −0.011
Soups . −0.017 −0.005 −0.021
Refined_grains . 0.010 0.019 0.031
Sweets . 0.011 . 0.020
Snacks . . . −0.003
Nuts . . −0.011 −0.015
Whole_grains . . −0.006 −0.005
Pizza . . . −0.001
Fruit . . . .
Juice . . −0.006 −0.009
Legumes . . −0.012 −0.025
Chili −0.039 −0.105 −0.128 −0.137
Potatoes . . . .
Green_leafy_veg . . 0.002 .
Cruciferous_veg . . . .
Darkyellow_veg −0.021 . . .
Tomatoes . . . 0.013
Other_veg . . 0.034 0.036
Margarine . −0.024 −0.018 −0.027
Butter . −0.019 −0.013 −0.024
Salad_dressings . . 0.007 .
Coffee . . . .
Tea −0.002 . . .
Liquor . −0.032 −0.011 −0.013
Fruit_juices . . . .
Soft_drinks . . −0.010 −0.001
Beer . . . .
Wine −0.057 −0.021 −0.006 −0.038
Gravy −0.011 −0.029 −0.041 −0.048
Age 0.011 0.010 0.009 0.011
with triglyceride level and positively correlated with HDL cholesterol level. In this way, PCA can be a useful and in-terpretable tool for extracting patterns from the data. However, interpretation of identified principal compo-nents is not always straightforward, as some food cate-gories belonged to multiple principal components. For example, PC2 and PC5 both contained high positive loadings of green leafy vegetables and other vegetables. The LASSO model is typically more interpretable, since individual food categories rather than principal compo-nents are included as predictors and have their own es-timated coefficients to indicate their effect on the outcome. Meal replacements and organ meats, for ex-ample, were consistently estimated to have negative co-efficients across all four biomarkers.
Comparison of selected food groups by multiple re-gression and the LASSO model showed mixed results. For example, PC2 was negatively associated with triglyc-erides, indicating that increased consumption of fruit and vegetables predicted decreases in triglyceride level. The LASSO model for the same outcome only selected fruit and leafy vegetables as relevant variables, shrinking the coefficient for other vegetables (e.g., peppers, green beans) to zero. This level of sparsity may contribute to LASSO’s better prediction. A small handful of counterin-tuitive results were, however, found for the LASSO model, such as the prediction that increased intake of butter and margarine might lower total cholesterol levels. Note that the LASSO model included multiple types of foods in pre-dicting the outcome; thus the estimated coefficient for an individual food category represented the effect of this cat-egory on the outcome variable assuming the consumption of other foods stayed the same.
To further explain these findings, consider that total cholesterol is itself composed of multiple types of chemi-cals, mostly LDL and HDL cholesterol, commonly known as“bad”and“good”cholesterol respectively. The effect of the food categories on total cholesterol level may be some-what difficult to interpret due to the presence of both good and bad cholesterol. In essence, each component will be adding noise to the measurement of the other, and this noise may be detectable in a very sensitive system. Hence,
the LASSO model included many more categories of foods for predicting total cholesterol than for LDL choles-terol and triglycerides.
There are a number of considerations for future in-vestigation. The current literature suggests that analyt-ical tools based on underlying patterns are not easily replicable [7, 12], and thus some of the algorithms dis-cussed here are unlikely to do well in varied environ-ments. Some investigations have rendered other“hybrid methods” that compromise between hypothesis-driven methods and data-driven methods similar to LASSO. One such method is the reduced rank regression [18], whose strength lies in its flexibility in accounting for as much variance in the outcome variable as possible. It is comparable to LASSO inasmuch as both involve auto-matic variable selection. One disadvantage of reduced rank regression, however, is that the number of selected components must be less than or equal to the number of outcome variables, which may limit its potential applications.
There also exist further iterations of the LASSO model such as the sparse group LASSO [25]. This ap-proach, similar to LASSO as used here, performs auto-matic variable selection in the context of regression using a shrinkage parameter, but has the advantages of group assignment and group-level selection [25–27]. This method allows for the original individual predic-tors to be defined as groups of correlated predicpredic-tors; ultimately, it performs variable selection at both the in-dividual predictor and the group levels. Future research could apply sparse group LASSO to examine the issue of how to best define food groups based on Food Fre-quency Questionnaire raw scores.
Conclusions
In summary, the LASSO model is shown to be an appro-priate and promising statistical method to derive dietary patterns predictive of diseases or health outcomes. To the best of our knowledge, LASSO has not been applied to identify and examine dietary patterns predictive of health outcomes. Hence, our application and evaluation of the LASSO model in this context is innovative and Table 3Estimated coefficients for the individual food categories according to the LASSO model(Continued)
Food category Triglycerides LDL cholesterol HDL cholesterol Total cholesterol
Income 0.068 0.063 0.040 0.053
Sex . . . .
Eth1 . . . .
Eth2 . . . .
Eth3 . . . .
Eth4 . . . .
novel. However, the usefulness of LASSO needs to be confirmed in future studies involving other diseases and risk factors such as some new emerging risk biomarkers in cardiovascular diseases and disorders (e.g., uric acid, growth-differentiation factor-15) [28]. We acknowledge the limitation of using levels of triglycerides, LDL, HDL and total cholesterol in the blood to predict cardiovascu-lar disease risk. A more comprehensive list of risk fac-tors for cardiovascular disease should be examined in future studies. Additional confounding covariates such as smoking status and social economic status should be considered.
Abbreviations
BMI:Body mass index; FFQ: Food frequency questionnaire; HEI: Healthy eating index; LASSO: Least absolute shrinkage and selection operator; PCA: Principal component analysis
Acknowledgments
We thank the editor and referees for their comments, which helped to improve the paper.
Funding
The project was partially supported by the Drexel Faculty Summer Research Award and Drexel Career Development Award. The content is solely the responsibility of the authors and does not necessarily represent the official views of Drexel University.
Availability of data and materials
The datasets generated and analyzed during the current study are available at the NHANES websitehttps://wwwn.cdc.gov/nchs/nhanes/
Authors’contributions
FZ, TT, and JG conceived and designed the study. FZ and TT conducted the statistical analysis and drafted the manuscript. JG revised the manuscript. All authors have read and approved the manuscript.
Ethics approval and consent to participate
Institutional Review Board (IRB) approval and documented written consent was obtained from participants by NHANES (Protocol #2005–06).
Consent for publication Not applicable.
Competing interests
The authors declare that they have no competing interests.
Publisher’s Note
Springer Nature remains neutral with regard to jurisdictional claims in published maps and institutional affiliations.
Author details 1
Department of Psychology, Drexel University, Philadelphia, PA 19104, USA. 2Department of Biostatistics and Bioinformatics, Fox Chase Cancer Center,
Temple University Health System, Philadelphia, PA 19111, USA.
Received: 13 June 2018 Accepted: 19 October 2018
References
1. Michels KB, Schulze MB. Can dietary patterns help us detect diet–disease associations? Nutr Res Rev. 2005;18(02):241–8.
2. McCullough M, Feskanich D, Stampfer M, Giovannucci E, Rimm E, Hu F, Spiegelman D, Hunter D, Colditz G, Willett W. Diet quality and major chronic disease risk in men and women: moving toward improved dietary guidance. Am J Clin Nutr. 2002;76(6):1261–71.
3. Bosire C, Stampfer MJ, Subar AF, Park Y, Kirkpatrick SI, Chiuve SE, Hollenbeck AR, Reedy J. Index-based dietary patterns and the risk of prostate cancer in the NIH-AARP diet and health study. Am J Epidemiol. 2013;177(6):504–13. 4. George SM, Irwin ML, Smith AW, Neuhouser ML, Reedy J, McTiernan A,
Alfano CM, Bernstein L, Ulrich CM, Baumgartner KB, et al. Postdiagnosis diet quality, the combination of diet quality and recreational physical activity, and prognosis after early-stage breast cancer. Cancer Causes Control. 2011; 22(4):589–98.
5. van der Voet H. Comparing the predictive accuracy of models using a simple randomization test. Chemometr Intell Lab Syst. 1994;25(2):313–23. 6. Kerver JM, Yang EJ, Bianchi L, Song WO. Dietary patterns associated with risk factors for cardiovascular disease in healthy US adults. Am J Clin Nutr. 2003 Dec;78(6):1103–10.
7. Ocké MC. Evaluation of methodologies for assessing the overall diet: dietary quality scores and dietary pattern analysis. Proc Nutr Soc. 2013;72(02):191–9. 8. Kennedy E, Ohls J, Carlson S, Fleming K. The healthy eating index: design
and applications. J Am Diet Assoc. 1995;95(10):1103–8. 9. Weinstein SJ, Vogt TM, Gerrior SA. Healthy eating index scores are
associated with blood nutrient concentrations in the third National Health and Nutrition Examination Survey. J Am Diet Assoc. 2004;104(4):576–84. 10. Bailey RL, Gutschall MD, Mitchell DC, Miller CK, Lawrence FR,
Smiciklas-Wright H. Comparative strategies for using cluster analysis to assess dietary patterns. J Am Diet Assoc. 2006;106(8):1194–200.
11. Newby PK, Tucker KL. Empirically derived eating patterns using factor or cluster analysis: a review. Nutr Rev. 2004;62(5):177–203.
12. Devlin UM, McNulty BA, Nugent AP, Gibney MJ. The use of cluster analysis to derive dietary patterns: methodological considerations, reproducibility, validity and the effect of energy mis-reporting. Proc Nutr Soc. 2012;71(4): 599–609.
13. Ogden LG, Stroebele N, Wyatt HR, Catenacci VA, Peters JC, Stuht J, Wing RR, Hill JO. Cluster analysis of the National Weight Control Registry to identify distinct subgroups maintaining successful weight loss. Obesity. 2012;20(10): 2039–47.
14. Gubbels JS, Kremers SPJ, Stafleu A, Dagnelie PC, de Vries SI, de Vries NK, Thijs C. Clustering of dietary intake and sedentary behavior in 2-year-old children. J Pediatr. 2009;155(2):194–8.
15. Thorpe MG, Milte CM, Crawford D, SA MN. A comparison of the dietary patterns derived by principal component analysis and cluster analysis in older Australians. Int J Behav Nutr Phys Act. 2016;13(1):30.
16. Reedy J, Wirfält E, Flood A, Mitrou PN, Krebs-Smith SM, Kipnis V, Midthune D, Leitzmann M, Hollenbeck A, Schatzkin A, et al. Comparing 3 dietary pattern methods—cluster analysis, factor analysis, and index analysis—with colorectal cancer risk: the NIH–AARP diet and health study. Am J Epidemiol. 2010;171(4):479–87.
17. Kant AK. Dietary patterns and health outcomes. J Am Diet Assoc. 2004; 104(4):615–35.
18. Hoffmann K, Schulze MB, Schienkiewitz A, Nöthlings U, Boeing H. Application of a new statistical method to derive dietary patterns in nutritional epidemiology. Am J Epidemiol. 2004;159(10):935–44. 19. Tibshirani R. Regression shrinkage and selection via the lasso. J Royal Stat
Soc Series B. Stat Methodol. 1996;58(1):267–88.
20. Lu Y, Zhou Y, Qu W, Deng M, Zhang CA. Lasso regression model for the construction of microRNA-target regulatory networks. Bioinformatics. 2011; 27(17):2406–13.
21. Dyar M, Carmosino M, Breves E, Ozanne M, Clegg S, Wiens R. Comparison of partial least squares and lasso regression techniques as applied to laser-induced breakdown spectroscopy of geological samples. Spectrochim Acta B. 2012;70:51–67.
22. Kohannim O, Hibar DP, Stein JL, Jahanshad N, Hua X, Rajagopalan P, Toga A, Jack CR Jr, Weiner MW, De Zubicaray GI. Discovery and replication of gene influences on brain structure using LASSO regression. Front Neurosci. 2012; 6:115.
23. National Center for Health Statistics. National Health and Nutrition Examination Survey. Hyattsville: Centers for Disease Control and Prevention; 2005-2006.
24. Sauvageot N, Alkerwi A, Albert A, Guillaume M. Use of food frequency questionnaire to assess relationships between dietary habits and cardiovascular risk factors in NESCAV study: validation with biomarkers. Nutr J. 2013;12:143.
26. Huang J, Breheny P, Ma S. A selective review of group selection in high-dimensional models. Stat Sci. 2012;27(4).https://doi.org/10.1214/12-STS392. 27. Pavlou M, Ambler G, Seaman S, De Iorio M, Omar RZ. Review and evaluation
of penalised regression methods for risk prediction in low-dimensional data with few events. Stat Med. 2016;35(7):1159–77.