Performance of Histogram Modification by LOG
Function for CBIR using Statistical Parameters of Bins
Contents
Dr. H. B. Kekre
Sr. Professor
Kavita Sonawane
Ph.D. Research Scholar
Abstract — In this paper we are introducing the new histogram specification using LOG function to modify the histogram. This histogram modification brings positive change in the features to be extracted from R, G and B planes of the image modified using the LOG function. Feature vectors are of dimension 8 which are extracted from the image contents segregated into 8 bins. These 8 bins are obtained by partitioning each plane(R, G and B) histogram
into two parts using ‘Centre of Gravity’ (CG). Image
contents extracted into 8 bins are used to represent the feature vector in the form of statistical moments. First four moments namely Mean, standard deviation (STD), skewness (SKEW) and kurtosis (KURTO) are extracted separately for each color content of the pixels counted into 8 bins. Query and database Image comparisons are carried out using the three similarity measures Euclidean distance (ED), Cosine correlation distance (CD) and Absolute distance (AD). Experimentation is performed using database of 2000 BMP images having 20 different classes. Set of 200 query images is used to test and evaluate the performance of the proposed approach. Three performance evaluation parameters used to evaluate the system are Precision Recall Cross over Point (PRCP), Longest String (LS) and Length of String to Retrieve all Relevant (LSRR).
Keywords — Histogram Specification, LOG, Bins, CG, Mean, STD, SKEW, KURTO, ED, CD, AD, PRCP, LS, LSRR.
I. I
NTRODUCTIONThis paper is recommending a new histogram specification in the form of simple LOG function to modify the histogram. This modification brings positive change in the image contents. These images contents are proving their best in terms of retrieval of similar images from large database. In brief we can say that this paper proposes a new CBIR system based on bins approach with the effect of LOG function to modify the image contents by modifying the image histogram. Various methods are exploited in the CBIR field to extract and represent the image feature for comparison. Some are from spatial domain and some from frequency domain [1][2][3]. CBIR is the vast and interesting area for the researchers to give their best so that fast and efficient CBIR system can be designed and implemented to satisfy CBIR user needs. The term fast defines the time taken by the approach or the algorithm used to extract the query image feature and comparing it with database images. Image features can be classified broadly as local and global image features [4][5]. Image features which are very basic according to the human perception and subjectivity are color, texture and shape.[7][8][9].
We are focusing on color feature of the image. Color is most distinguishing image visual feature.[10][11][12]. Feature extraction process carried out in this work starts with the separation of image into R, G and B planes. For each plane we compute the original histogram and also the histogram modified using LOG function is obtained. The color histogram is color descriptor or can be termed as global image feature. [13][14]. It is invariant to variations in scale, rotation and translation of an image [15]. Feature vector dimension is also an important factor to be considered in fast and efficient design of retrieval system. Various dimension reduction techniques used by many researchers includes PCA, linear, non-linear independent component analysis (ICA), Local Tangent Space Analysis (LTSA) etc.[16][17][18]. We are using a simple technique to reduce the feature vector dimension and represent the image. Each histogram is divided into two parts by calculating the CG. This leads to the generation of eight bins (2 parts of each of the three planes i.e. 23= 8 bins). It gives the feature vector of dimension 8 which greatly reduces the systems execution time while extracting and comparing the image features. All image pixels are then segregated into these 8 bins according to the R, G and B intensities falling in specific range or partition of the R, G B histograms respectively[19][20]. This image information taken onto 8 bins is actually the count of the pixels possessing the specific intensity range. Further this count of pixels taken into each of the 8 bins is used to represent the actual feature vector of the image. The image features are represented in 12 different formats for each i.e original and modified histogram. It includes the calculation of first four centralize absolute moments Mean, STD, SKEW and KURTO for each color R, G and B separately[21]. This way we have prepared 24 feature vector databases to store each of the 24 types of feature vectors separately. This greatly helps in the image comparison process. Query image is taken as an example
image to test and evaluate the system’s response for all
type of feature vectors. Experimentation is done using the database of 2000 BMP images created using 20 different classes including some classes from Wang Database[22]. Same set of randomly selected 200 images from database is used as queries to evaluate the performance of the system with respect to each type of feature vector. Three performance evaluation parameters used in this work are PRCP, LS and LSRR. Each one of them having its own
II. P
ROPOSED METHODMethod proposed in this paper is mainly highlighting the use of LOG function as histogram specification to modify histogram. It also deals with dimensionality reduction using bins approach to represent the image features.
A. LOG Function as Histogram Specification
Feature extraction process used in this paper is using the image contents based on partitioning of original as well as modified histogram. Histogram gives distribution of the image pixels across 256 intensity levels in Matlab. If Histogram specification is histogram equalization then it tries the pixel distribution such that it will be uniform to all intensity levels. In this case, we are using LOG function as histogram specification according to which the original histogram is modified and the desired one is obtained. The LOG function and its effect as histogram specification is shown in following Fig.1 to Fig.4.Fig.1. LOG function y=c*log(x+1) in Blue curve.
In Fig.1 we can see that red color is showing output
‘y=x’ and blue color represents the LOG transformation.
We can see that the original intensity levels are increased by some amount. This specification function is used to get the similar change in the intensities of the original image planes by changing their respective histograms. Part
B
shows the application of this LOG function over R, G andB plane’s histograms of an image.
B. Function to Modify the Histograms
As a part of feature extraction process we have applied this LOG function to RGB planes of each image of database to modify their histograms. Fig.2 shows the original image and its R, G, B components. Fig.3. represents the original and modified histogram (Using LOG transformation) of R plane. Effect of LOG function over R, G and B planes after modifying the histograms are shown in Fig.4. We may observe image details clearly after applying LOG function.
Fig.2. Original Bus Image with its Separated R, G and B planes
Fig.3. R-plane -Original Histogram and Modified Histogram
Fig.4. Modified R, G and B Planes after applying LOG Function
Feature extraction is the core part of any CBIR system. Feature vector we are using in this work is color content of the image. We are also dealing with the reduction of feature vector dimension which has direct impact on the computational complexity and execution time of the CBIR system. Instead of using all histogram bins (256 in MATLAB) as it is; we are working on the formation of just 8 bins out of 256. Process of 8 bins formation is explained as follows. It uses the Centre of gravity (CG) to segregate the image pixels uniformly into two partitions of each plane.
C. CG based Bins Formation:
Each image plane (R, G and B) histogram is divided into two partitions as shown in following Fig.5 for red plane by calculating the CG. These partitions are identified using
part ids ‘0’ and ‘1’. As three histograms partitioned into
two parts, it generates combinations 23= 8 bins. We follow following simple sequence of steps to segregate the image pixels into 8 bins.
Step1. Separate the image into R, G and B planes Step2. Obtain the histograms for R, G and B planes Step3. Modify these histograms using LOG function
‘y=c*log(x+1)’.
Step4. Divide the histograms in two parts by computing the CG for each separately.
Fig.5. Modified R Plane partitioned Using CG at RGL1
Step5. Pick up the pixel of the same image under feature extraction process and check its R, G and B values. Depending on which part of R, G, B histogram it falls assign a number ABC. The numerical value of A, B and C
depends on the part id ‘0’ or ‘1’. Thus giving a binary
number from ‘000’ to ‘111’. The respective pixel will fall
in one of the 8 bins. Thus all the image pixels will be distributed in 8 bins.
Step6. The statistical property of each bin contents leads to the formation of 8 dimensional feature vector representing the image.
D. Feature Vector Databases: 24 Databases
We have prepared total 12 different feature vector databases for original and LOG modified histograms. We are extracting three colors separately (R, G and B) and for each color we have extracted 4 statistical absolute centralize moments, this generates 12 types of feature vectors leading to 12 different databases for 2000 BMP images in the image database.
III. S
IMILARITYM
EASURE ANDP
ERFORMANCEE
VALUATIONP
ARAMETERSComparing the query image to obtain the desired set of
images is core part of any CBIR system from user’s point
of view. Generating the set of similar images in response to the given query is responsibility of the system designer. It is also important to check and evaluate the performance
of the system so that CBIR user’s satisfaction can be taken
care of. Following section A and B are discussing these two main phases of the work done.
A. Similarity Measure
CBIR system generates the set of images relevant to the query given by the user. When user fires a query to the system it extracts the feature vector for it. This feature vector is then compared with database image feature vectors. This comparison process is carried out in our system by means of three similarity measures; namely Euclidean distance, Absolute distance and Cosine correlation distance and is given in following equations 1, 2 and 3.
Euclidean Distance
21
n
i
i i
QI FQ FI
D (1)
Absolute Distance:
) (
1
I n
I
QI FQFI
D
(2)Cosine Correlation Distance
( ) ( ) ( ) ( )
) ( ) (
n Q n Q n D n D
n Q n D
(3)
Where D(n) and Q(n) are Database and Query feature Vectors resp.
These distances are sorted in ascending order i.e. from minimum to maximum. Retrieval set of images is prepared from the images picked up from these sorted distances which are close to query image.
B. Performance Evaluation Parameters
Performance of the proposed system is evaluated using three parameters namely PRCP, LS and LSRR which are defined as follows.
1. PRCP: Precision Recall Cross over Point
This is actually derived from the conventional CBIR evaluation parameters precision and recall.
Precision is fraction of relevant images to total retrieved images and recall is the fraction of relevant images to the total relevant images in the database. Precision and recall are equal at a point when total number of images retrieved is equal to the total number of relevant images in the database.
Thus PRCP value 1 indicates the ideal system performance where all relevant images from database are retrieved without any irrelevant image. PRCP value 0 gives the worst case performance indicates that all retrieved images are irrelevant. PRCP values between 0 to 1 are indicating that how far we are from the ideal system. 2. LS: Longest string
It gives the longest string of relevant images retrieved from database. It actually searches for the maximum continuous string of images relevant to query from the set of (2000 in our experiment) sorted string of images according to the distances sorted in ascending order.
3.
LSRR: Length of String to Retrieve all RelevantThis parameter generates the length of string to be traversed to collect all images relevant query from the database. Low value of LSRR indicates that the system is giving better performance and the higher value indicates that system takes longer time to collect all relevant images from database.
IV. R
ESULTS ANDD
ISCUSSIONSA. Database and Query images
Database Images: We have used database of 2000 BMP images having 20 different classes. It includes following classes. Fig.6. shows one sample image taken from each of the 20 classes.
Fig.6. Sample Images from 20 classes in Database
Query Images: We have worked out and tested all the methods based on the variations used in feature extraction process using the same set of 200 query images. It includes 10 randomly selected query images from each of the 20 classes.
Each of the 200 queries is executed individually to obtain the results for following three parameters. But we have put only either total or average value of 200 query images for each result.
B. PRCP: Results and Discussion
We have obtained PRCP where precision and recall both are same. The figures given in table are number of successes out of 20,000 images retrieved i.e. total PRCP for execution of 200 query images.
PRCP results obtained for all four moments Mean, STD, SKEW and KURTO given separately in tables I, II, III and IV respectively.
Table I. PRCP: MEAN
R G B
SM ORG LOG ORG LOG ORG LOG
ED 5567 5715 5384 5795 5264 5876
AD 5848 5854 5485 5890 5387 5870
CD 5651 5911 5751 6449 5210 6342
Table II. PRCP: STD
R G B
SM ORG LOG ORG LOG ORG LOG
ED 6066 6155 6277 6286 5700 5581
AD 6292 6403 6422 6498 5898 6018
CD 5604 5705 6147 6145 5485 5647
Table III. PRCP: SKEW
R G B
SM ORG LOG ORG LOG ORG LOG
ED 4576 4690 4984 5156 4799 4823
AD 4907 5031 5264 5528 5107 5252
CD 4330 4467 4806 4910 4658 4752
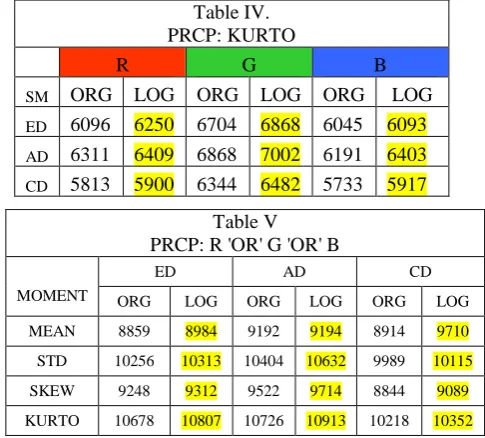
Table IV. PRCP: KURTO
R G B
SM ORG LOG ORG LOG ORG LOG ED 6096 6250 6704 6868 6045 6093 AD 6311 6409 6868 7002 6191 6403 CD 5813 5900 6344 6482 5733 5917
Each of the tables I to V contain the PRCP results with respect to each of three similarity measures, ED, AD and CD, and each color R, G and B.
Results obtained for bins approach based on original histogram and LOG function based modified histograms are shown separately as ORG and LOG columns in all tables. We can observe in above tables that LOG function is performing far better as compared to ORG histogram based results in almost all cases (i.e 34 out of 36). Better results obtained are highlighted with yellow color.
We have further improved these results by applying OR operation over the results obtained separately for R, G and B colors. Results after OR operation are shown in Table V. Each value in the
table is total PRCP for 200
queries i.e out of 20,000. Noticeable
improvement is achieved in the PRCP results shown in table V in all cases. Best results are given by Kurtosis for LOG function. We can observe that LOG function is far better in all the cases as compared to the results of ORG histogram based features.One more observation in these results we found is
‘Even’ (STD, KURTO) moments are performing far better as compared to ‘Odd’ (MEAN,SKEW) moments.
C. Longest String: Results and Discussion
We have executed all 200 queries to obtain the ‘Longest string’ parameter. As we have executed 10 queries from
each class for each color separately we have selected only one maximum LS from these 10 queries for three color results. This way we could also analyze the performance of the R, G and B color components in the feature vector by seeing that whichever LS is selected as Max LS is belongs to which of the three color results. We found that for ORG histogram based results; red and green are dominating over blue. For LOG function we found green and blue are dominating over red. Results shown in following Chart 1 along with the table is giving the average value of 10 max LS from 20 classes in database for each moment with respect to each similarity measure.
Table V PRCP: R 'OR' G 'OR' B
MOMENT
ED AD CD
ORG LOG ORG LOG ORG LOG
MEAN 8859 8984 9192 9194 8914 9710
STD 10256 10313 10404 10632 9989 10115
SKEW 9248 9312 9522 9714 8844 9089
Chart 1: LS for ORG and LOG function with respect to all other Parameters
ORG LOG ORG LOG ORG LOG
ED AD CD
MEAN 19 21 19 22 17 21 STD 16 16 17 17 14 15
SKEW 12 12 12 13 11 12 KURTO 16 17 18 20 15 17
0 5 10 15 20 25
A
v
e
ra
ge
L
S
f
ro
m
2
0
q
u
ri
es
o
u
t
of
1
0
0
AVG LONGEST STRING
In above chart we can observe that LOG function is performing better as compared to ORG histogram based bins as feature vector. Best average value for LS is 22 . LSRR: Length of String to Retrieve all Relevant
As defined earlier this parameter gives us the strength of the system and time to recall all images relevant to query from the large size database. We have taken % LSRR to be traversed to collect all query relevant images from database.
We are expecting it to be as low as possible. Following chart 2 shows the average % LSRR for 20 queries i.e one minimum from each class from three color results (As in case of LS).
In following chart 2, we can see that the best value obtained is 51% as average LSRR for ORG and LOG function for CD and AD measures respectively.
The maximum LSRR length we traversed is 73% as average of 20 different queries. It suggests that minimum 51 % and maximum 73 % traversal gives 100% recall for the given query as average for 20 classes. Indicates the quite good performance for the satisfaction of CBIR users.
Chart 2: LSRR for ORG and LOG function with respect to all other Parameters
ORG LOG ORG LOG ORG LOG
ED AD CD
MEAN 6 3 6 3 6 0 6 1 7 3 7 3
STD 5 8 6 0 5 4 5 7 5 4 5 7
SKEW 6 1 6 4 6 0 6 2 6 5 6 4
KURTO 5 3 5 3 5 2 5 1 5 1 5 2
0 1 0 2 0 3 0 4 0 5 0 6 0 7 0 8 0
A
v
e
ra
g
e
o
f
2
0
c
la
ss
e
s
%
L
S
R
R
Average % LSRR
V. C
ONCLUSIONCBIR system implemented in this work with the novel idea for feature extraction based on LOG function. We have proved the improvement in the retrieval results of CBIR using LOG function as histogram specification. It brings positive change in the representation of the image contents.
When we compared the results obtained using ORG histogram based image features with LOG modification; We found that LOG is performing far better in all evaluation parameters.
As we are using the bins approach for feature extraction it greatly reduces the size of the feature vector and computational complexity and saves the execution time too.
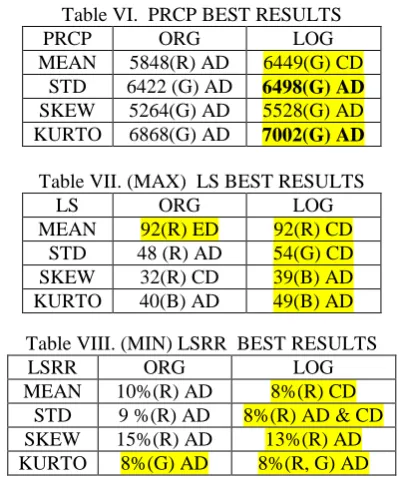
The best results obtained for all moments for all the performance evaluation parameters are given in the following tables.
In all the following tables we can observe that the best values among the given results are highlighted with yellow color. The noticeable difference can be seen that LOG function is performing far better as compared to ORG histogram based results in all the above cases. Best average PRCP value obtained is 0.55 for KURTO with LOG function and AD measure. Best LS is 92 out 100 images in the database for class Barbie for both ORG and LOG function with ED and CD measures respectively. Best LSRR obtained is 8% for LOG and ORG for Mean and kurtosis moments.
Performance evaluation of the color content of image tells us that red and green are better as compared to blue color results.
Table VI. PRCP BEST RESULTS
PRCP ORG LOG
MEAN 5848(R) AD 6449(G) CD
STD 6422 (G) AD 6498(G) AD
SKEW 5264(G) AD 5528(G) AD
KURTO 6868(G) AD 7002(G) AD
Table VII. (MAX) LS BEST RESULTS
LS ORG LOG
MEAN 92(R) ED 92(R) CD
STD 48 (R) AD 54(G) CD
SKEW 32(R) CD 39(B) AD
KURTO 40(B) AD 49(B) AD
Table VIII. (MIN) LSRR BEST RESULTS
LSRR ORG LOG
MEAN 10%(R) AD 8%(R) CD
STD 9 %(R) AD 8%(R) AD & CD
SKEW 15%(R) AD 13%(R) AD
KURTO 8%(G) AD 8%(R, G) AD
R
EFERENCES[1] Yong Rui and Thomas S. Huang , Shih-Fu Chang “Image
Retrieval: Current Techniques, Promising Directions, and Open
Issues”, 1047-3203/99 $30.00 Copyright C° 1999 by Academic Press (AP).
[2] Fei Ye, Zhiping Shi, Zhongzhi Shi, “A Comparative Study of PCA, LDA and Kernel LDA for Image Classification”
International Symposium on Ubiquitous Virtual Reality, 978-0-7695-3704-7/09 $25.00 © 2009 IEEE, DOI 10.1109.
[3] P.V. N. REDDY, K. SATYA PRASAD, “Content Based Image Retrieval Using Local Derivative Patterns”, Journal of
Theoretical and Applied Information Technology, 30th June 2011. Vol. 28 No.2, Publication of Little Lion Scientific R&D, Islamabad PAKISTAN
[4] Xiang Sean Zhou, Thomas Huang “CBIR:From Low-Level Features to High-Level Semantics”
http://www.ifp.uiuc.edu/~xzhou2.
[5] Raimonodo Schettini, G. Ciocca, Silvia Zuffi, “Content-Based
Image Retrieval at the End of the Early Years” Institute of
Tecnology, Infomatiche Multimediali - In Color Imaging Science: Exploiting Digital , 2001.
[6] SHI Dongcheng, XU Lan, HAN Ungyan, “Image retrieval using
both color and texture features”, The Journal of China
Universities Of Posts And Telecommunications Volume 14, Supplement, October 2007.
[7] P. S. Hiremath , Jagadeesh Pujari, “Content Based Image Retrieval using Color, Texture and Shape features.” 15th International Conference on Advanced Computing and Communications, 0-7695-3059-1/07 $25.00 © 2007 IEEE DOI 10.1109/ADCOM.2007.2.
[8] H.B.Kekre, Tanuja K. Sarode, Sudeep D. Thepade, “Image
Retrieval using Color-Texture Features from DCT on VQ Codevectors obtained by Kekre’s Fast Codebook Generation”,
ICGST-GVIP Journal, Volume 9, Issue 5, September 2009, ISSN: 1687-398X
[9] Gerald Schaefer,“Content-Based Image Retrieval – Some
Basics” www
-staff.lboro.ac.uk/~cogs/publications/icmmi11a.pdf.
[10] Brian V. Funt and Graham D. Finlayson, “Color Constant Color Indexing” IEEE Transactions On Pattern Analysis And Machine
Intelligence, VOL. 17, NO. 5, MAY 1995 523.
[11] Markus Stricker and Alexander Dimai, “Color Indexing with Weak Spatial Constraints”, SPIE conference, Feb. 96, San Jose. [12] Hidenori Yamamoto, Hidehiko Iwasa, Naokazu Yokoya,
“Content-Based Similarity Retrieval of Images Based on Spatial
Color Distributions” ICIAP '99 Proceedings of the 10th
International Conference on Image Analysis and Processing Page 951
IEEE Computer Society Washington, DC, USA ©1999 [13] Esin Guldogan Book Title : “Improving Content Based Image
Indexing And Retrieval Performance” Tampere university of
technology. 2008.
[14] Qasim Iqbal and J. K. Aggarwal “Cires: A System for Content -Based Retrieval In Digital Image Libraries” Seventh
International Conference on Control, Automation Robotics and
Vision ICARCV’02, DEC 2002.
[15] Shengjiu Wang, “A Robust CBIR Approach Using Local Color Histograms”, Technical Report TR 01-13 October 2001. [16] Rajshree Dubey, Rajnish Choubey, Sanjeev Dubey, “Efficient
Image Mining using Multi Feature Content Based Image
Retrieval System”, Int Jr of Advanced Computer Engineering
and Architecture Vol. 1, No. 1, June 2011.Copyright , Mind Reader Publications
[17] Maofu Liu Yanxiang He Huijun Hu Dandan Yu, “Dimension Reduction Based on Rough Set in Image Mining”, Proceedings
of the Fourth International Conference on Computer and
Information Technology (CIT’04) 0-7695-2216-5/04 $20.00 © 2004 IEEE
[18] Zhiyun Xue, Sameer Antani, L. Rodney Long, “Investigating
CBIR Techniques for Cervicographic Images”, AMIA 2007
Symposium Proceedings Page–826.
[19] H. B. Kekre and Kavita Sonawane, “Bin pixel Count, Mean and
Total of intensities extracted from partitioned equalized
histogram for CBIR”, International Journal of Engineering
Science and Technology (IJEST), ISSN : 0975-5462 Vol. 4 No.03 March 2012.
[20] H. B. Kekre and Kavita Sonawane, “Histogram Specification
with Higher Order Polynomial Functions over R, G and B Planes
for CBIR Using Bins”, International Journal of Advanced
Research in Computer Science, 3 (4), July–August, 2012. 330-340.
[21] H. B. Kekre and Kavita Sonawane, “Bins approach to image
retrieval using statistical parameters based on histogram
partitioning of R, G, B planes”, International Journal of
Advances in Engineering & Technology, Jan 2012 [22] Wang Database: http://wang.ist.psu.edu/docs/related/
A
UTHOR’
SP
ROFILEDr. H. B. Kekre
has received B.E. (Hons.) in Telecomm. Engg. from Jabalpur University in 1958,M.Tech (Industrial Electronics) from IIT Bombay in 1960, M.S. Engg. (Electrical Engg.) from University of Ottawa in 1965 and Ph.D. (System Identification) from IIT Bombay in 1970. He has worked Over 35 years as Faculty of Electrical Engineering and then HOD Computer Science and Engg. at IIT Bombay. For last 13 years worked as a Professor in Department of Computer Engg. at Thadomal Shahani Engineering College, Mumbai. He is currently Senior Professor working with Mukesh
Patel School of Technology Management and Engineering, SVKM’s
NMIMS University, Vile Parle(w), Mumbai, INDIA. He has guided 17 Ph.D.s, 150 M.E./M.Tech Projects and several B.E./B.Tech Projects. His areas of interest are Digital Signal processing, Image Processing and Computer Networks. He has more than 450 papers in National / International Conferences / Journals to his credit. Recently twelve students working under his guidance have received best paper awards. Five of his students have been awarded Ph. D. of NMIMS University. Currently he is guiding eight Ph.D. students. He is member of ISTE and IETE.
Ms. Kavita V. Sonawane
has received M.E (Computer Engineering) degree from Mumbai University in 2008. Pursuing Ph.D. from Mukesh Patel School of Technology,
Management and Engg, SVKM’s NMIMS