DOI: 10.7324/JAPS.2018.8120 ISSN 2231-3354
© 2018 Jéssica Brandão Reolon et al.. This is an open access article distributed under the terms of the Creative Commons Attribution License -NonCommercial-Shar-eAlikeUnported License (http://creativecommons.org/licenses/by-nc-sa/3.0/).
*Corresponding Author
Letícia Marques Colomé; BR472, Km592, Uruguaiana, RS, Brazil, CEP 97501-570. E-mail: leticiacolome @ unipampa.edu.br
Development and validation of high-performance liquid
chromatography method for simultaneous determination of acyclovir
and curcumin in polymeric microparticles
Jéssica Brandão Reolon1
, Maicon Brustolin1
, Sandra Elisa Haas1
, Eduardo André Bender1
, Marcelo Donadel Malesuik1 , Letícia Marques Colomé1*
1
Programa de Pós-graduação em Ciências Farmacêuticas, Universidade Federal do Pampa – UNIPAMPA, Uruguaiana, RS, Brasil.
ARTICLE INFO ABSTRACT
Article history: Received on: 21/11/2017 Accepted on: 08/01/2018 Available online: 28/01/2018
This study aimed to develop and validate a HPLC based analytical methodology for simultaneous determination of acyclovir and curcumin within microparticles. Chromatographic separation was achieved by employing a Fenomenex C18 column as stationary phase and a ternary mixture of acetonitrile, 0.1% phosphoric acid, and methanol (50:40:10) as the mobile phase. The validated method proved to be linear in the range of 0.5-30 µg.mL−1 and 0.5-20 µg.mL−1 for acyclovir and curcumin, respectively. Detection and quantification limits for acyclovir were, respectively, 83.62 ng.mL−1 and 109.52 ng.mL−1, while for curcumin the values were 91.61 ng.mL−1 and 128.71 ng.mL−1, what assures the methodology sensitivity. The method was also precise (1.2% RSD for acyclovir and 1.38% RSD for curcumin), besides showing recovery rates close to 100% for both of two drugs when accuracy was accessed. Minor alterations over chromatographic setup have confirmed methodology robustness. The present methodology proved to be capable of detecting and quantifying acyclovir and curcumin at polymeric microparticles in a single run, showing itself as an analytical alternative to be employed in the quality control for this dosage form.
Key words:
HPLC method validation, acyclovir, curcumin, micro-particles.
INTRODUCTION
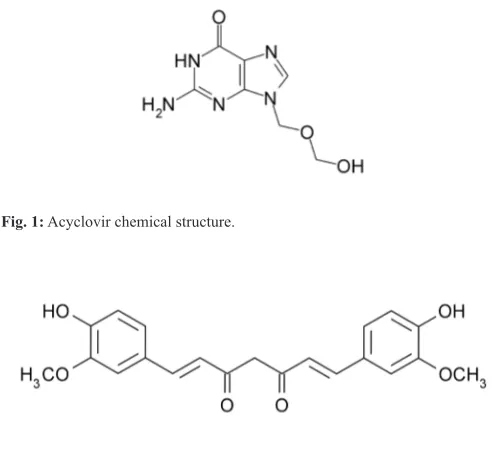
Acyclovir (9-[2-Hydroxy-ethoxy-methyl]guanine) (ACV) (Fig. 1) was discovered in 1977 and, at that time, it was seen as the beginning of a new age for infection treatment caused by herpes simplex family viruses (Field and Vere Hodge, 2013). Among the available therapeutic options for palliative treatment of human herpes simplex caused infections. ACV is the drug of first choice, once it has great efficiency and safety against in heal-ing both HSV-1 and 2 caused lesions (Gandhi et al., 2014).
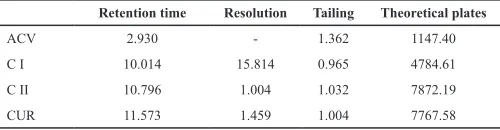
Curcumin (1,7-bis[4-Hydroxy-3-methoxyphenyl]-1, 6-heptadiene-3,5-dione) (CUR) (Fig. 2) is a natural compound extracted from Curcuma Longa L. rhizome, which has showed numerous therapeutic properties, among them are antiparkinson, antineoplastic, inflammatory, antioxidant, antibacterial,
anti-fungal, and antiviral (Joshi, 2010; Zandi et al., 2010; Yallapu et
al., 2012; Mandal, 2017).
In view of CUR potential antiviral activity against herpes family virus (Zandi et al., 2010), and the increasing occurrence of viral resistance mechanisms, it may be benefi-cial to associate different antiviral drugs. As an example of the aforementioned, ACV associated with CUR can potentialize their antiviral activity.
However, these two drugs have limitations in their use. When orally administered, ACV presents several limitations, such as low solubility in water, short half-life, and a high rate of renal excretion. Those features compromise ACV bioavailability, which is around 15-30% (Stulzer et al., 2008; Saxena, 2011). Sim-ilarly, CUR has low water solubility, compromising its oral usage
(Moorthi, 2013b; Tung, 2017).
with great success in obtaining controlled-release systems, improving solubility and stability of different molecules (Shahani
and Panyam, 2011; Martins, 2013; Gandhi et al., 2014).
Fig. 1: Acyclovir chemical structure.
Fig. 2: Curcumin chemical structure.
Aiming the active ingredient determination in different pharmaceutical dosage forms, numerous analytical methodolo-gies are proposed. Many of these methods are based on high-ef-ficiency liquid chromatography (HPLC). HPLC-PDA based methodologies are already described for ACV and its impurities determination (Tzanavaras and Themelis, 2007), as well as ACV determination in urine, plasm, amniotic fluid, fetal and placental tissues (Land and Bye, 1981; Brown et al., 2002; Fernandez et al., 2003). Besides that, quantification methods were developed for ACV determination in tablets (Ghosh et al., 2012) and micropar-ticulate drug delivery systems (Stulzer et al., 2008).
Similarly to ACV, CUR also has many determination methods already described in the literature, where some of them aim to simultaneously measure CUR and others curcuminoids employing HPLC based techniques (Jayaprakasha et al., 2002;
Wichitnithad et al., 2009). Moorthi and co-workers (Moorthi,
2013b; Moorthi, 2013a) have developed analytical methodologies
to simultaneous determination of CUR, quercetin, and piperine, all of them coencapsulated as a nanoparticulate drug delivery system. Additionally, pharmacokinetic evaluation was also con-ducted by determining CUR orally administered as liposomes to rats (Li et al., 2009).
Although the existence of numerous studies that devel-oped and validated determination methods for those drugs, there is not one that is capable to determine both of them in a single run. Thus, this study main objective was to develop and validate a HPLC-based analytical method to simultaneously determine ACV and CUR in polymeric microparticles, following the official guidelines from The International Conference on Harmonisation of Technical Requirements for Registration of Pharmaceuticals for Human Use (ICH, 2005).
MATERIALS AND METHODS
Chemicals
ACV (98.32% purity) was obtained from Pharma Nostra (Brasil). CUR (65% purity) was obtained from Sigma (Brasil). Hydroxypropyl methylcellulose E-4000 (HPMC E4000®) was obtained from Galena (Brasil). Ammonium methacrylate copoly-mer (Eudragit RS100®) was obtained from Evonik Röhm (Brasil). Manitol was obtained from Gemini (Brazil). Acetonitrile (ACN) and methanol (MeOH) were HPLC grade.
Equipments and chromatographic conditions
High-efficient liquid chromatograph Proeminence® (Shi-madzu) was employed for all analysis. This HPLC is equipped with a quaternary pump, automatic sampler, photo-diode array detector (PDA) and the LC software v. 1.22 SP1. Separation was obtained in a C18 reversed-phase column (Phenomenex®, 4.6 × 150 mm, 5 µm) by making use of an ACN:H3PO4 0.1%:MeOH mobile phase (50:40:10 v/v/v proportion) at a flow rate of 0.8 mL.min.−1. Injection volume was 20 µL and column temperature was 35ºC. Both two drugs were detected at 254 nm.
ACV/CUR-loaded microparticles preparation
The microparticles (MP) were prepared by Spray Drying technique, utilizing Büchi® B-290 Mini Spray Dryer. ACV, CUR and Eudragit RS100® were dissolved in 5 mL of ethanol. A pre-viously prepared and stocked solution (4ºC, 48 h) containing HPMC E4000® (45 mL) was poured over that ethanolic solution. Finally, mannitol was added and the mixture was homogenized under agitation for 10 min, and in an ultrasonic bath for additional 20 min. The resultant mixture was nebulized under the following conditions: 3 mL.mL−1 flow rate, temperature of 100ºC, 40 kgf.m−2 drawing flow, and 1.2 mm width atomizer needle. The theoretical load of drugs in the obtained microparticles was 32.8 mg/g and 5.4 mg/g of ACV and CUR, respectively. To obtain a placebo, we prepared drug-free MP, which were prepared in the same way as the drug-filled MP and are called MP-Br.
Standard solutions and samples preparation
ACV stock solution (400 µg.mL−1) was prepared by dis-solving 10 mg of it with a binary mixture of DMSO and ACN (20:80 v/v) in a 25 mL volumetric flask. CUR stock solution (200 µg.mL−1) was prepared by dissolving 10 mg of it with ACN in a 50 mL volumetric flask. All samples were placed in an ultrasonic bath for 30 min, aiming complete drug dissolution. Before all analysis, they were filtered in a 45 µm membrane.
Sample preparation was conducted by dissolving 35 mg of MP (equivalent to 1.148 mg and 0.189 mg of ACV and CUR, respectively) in a binary mixture of DMSO and ACN (20:80 v/v) in a 50 mL volumetric flask. Aiming for complete drug extraction from MPs, the samples were homogenized in an ultrasonic bath for 60 min.
Analytical methodology validation
Analytical methodology validation was conducted according to ICH (The International Conference on Harmon-isation of Technical Requirements for Registration of Phar-maceuticals for Human Use). The following parameters were evaluated: specificity, linearity, detection limit (LOD), quanti-fication limit (LOQ), precision, accuracy and robustness.
Specificity
Methodology specificity was determined by evaluat-ing excipients interference in ACV and CUR determination. In order to achieve that, a comparative analysis between MP-Br (drug free) and MP (drug filled) was conducted. The chromato-grams of both two groups were compared to verify if there was excipient interference over drug quantification.
Linearity
Linearity was evaluated by constructing of three dif-ferent calibration curves, with six points each (0.5, 1, 5, 10, 20, and 30 µg.mL−1 for ACV, and 0.5, 1, 5, 10, 15, and 20 µg.mL−1 for CUR). Equation of the line was determined by linear regression. The linearity was evaluated by linear sion analysis, which was calculated by the least square regres-sion method. Three calibrations curves were obtained with six concentrations each for ACV (0.5, 1, 5, 10, 20, and 30 μg.mL−1) and CUR (0.5, 1, 5, 10, 15, and 20 μg.mL−1).
LOD and LOQ determination
Limits were calculated by signal-to-noise ratio by comparing both two measurements in ACV, CUR and a drug-free group. LOD was considered as a 3:1 signal-to-noise ratio, while LOQ was considered as a 10:1 signal-to-noise ratio. All analyses were conducted at least five times. RSD was calcu-lated between all ACV and CUR determinations.
Precision
Repeatability was determined by analyzing six dif-ferent MP samples filled with ACV and CUR, all of them in the same day (Day 1, n = 6). Intermediate precision was ana-lyzed repeating the previous procedure in three different days (n = 12, where: Day 1, n = 6; Day 2, n = 3; Day 3, n = 3). Data are expressed as a function of the relative standard deviation (RSD%) of a series of measurements.
Accuracy
Accuracy was evaluated by known drug concentra-tions recovering in a MP-Br sample. Samples of CUR and ACV standard solutions were added to MP-Br in order to obtain 5, 10, and 20 µg.mL−1 of ACV and 5, 10, and 15 µg.mL−1 of CUR. All samples were prepared as triplicates. Recovery percentage was evaluated.
Robustness
Methodology robustness was evaluated by means of minor and deliberated alterations of chromatographical conditions. The following parameters were altered: mobile phase (ACN:H3PO4 0.1%:MeOH) proportion (52.5:37.5:10
or 47.5:42.5:10), flow rate (0.7 or 0.9 mL.min−1) and column temperature (33 or 37ºC). Robustness confirmation was evalu-ated in terms of the RSD value obtained from determination at each condition when compared to the original setup.
RESULTS AND DISCUSSION
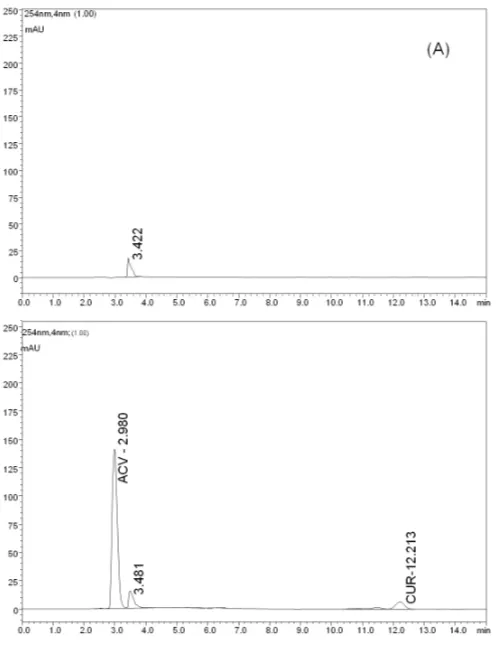
During the development of the analytical method, it has been tested different mobile phases to choose the most suit-able chromatographic condition for ACV and CUR simultaneous determination. Initial tests were conducted with a binary mixture of ACN:H3PO4 0.1% (55:45), following previously related condi-tions (Moorthi, 2013b). However, those conditions resulted in a short retention time for ACV (1.94 min), being necessary to eval-uate other mobile phase components proportion (40:60, 45:55, and 60:40). Nevertheless, the alterations that have been made did not resulted in a greater retention time for ACV neither in a proper resolution between CUR and other curcuminoids (bisdesmethoxy-curcumin (CI) and demethoxy(bisdesmethoxy-curcumin (CII)) (CUR 65% purity). Posteriorly, new assays were conducted based in another study (Jayaprakasha et al., 2002). In this step, the mobile phase was a ternary mixture of ACN:H3PO4 0.1%:MeOH in differ-ent proportions (40:40:20, 50:30:20, and 50:40:10). Consider-ing retention times for ACV (2.93 min) and CUR (11.57 min), and peaks resolution, it was choose as the most suitable mobile phase the mixture ACN:H3PO4 0.1%:MeOH (50:40:10). Although these chromatographic conditions have not demonstrated suitable results for all of the parameters (Table 1), the obtained results were very similar to those in a previous study about simultaneous quan-tification (Simon, 2012; Moorthi, 2013b; Moorthi, 2013a). Table 1: System suitability endpoints obtained by using the selected chromato-graphic conditions.
Retention time Resolution Tailing Theoretical plates
ACV 2.930 - 1.362 1147.40
C I 10.014 15.814 0.965 4784.61
C II 10.796 1.004 1.032 7872.19
CUR 11.573 1.459 1.004 7767.58
ACV: acyclovir; CUR: curcumin; CI: curcuminoid I; CII: curcuminoid II.
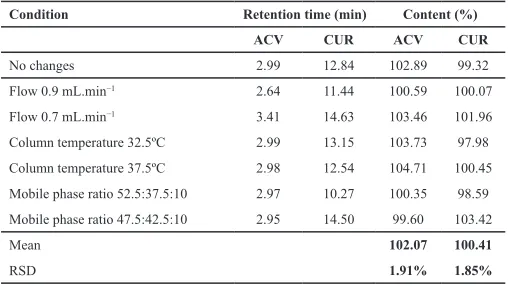
The PDA detectors allow analysis of one or more sub-stances at different wavelengths, as well as verification of the chro-matographic peak purity. The purity of interest peaks in this work were 0.9998 and 0.9999 for ACV and CUR, respectively. These results indicate an adequate chromatographic separation between the drugs and most interferents. Figure 3 shows the obtained chro-matogram at the selected conditions.
Specificity
Fig. 3: Typical chromatogram obtained by utilizing the selected experimental conditions.
Fig. 4: Chromatogram obtained from a MP-Br sample (A) and from a sample containing ACV and CUR MPs (B).
Linearity
The linearity of the methodology was evaluated by plot-ting calibration curves for both the two drugs. The method showed to be linear in the range of 0.5 to 30 µg.mL−1 for ACV and from 0.5 to 20 µg.mL−1 for CUR. Linearity coefficient was 0.9998 for ACV and 0.9999 for CUR, what asserts that the equipment response is indeed proportional to the drugs concentrations in the samples
(ICH, 2005). The validity of the assays was verified by means of
ANOVA, which demonstrated significant linear regression and no
significant linearity deviation (Table 2).
Table 2: Results concerning methodology linearity and ANOVA analysis.
ACV CUR
Correlation coefficients 0.9998 0.9999
Line equations Y = 88644.5x – 21551.8 Y = 50042.2x – 5508.3 Linearity range 0.5 - 30 µg.mL−1 0.5 - 20 µg.mL−1
Linear regression* Fcalculated = 24700 > Fcritical =
4.96 Fcalculated = 19700 > F= 4.96 critical
Linearity deviation* Fcalculated = 0.71 < Fcritical = 3.33 Fcalculated = 0.40 < Fcritical = 3.33
*Statistical significance α = 0.05; ACV: acyclovir; CUR: curcumin.
Limit of detection (LOD) and quantification (LOQ)
To determine the methodology sensitivity, LOD and LOQ were assessed. LOD values were 83.62 ng.mL−1 ± 3.59% for ACV and 91.61 ng.mL−1 ± 3.44% for CUR. While LOQ values were 109.52 ng.mL−1 ± 1.16% for ACV and 128.71 ng.mL−1 ± 1.78%, demonstrating that the method is sensible enough to deter-mine ACV and CUR.
Precision
Repeatability and intermediate precision results are expressed as percentage of the drugs content, and also as RSD (Table 3). Repeatability assessment was conducted by analyzing six different samples at the same day, and the same experimental conditions. The RSD values were 0.98% for ACV and 1.41% for CUR. Intermediate precision was evaluated by a total amount of twelve analyzes for three consecutive days, where RSD values were 1.20% for ACV and 1.38% for CUR. Recovered content were about 96% and 97% for ACV and CUR, respectively, in all assays. All RSD values were lower than 2%, what is within the established limits, asserting the methodology precision (ICH,
2005).
Table 3: Content values for ACV and CUR, expressed as % and RSD, represent-ing repeatability and intermediate precision.
ACV CUR
Repeatability
Content (%) 95.81 97.32
RSD day 1 0.98 1.41
Content (%) 97.34 97.86
RSD day 2 1.35 0.80
Content (%) 95.93 96.33
RSD day 3 0.44 1.46
Intermediate precision
Content (%) 96.22 97.21
RSD intermediate 1.20 1.38
ACV: acyclovir; CUR: curcumin; RSD: relative standard deviation.
Accuracy
recovery percentage close to 100% and RSDs lower than 2%, asserting the methodology accuracy, according to the established standards (ICH, 2005).
Table 4: Percentage (%) content values and RSD for ACV and CUR recovery at the three evaluated concentrations, representing method accuracy.
ACV (%)* CUR (%)*
Low concentration 104.14 ± 1.37 103.30 ± 0.31 Middle concentration 103.29 ± 1.84 104.11 ± 1.19 High concentration 101.65 ± 1.35 101.84 ± 1.91 * Values expressed as mean ± RSD; ACV: acyclovir; CUR: curcumin; RSD: relative standard deviation.
Robustness
Deliberate and minor changes proposed to determine the methodology robustness revealed that, at the selected chro-matographic conditions, there was no hindrance affecting both two drugs determination. The values for determination following each condition and their RSD values are presented in Table 5. It can observed that was no significant alteration regarding reten-tion times and peak areas. Besides that, both two drugs content stood close to 100%, and their RSD values were lower than 2% for all tested conditions. These data suggest that the methodology is robust in terms of mobile phase components ratio, flow variations, and temperature changes.
Table 5: ACV and CUR content and their respective RSD values following each chromatographic condition variation.
Condition Retention time (min) Content (%)
ACV CUR ACV CUR
No changes 2.99 12.84 102.89 99.32
Flow 0.9 mL.min−1 2.64 11.44 100.59 100.07 Flow 0.7 mL.min−1 3.41 14.63 103.46 101.96 Column temperature 32.5ºC 2.99 13.15 103.73 97.98 Column temperature 37.5ºC 2.98 12.54 104.71 100.45 Mobile phase ratio 52.5:37.5:10 2.97 10.27 100.35 98.59 Mobile phase ratio 47.5:42.5:10 2.95 14.50 99.60 103.42
Mean 102.07 100.41
RSD 1.91% 1.85%
ACV: acyclovir; CUR: curcumin; RSD: relative standard deviation.
CONCLUSIONS
The developed HPLC methodology allowed simulta-neous, simple and fast ACV and CUR determination. The results demonstrated that the method is specific for ACV and CUR, besides being linear, precise, accurate, and robust when consider-ing the ICH determined standards, what allows it to be employed for these two drugs determination in complex carrier systems, such as polymeric microparticles.
ACKNOWLEDGMENTS
The authors thank CAPES (Brazil) for providing a master student fellowship.
REFERENCES
Brown SD, White CA, Chu CK, Bartlett MG. Determination of acyclovir in maternal plasma, amniotic fluid, fetal and placental tis-sues by high-performance liquid chromatography. J Chromatogr B An-alyt Technol Biomed Life Sci. 2002; 772:327-334.
Fernandez M, Sepulveda J, Aranguiz T, von Plessing C. Technique validation by liquid chromatography for the determination of acyclovir in plasma. J Chromatogr B Analyt Technol Biomed Life Sci. 2003; 791: 357-363.
Field HJ, Vere Hodge RA. Recent developments in anti-her-pesvirus drugs. Br Med Bull. 2013; 106: 213-249.
Gandhi A, Jana S, Sen KK. In-vitro release of acyclovir load-ed Eudragit RLPO((R)) nanoparticles for sustainload-ed drug delivery. Int J Biol Macromol. 2014; 67: 478-482.
Ghosh S, Sahu A, Kumar DS, Jena S, Harani A, Reddy TPK, Tanuja D. Method development and validation for acyclovir in tablet dosage form by RP-HPLC. J Pharm Res. 2012; 5: 785-1786.
International Conference of Harmonization—ICH. Harmo-nized Tripartite Guideline Validation on Analytical Procedures: Text and Methodology. In: Q2(R1). Genova, 2005; 8-13.
Jayaprakasha GK, Jagan Mohan Rao L, Sakariah KK. Im-proved HPLC method for the determination of curcumin, demethoxy-curcumin, and bisdemethoxycurcumin. J Agric Food Chem. 2002; 50: 3668-3672.
Joshi VA, Ahmed M G, Suresh S, kowti R. A Comparative Study: Solution Stability and Dissolution Behavior of Solid Disper-sions Curcumin. Indian J Nov Drug Del. 2010; 2: 88-95.
Land G, Bye A. Simple high-performance liquid chromato-graphic method for the analysis of 9-(2-hydroxyethoxymethyl)guanine (acyclovir) in human plasma and urine. J Chromatogr. 1981; 224: 51-58.
Li J, Jiang Y, Wen J, Fan G, Wu Y, Zhang C. A rapid and sim-ple HPLC method for the determination of curcumin in rat plasma: as-say development, validation and application to a pharmacokinetic study of curcumin liposome. Biomed Chromatogr. 2009; 23: 1201-1207.
Mandal SD, Mandal S, Patel J. Intranasal mucoadhesivemi-croemulsion for neuroprotective effect of curcuminin mptp induced Parkinson model. Braz J Pharm Sci. 2017; 53:e15223.
Martins RM, Pereira SV, Siqueira S, Salomão WF, Freitas LAP. Curcuminoid content and antioxidant activity in spray dried mi-croparticles containing turmeric extract. Food Res Int. 2013; 50: 657-663.
Moorthi C, Kumar CS, Mohan S, Krishnan K, Kathiresan K. Application of validated RP-HPLC-PDA method for the simultaneous estimation of curcumin and piperine in Eudragit E 100 nanoparticles. J Pharm Res. 2013a; 7: 224-229.
Moorthi C, Kathiresan K. Reversed phase high performance liquid chromatographic method for simultaneous estimation of curcum-in and quercetcurcum-in curcum-in pharmaceutical nanoformulation. Int J Pharm Pharm Sci. 2013b; 5: 622-625.
Saxena A, Tewari G, Saraf SA. Formulation and evaluation of mucoadhesive buccal patch of acyclovir utilizing inclusion phenom-enon. Braz J Pharm Sci. 2011; 47: 887-897.
Shahani K, Panyam J. Highly loaded, sustained-release mi-croparticles of curcumin for chemoprevention. J Pharm Sci. 2011; 100: 2599-2609.
Simon A. Desenvolvimento e validação de método analítico por CLAE para quantificação simultânea de dipropionato de betameta-sona e fosfato sódico de betametabetameta-sona em suspensão injetável. Quim Nova. 2012; 35: 593-600.
Stulzer HK, Tagliari MP, Murakami FS, Silva MA, Laranjei-ra MC. Development and validation of an RP-HPLC method to quanti-tate acyclovir in cross-linked chitosan microspheres produced by spray drying. J Chromatogr Sci. 2008; 46: 496-500.
Phy-tosome Curcumin against paracetamol-induced liver toxicity in mice. Braz J Pharm Sci. 2017; 53: 1-13.
Tzanavaras PD, Themelis DG. High-throughput HPLC assay of acyclovir and its major impurity guanine using a monolithic column and a flow gradient approach. J Pharm Biomed Anal. 2007; 43: 1526-1530.
Wichitnithad W, Jongaroonngamsang N, Pummangura S, Rojsitthisak P. A simple isocratic HPLC method for the simultaneous determination of curcuminoids in commercial turmeric extracts. Phyto-chem Anal. 2009; 20: 314-319.
Yallapu MM, Jaggi M, Chauhan SC. Curcumin nanoformu-lations: a future nanomedicine for cancer. Drug Discov Today. 2012;
17: 71-80.
Zandi K, Ramedani E, Mohammadi K, Tajbakhsh S, Deilami I, Rastian Z, Fouladvand M, Yousefi F, Farshadpour F. Evaluation of antiviral activities of curcumin derivatives against HSV-1 in Vero cell line. Nat Prod Commun. 2010; 5: 1935-1938.
How to cite this article:
Reolon JB, Brustolin M, Haas SE, Bender EA, Malesuik MD, Colomé LM. Development and validation of high-performance liquid chromatography method for simultaneous determination of acyclovir and curcumin in polymeric microparticles. J App