Medical Image Segmentation using Texture
Information
Phuong Thao Cao
aand Thi Hong Hoa Nguyen
ba Faculty of Construction Management, University of Transport and Communications, Hanoi, Vietnam Corresponding author email id :
b Faculty of Information Technology, University of Transport and Communications, Hanoi, Vietnam email id:
Date of publication (dd/mm/yyyy): 09/03/2019
Abstract – Medical image segmentation is an important step to extract an abnormalities regions such as tumor or lesion. This paper presents a segmentation method for medical image using texture information. The proposed method extracts the feature from gray level co-occurrence matrix. The filter then applied to extract area in the medical image that has specific matrix pattern. The method was tested on the MRI and CT images and the experiment results show the high accuracy of the method.
Keywords – Medical Image Segmentation, Texture Analysis, Gray-Level Co-Occurrence Matrix.
I.
I
NTRODUCTIONMedical image processing plays an important role in modern health care [1, 2]. Medical imaging refers to a number of techniques that can be used as non-invasive methods of looking inside the body. These techniques such as Computer Tomography (CT), Magnetic Resonance Imaging (MRI) and Ultrasound (US) are widely used for the diagnosis of anomalies like cyst, tumor. The use of medical imaging has enabled doctors to see inside a patient without having to cut them open. Medical imaging also helps doctors learn more about neurobiology and human behaviors.
The most important step of medical image processing is image segmentation. Image segmentation is the process of partitioning an image into multiple segments. The goal of segmentation is to change the representation of an image into something that is more meaningful and easier to analyze. However, medical image segmentation has to face several main problems [3]. Firstly, the medical image may contain noise that can affect the intensity of a pixel such that its classification becomes uncertain. Secondly, the intensity of the images is non-uniformity where the intensity level of a tissue class varies gradually over the extent of the image. Third, the images have finite pixel size are subject to partial volume averaging where individual pixel volumes contain a mixture of tissue classes so that the intensity of a pixel in the image may not be consistent with any single tissue class.
therefore, texture-based analysis is extensively used in analysis of medical images [6, 9, 10]. This paper presents the method of medical image segmentation based on color and texture analysis. The features are extracted from gray level co-occurrence matrix and then filter applied to extract regions of interest from medical image.
The rest of the paper is organized as follow: in section II, the description of texture information method is presented. The experiment results are given in section III and finally section IV concludes the paper.
II.
M
ETHODA
. Texture Analysis
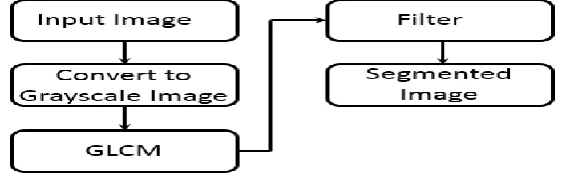
Texture is considers as a function of the variation of pixel intensities which form repeated patterns and it is important property of digital images [11]. This properties can be used in several research including statistical and signal processing [12]. Statistical method measures the spatial distribution of the pixels using features extracted from first and second order histogram [11, 12]. There are two popular statistical methods, they are gray-level difference [13] and co-occurrence matrix [14]. These two methods got high accuracy when applied to the synthetic images but their performance is low when applied to the natural images unless these images are defined by uniform texture [11]. This paper adapt gray level co-occurrence matrix to extract the feature and use filter to segment the medical image. The segmentation diagram is illustrated in figure 1.
Fig. 1. Diagram for texture image segmentation.
B
. Gray-level Co-occurrence Matrix
Gray-level co-occurrence matrix (GLCM) is a statistical method of examining the texture that considers the spatial relationship of pixels in the image. The GLCM characterizes the texture of an image by calculating how often pairs of pixel with specific values and in a specified spatial relationship occur in an image. Then we create a GLCM, and then extracting statistical measures from this matrix.
Consider I is a gray scale image, the GLCM is defined by a square matrix G of order N, where N is the number of gray level in the image. The ( , )i j thentry of G represents the number of occurrences the pixel with value i
become adjacent to a pixel with value j [15, 16]. This matrix G will be normalized by dividing each element by the total number of co-occurrence pair in G. The adjacency can be defined to take place in each of the four directions (00, 450, 900, 1350). The Haralick texture features are calculated for each of these directions of adjacency [16, 17]. The texture features are calculated by averaging over the four directional co-occurrence matrices. Mathematically, the GLCM can be defined as:
1 1
1 if ( , ) and ( , ) 0
M M
x y
x y
I x y i I x y j
G otherwise
Each element of GLCM is the number of times that two pixels with gray tone I and j are adjacent in distance d and direction
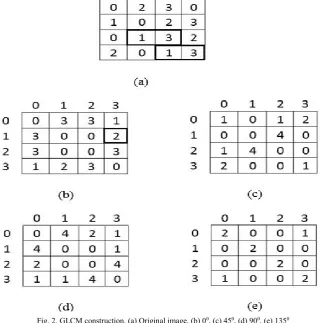
. Figure 2 illustrates the process to generate the co-occurrence matrix for the offsets (00-[0 1]; 450 -[-1 1], 900-[-1 0], 1350-[-1 -1]) that are defined as one neighboring pixel in four directions. For 00 direction co-occurrence matrix, the value is 2 (element (1, 3) in figure 2) because there are two neighborhood pixels (1, 3) of the input image. Also, the pixels (3, 1) will occur two times, which makes these matrices symmetric. Similarly, the three remained matrices are calculated [18].Fig. 2. GLCM construction. (a) Original image, (b) 00, (c) 450, (d) 900, (e) 1350
The filter is implemented to extract area that has specific matrix pattern by taking the standard deviation of the values of the input pixel’s 3-by-3 neighborhood.
III.
E
XPERIMENTR
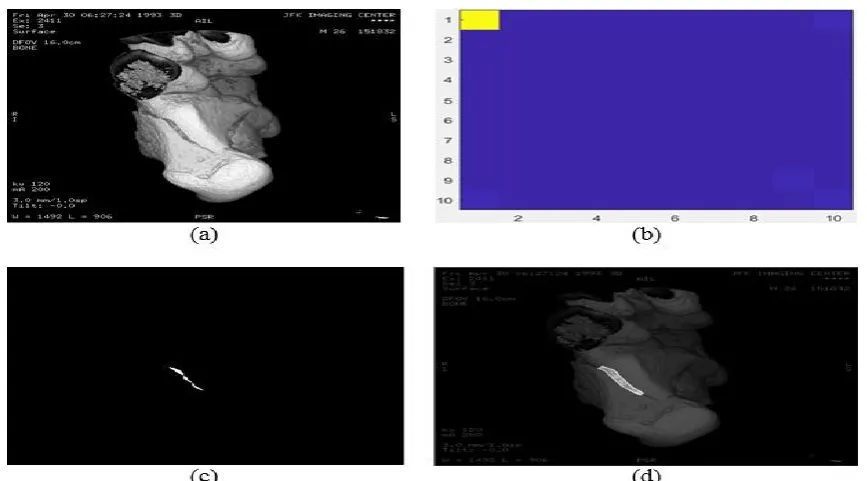
ESULTSFig. 3. Result on the MRI image. (a) original image, (b) GLCM, (c) binary mask, (d) segmented parts.
Although the medical image contain a lot of noise, some morphologically techniques are used to the binary mask to reduce such noise. The texture method can extract exactly the abnormal part in the brain image. We have compared the performance of this algorithm with the k-means algorithm.
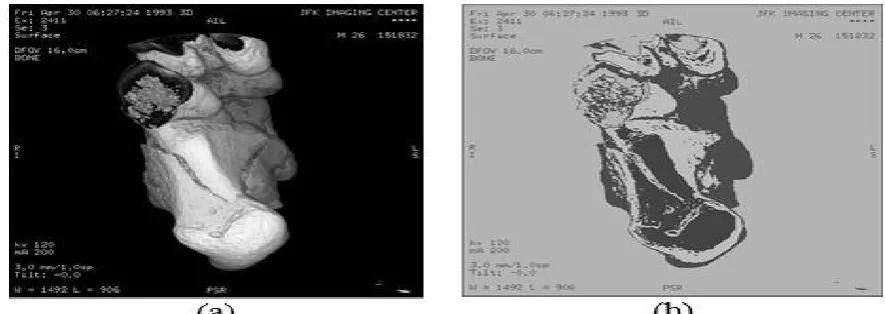
Fig. 4. Image segmentation by k-means algorithm. (a) original image, (b) segmented image
Figure 4 shows the result of image segmentation using k-means algorithm. Because the brain image has a lot of small areas with different intensity including noise and components of the brain, the k-means algorithm consider them as separated areas
In figure 5, the result of the segmentation of CT image is presented. The algorithm extract the stain in the image. There are several stains in the image, but the algorithm extract only stain in light area, which is stain of interest.
Figure 6 shows the result of the CT image segmentation using k-means algorithm. Because the CT image has several areas with different intensity and stain, the k-means algorithm segmented the image into several areas depend on the intensity.
Fig. 6. Figure 4. Image segmentation by k-means algorithm. (a) original image, (b) segmented image.
IV.
C
ONCLUSIONThis paper presented a segmentation method for medical image using texture information. The features was extracted from the gray level co-occurrence matrix. The method is no require the training process, so it makes the computation faster. A comparison between texture information and k-means method proved the accuracy and robustness of the texture method.
A
CKNOWLEDGMENTThis research was supported by the University project 2019 of University of Transport and Communications, Hanoi, Vietnam (T2019-CN-004)
R
EFERENCES[1] C. Kulikowski, E. Ammenwerth, A. Bohne. “Medical imaging informatics and medical informatics: Opportunities and constraints Findings from the IMIA Yearbook of Medical Informatics. Methods Inf Med. 2002; 41(2):183–9.
[2] J. S. Duncan, N. Aache, “Medical image analysis: Progress over two decades and the challenges ahead”. IEEE Trans on PAMI. 2000; 22:85–106.
[3] Sana'a khudayer Jadwa, "Texture Filter based Medical Images Segmentation for Cancer Disease", International Journal of Engineering Research and General Science Volume 3, Issue 5, September-October, 2015, pp. 85-90.
[4] Jim Duncan, Nicholas Ayache. Medical Image Analysis: Progress over two decades and the challenges ahead. IEEE Transactions on Pattern Analysis and Machine Intelligence, Institute of Electrical and Electronics Engineers, 2000, 22 (1), pp.85–106
[5] A. K. Jain, R. P. Duin, J. Mao, “Statistical pattern recognition: A review”, IEEE Trans PAMI. 2000; 22:4–37. [6] N. Sharma, L. M. Aggarwal, “Automated medical image segmentation techniques”, J Med Phys. 2010; 35(1):3-14.
[7] C. V. Kumar, G. Damyanti, R. Pant, C. M. Sreedhar, “Segmentation and grading of brain tumor an apparent diffusion coefficient image using self-organizing maps”, Comput Med Imaging Graphica. 2007; 31:473–84.
[8] S. Chaplot, L. M. Patnaik, N. Jagannathan, “Classification of magnetic resonance brain images using wavelets as input to support vector machine and neural network”, Biomed Signal Proc Control. 2006; 1: 86–92.
[9] J. Xie, Y. Jiang, H. T. Tsui, “Segmentation of kidney from ultrasound images based on texture and shape priors”, IEEE Trans Med Imaging. 2005; 24:45–57.
[10] N. Sharma, A. K. Ray, S. Sharma, K. K. Shukla, S. Pradhan, L. M. Aggarwal, “Segmentation and classification of medical images using texture-primitive features: Application of BAM-type artificial neural network”, J Med Physics. 2008; 33:119–26.
[11] P. F. Whelan and O. Ghita, "Colour Texture analysis". In: Mirmehdi, Majid, Xie, Xianghua and Suri, Jasjit, (eds.) Handbook of Texture Analysis. Imperial College Press, 2008.
[12] M. Tuceryan and A.K. Jain, “Texture analysis”, in The Handbook of Pattern Recognition and Computer Vision, C.H. Chen, L.F. Pau and P.S.P Wang (eds.) World Scientific Publishing, 1998.
[13] J.S. Wezska, C.R. Dyer, A. Rosenfeld, A comparative study of texture measures for terrain classification, IEEE Transactions on Systems, Man and Cybernetics, 6(4), pp. 269-285, 1976.
[14] R.M. Haralick, Statistical and structural approaches to texture, in Proc of IEEE, 67, pp. 786-804, 1979.
[15] R. Haralick, K. Shanmugam, and I. Dinstein, “Textural Features for Image Classification”, Trans. on Systems, IEEE Man and Cybernetics, SMC–3(6):610–621, 1973.
[17] F. I. Alam, R. U. Faruqui, “Optimized Calculations of Haralick Texture Features”, European Journal of Scientific Research, Vol. 50 No. 4, pp. 543-553, 2011.
[18] B. Pathak, D. Barooah, Texture Analysis Based on The Gray-Level Co-Occurrence Matrix Considering Possible Orientations", International Journal of Advanced Research in Electrical, Electronics and Instrumentation Engineering, Vol 2 (9), pp. 4206-4212, 2013.
A
UTHORSP
ROFILE’
Phuong Thao Cao received the BS and MS degree in Construction Economics from University of Transport and Communications, Vietnam in 2004 2013, respectively. She is the lecturer in the Faculty of Construction Management, University of Transport and Communications, Hanoi, Vietnam. Her research interest includes Artificial Intelligence and applied AI in Construction Management.