Mustafa T. Sener
1, A, D, Halis Suleyman
2, A, D, Ahmet Hacimuftuoglu
2, D,
Beyzagul Polat
2, B, E, F, Nihal Cetin
2, B, E, F, Bahadir Suleyman
2, B, Fatih Akcay
3, CEstimating the Postmortem Interval
by the Difference Between Oxidant/Antioxidant
Parameters in Liver Tissue
Określanie czasu zgonu za pomocą różnicy między wskaźnikami
oksydacyjnymi i antyoksydacyjnymi w tkance wątroby
1 Department of Forensic Medicine, Faculty of Medicine, Ataturk University, Erzurum, Turkey 2 Department of Pharmacology, Faculty of Medicine, Ataturk University, Erzurum, Turkey 3 Department of Biochemistry, Faculty of Medicine, Ataturk University, Erzurum, Turkey
A – research concept and design; B – collection and/or assembly of data; C – data analysis and interpretation;
D – writing the article; E – critical revision of the article; F – final approval of article; G – other
Abstract
Background. So far the authors could not find any published paper that shows the presence of a possibly significant relationship between oxidant/antioxidant parameters and time of death.
Objectives. This study sought to investigate whether the differences between the levels of endogenous param-eters like superoxide dismutase (SOD), malondialdehyde (MDA), glutathione peroxidase (GPx), glutathione S-transferases (GST), total glutathione (GSH), catalase (CAT) and nitric oxide (NO) have a relationship with the early postmortem interval (EPI).
Material and Methods. A total of 60 Albino Wistar male rats weighing between 220–230 grams were obtained. The rats were divided into six subgroups (n = 10), fed at room temperature (220C) and then decapitated. The livers of
the dead rats were extracted at intervals of one hour and biochemical examinations were performed and biochemi-cal results obtained from the animal groups had been evaluated.
Results. The authors performed linear regression analysis in order to search for factors predicting the time of death. The time of death was taken as a dependent variable with SOD, MDA, GPx, GST, GSH, CAT, and NO as independent variables. This model resulted with a high predictive value (adjusted R square = 94.0%). SOD, GST and NO were found to be significant factors independently affecting the prediction of the death time.
Conclusions. In conclusion, the results obtained from the experiment showed that the oxidant and antioxidant parameters are important for estimating the EPI (Adv Clin Exp Med 2012, 21, 6, 727–733).
Key words: early postmortem interval, oxidants, antioxidants, liver, rats.
Streszczenie
Wprowadzenie. Dotychczas nie ukazała się publikacja, która opisywałaby potencjalnie znaczący związek między wskaźnikami oksydacyjnymi i antyoksydacyjnymi a czasem zgonu.
Cel pracy. Zbadanie, czy różnice między stężeniem wskaźników endogennych, takich jak dysmutaza ponadtlenko-wa (SOD), aldehyd malonowy (MDA), peroksydaza glutationoponadtlenko-wa (GPx), glutation S-transferazy (GST), całkowity glutation (tGSH), katalaza (CAT) i tlenek azotu (NO) mają związek z wczesnym czasem zgonu (EPI).
Materiał i metody. Do badań włączono 60 szczurów rasy Albino szczepu Wistar płci męskiej o masie ciała 220–230 g. Szczury podzielono na 6 podgrup (n = 10), karmiono w temperaturze pokojowej (22oC) i uśmiercono za pomocą
dekapitacji. Wątroby martwych szczurów ekstrahowano w odstępach godzinnych, przeprowadzono badanie bio-chemiczne i oceniono wyniki uzyskane w poszczególnych grupach zwierząt.
Wyniki. Przeprowadzono analizę regresji liniowej w celu znalezienia czynników, które pozwoliłyby przewidzieć czas zgonu. Czas zgonu przyjęto jako zmienną zależną, a SOD, MDA, GPx, GST, GSH, CAT i NO jako zmienne niezależne. Taki model miał dużą wartość prognostyczną (skorygowane R2 = 94,0%). SOD, GST i NO były
czynni-kami niezależnymi pozwalającymi na przewidywanie czasu zgonu.
Wnioski. Wyniki uzyskane w doświadczeniu wykazały, że wskaźniki oksydacyjne i antyoksydacyjne są przydatne do oceny wczesnego czasu zgonu (Adv Clin Exp Med 2012, 21, 6, 727–733).
Słowa kluczowe: wczesny czas zgonu, utleniacze, przeciwutleniacze, wątroba, szczury.
Adv Clin Exp Med 2012, 21, 6, 727–733
ISSN 1899–5276
ORIGINAl PAPERS
The questions the authors are attempting to an-swer deal with identifying the corpse, cause of death and estimation of the time since death in forensic autopsy; however, reliably determining the time of death is the primary task for forensic medicine [1]. An estimation of the time since death is com-monly inferred from the evaluation of physiological and physical postmortem changes, such as the dis-tribution and amount of rigor mortis, death stains, changes in body temperature, changes in potassium concentration of the vitreous humor, the degree of decay in the body, proliferation of bugs on the corpse and their developmental stages [2].
In fact, there are several internal factors: age of the deceased, gender, physical and pathologi-cal state; and external factors: air temperature, humidity, and bug and animal activity affect the postmortem process, rendering the determination of time of death more complicated [3, 4]. None-theless, it was emphasized that the time of death is impossible to determine by investigating post-mortem changes only, especially during periods of decaying process [5].
Indeed, several studies showed that there are many methods used to determine the time of death based on postmortem changes of biochemi-cal markers over time, such as biochemi-calcitonin, insulin in pancreatic beta cells; potassium and hypoxanthine in vitreous humor; and calmodulin-dependent kinase II and protein phosphatase 2A, myristoy-lated alanine-rich C-kinase substrate, calcineurin A, DNA and RNA degradation, DNA quantifi-cation in multiple tissues postmortem [4, 6–12]. However, all of these methods are still waiting for confirmation by other large studies, as no study has determined a significant relationship between the time of death and the oxidant/antioxidant pa-rameters; therefore, the authors have attempted to investigate this relationship.
Under physiological conditions, the tradeoff between the oxidant and antioxidant balance is in favor of antioxidants [13]. However, the bal-ance between oxidant and antioxidant after death (postmortem interval) is not clearly mentioned in literature. Furthermore, changes in oxidant and antioxidant parameters are evaluated as biochemi-cal disturbances after death, as it cannot be said that the oxidant/antioxidant balance is sufficiently controlled by the body, even though cells show lia-bility during the early hours of death. For this rea-son, the difference between oxidant and antioxi-dant parameter levels seems to be more significant than oxidant/antioxidant balance in determining the time since death.
The aim in this study is to investigate whether the differences between endogenous chemical pa-rameters in rat livers known to be oxidant and
antioxidant, such as superoxide dismutase (SOD), malondialdehyde (MDA), glutathione peroxidase (GPx), glutathione S-transferases (GST), total glu-tathione (GSH), catalase (CAT) and nitric oxide (NO) bear any relation in determining the early postmortem interval (EPI).
No study regarding whether a significant re-lationship exists between oxidant and antioxidant parameters and the early postmortem interval (EPI) has been found in a literature search.
Material and Methods
Animals
In this study, a total of 60 Albino Wistar male rats weighing between 220–230 grams were ob-tained from the medical experiment practice and research center in Ataturk University. Animal experiments were performed in accordance with national guidelines for the use and care of labora-tory animals and approved by the local animal care committee (Ethic No: 53/ 05.08.2011) of Ataturk University.
Procedure of the Experiment
The rats were divided into six subgroups (n = 10), fed at room temperature (220C) and thendecapitated. The livers of the dead animals were extracted at intervals of one hour (0–1, 1–2, 2–3, 3–4, 4–5, 5–6 hours intervals) and biochemical ex-aminations were performed. Biochemical results collected from the rats groups were evaluated after being compared to each other.
Biochemical Analyses
of Liver Tissue
Superoxide Dismutase Analysis
0.6 mM EDTA, 150 μM NBT, 0.4 M Na2CO3, 1 g/l
bovine serum albumin), 500 μl supernatant and 50 μl xanthine oxidase (167 U/l) was vortexed. Then it was incubated for 10 min. At the end of the reaction, formazan occurs. The absorbance of the purple-colored formazan was measured at 560 nm. As more of the enzyme exists, the least O2− radical that reacts with NBT occurs. SOD
ac-tivity is expressed as U/g protein.
Malondialdehyde Analysis
The concentrations of liver tissue lipid per-oxidation were determined by estimating malon-dialdehyde (MDA) using the thio barbituric acid test [15]. The rat liver tissue was promptly excised and rinsed with cold saline. The liver tissue was scraped, weighed, and homogenized in 10 ml of 100 g/l KCl. The homogenate (0.5 ml) was added to a solution containing 0.2 ml of 80 g/l sodium lauryl sulfate, 1.5 ml of 200 g/l acetic acid, 1.5 ml of 8 g/l 2-thiobarbiturate, and 0.3 ml distilled wa-ter. The mixture was incubated at 98°C for 1 h. Upon cooling, 5 ml of n-butanol: pyridine (15 : l) was added. The mixture was vortexed for 1 min and centrifuged for 30 min at 4000 rpm. The ab-sorbance of the supernatant was measured at 532 nm. The standard curve was obtained by using 1, 1, 3, 3-tetramethoxypropane. MDA levels are ex-pressed as μmol/g protein.
Glutathione Peroxidase Analysis
Glutathione peroxidase (GPx) activity was determined according to the method of lawrence and Burk [16]. The absorbance at 340 nm was re-corded for 5 min, and the activity was defined as the rate of NADPH oxidation. Results were ex-pressed as U/g protein.
Glutathione S-Transferases Analysis
The supernatant’s glutathione S-transferases (GST) activity was measured by using 1-chloro-2, 4-dinitrobenzene (CDNB) and GSH as described in Habig et al. [17]. Briefly, the enzyme activity was assayed spectrophotometrically at 340 nm in a 4 ml cuvette containing 0.1M PBS (pH 6.5), 30 mM glu-tathione, 30 mM 1-chloro-2,6-dinitrobenzene and tissue homogenate. Results were expressed as U/g protein.
Total Glutathione Analysis
The amount of (total glutathione) (GSH) in the liver tissue was measured according to the method described by Sedlak and lindsay [18]. The liver tissue was collected by scraping, weighed, and then homogenized in 2 ml 50 mM Tris-HCl buf-fer containing 20 mM EDTA and 0.2 mM sucrose,
pH 7.5. The homogenate was immediately precipi-tated with 0.1 ml of 25% trichloroacetic acid, and the precipitate was removed by centrifugation at 4200 rpm for 40 min at 4°C. The supernatant was used to determine GSH using 5,5’-dithiobis (2-ni-trobenzoic acid). The absorbance was measured at 412 nm using a spectrophotometer. The GSH levels in the liver tissue are expressed as nmol/g protein.
Catalase Analysis
Decomposition of H2O2 in the presence of
cat-alase (CAT) was measured at 240 nm [19]. CAT activity was defined as the amount of enzyme required to process 1 nanomole of H2O2 per min
at 26°C and pH 7.8. Results are expressed as U/g protein.
Nitric Oxide Analysis
Tissue nitric oxide (NO) levels were mea-sured as total nitrite + nitrate levels with the use of the Griess reagent as previously described [20]. The Griess reagent consists of sulfanilamide and N-(1-napthyl)-ethylenediamine. The method is based on a two-step process. The first step is the conversion of nitrate into nitrite using a nitrate reductase. The second step is the addition of the Griess reagent, which converts nitrite into a deep purple azo compound; photometric measure-ment of absorbance at 540 nm is due to the fact that this azo chromophore accurately determines nitrite concentration. NO levels were expressed as μmol/g protein.
The supernatant’s protein concentration was measured by the method of Bradford [21].
Statistical Methods
Results
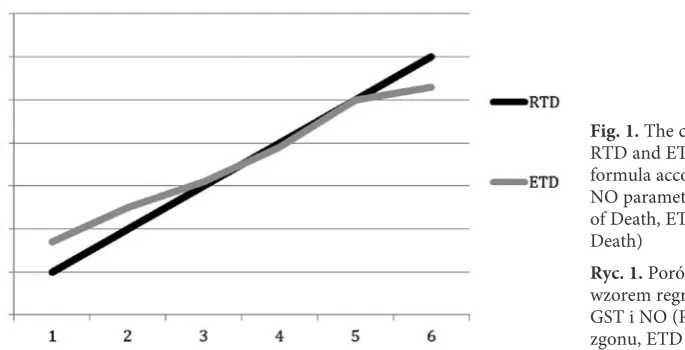
In Table 1, the levels of some oxidant and an-tioxidant parameters were shown in rat liver tissue in the EPI. The authors found a new formulation for the results for estimating the EPI. It was cal-culated using the linear regression formula given below, and the authors applied the linear regres-sion formula to the present cases, which resulted with a good ratio of prediction (Fig. 1). This mod-el resulted with a high predictive value (adjusted R square = 94.0%).
EPI = 3.7 – (0.089 × SOD) – (0.008 × GST) + + (0.052 × NO)
SOD, GST, CAT, GPx values were decreased after at 2nd hour of the EPI. MDA, NO values were
increased after at 3rd hour. Correlations between
oxidant and antioxidant variables were checked using Pearson’s correlation analysis. There were significant correlations between all variables (Ta-ble 2). SOD, GST and NO were found to be signifi-cant factors independently effecting prediction of the EPI (Table 3)
Discussion
This study depicted that the Chemical pa-rameters are known as oxidants and antioxidants
Table 1. The level of analyzed oxidants and antioxidants in rat liver tissue depending on the time of extraction. P was found
comparing the values from 1to 6hour after death in comparison with 0–1hour
Tabela 1. Stężenie analizowanych utleniaczy i przeciwutleniaczy w tkance wątroby szczurów w zależności od czasu ekstrakcji. P otrzymano przez porównanie wartości od 1 do 6 godzin po śmierci, w porównaniu z pierwszą godziną
Time of death – hours
(Czas zgonu – godziny)
SOD (U/g pro-tein)
MDA (μmol/g protein)
GPx (U/g pro-tein)
GST (U/g pro-tein)
GSH (nmol/g protein)
CAT (U/g pro-tein)
NO (μmol/g protein)
0–1 15 ± 3.8 7 ± 1.2 87 ± 0.8 136 ± 23 81 ± 16 48 ± 10 8 ± 1.8
1–2 13 ± 2 4 ± 0.14 38 ± 6.8 66 ± 15 107 ± 22 9 ± 0.8 9 ± 2
ns. ns. P < 0.05 P < 0.001 ns. P < 0.001 ns.
2–3 7 ± 051 10 ± 2.2 52 ± 7 75 ± 16 87 ± 9.8 15 ± 1.8 12 ± 1.2
P < 0.01 ns. P < 0.05 P < 0.01 ns. P < 0.01 ns.
3–4 6 ± 0.8 14 ± 4 31 ± 7 21 ± 5 23 ± 5.8 13 ± 2 22 ± 5
P < 0.01 P < 0.01 P < 0.01 P < 0.0001 P < 0.001 P < 0.001 P < 0.01
4–5 1.4 ± 0.2 11 ± 1.6 29 ± 5.5 29 ± 4.6 47 ± 10 12 ± 1.3 32 ± 3.6
P < 0.0001 ns. P < 0.001 P < 0.0001 P < 0.05 P < 0.001 P < 0.0001
5–6 1.2 ± 0.22 15 ± 2.3 33 ± 7.3 31 ± 9 25 ± 7.6 11 ± 1.8 38 ± 5.6
P < 0.0001 P < 0.01 P < 0.01 P < 0.0001 P < 0.001 P < 0.001 P < 0.0001
Fig. 1. The comparison between RTD and ETD with linear regression formula according to SOD, GST and NO parameters (RTD = Real Time of Death, ETD = Estimated Time of Death)
(SOD, MDA, GPx, GST, GSH, CAT and NO) play important role in determining the EPI. Under physiological conditions, the oxidant/antioxidant defense system in human body is in a state of con-tinuous equilibrium; namely, equilibrium in aero-bic metabolism (in alive tissue) is characterized by the formation of free radicals and their removal by means of antioxidant systems [13].
The oxidant/antioxidant equilibrium in in-jured tissue models produced in live animals is different. Increase in oxidant levels and a decrease in antioxidant levels are observed in the damaged tissues of any live animal [22, 23]. This event is a reaction induced against damage in a certain ar-ea of body [24]. Differences between biochemical parameters were observed, no matter how much viability the cells possessed in the early hours of death. Differences in postmortem period of
oxidant and antioxidants parameters must be as-sessed as biochemical disturbances, as it cannot be proposed that the oxidant/antioxidant equilib-rium be controlled sufficiently by the body, thus no matter how much viability the cells show in the early hours of death. Therefore, the sole balance between oxidant and antioxidant parameters does not suffice in determining the time of death.
In the present study, MDA amount, a lipid peroxidation product, in the 0–1 and 1–2 hours of the EPI was found to be lower than enzymatic and non-enzymatic antioxidant parameters like SOD, GPx, GST, GSH and CAT. It is seen in the present experiment that the oxidant/antioxidant balance in the 0–1 and 1–2 hours of death is in favor of antioxidants. Antioxidant superiority in the oxi-dant/antioxidant balance is still maintained under physiological conditions. The tradeoff between
ox-Table 2. Evaluation of Pearson’s correlation analysis relationship between oxidant and antioxidant variables
Tabela 2. Analizy korelacji Pearsona między zmiennymi oksydacyjnymi i antyoksydacyjnymi
SOD MDA GPx GST GSH CAT NO
SOD –0.547** 0.565** 0.566** 0.495** 0.468** –0.754**
MDA –0.547** –0.333* –0.505** –0.661** –0.24 0.624**
GPx 0.565** –0.333* 0.763** 0.402* 0.811** –0.538**
GST 0.566** –0.505** 0.763** 0.468** 0.777** –0.632**
GSH 0.495** –0.661** 0.402* 0.468** 0.21 –0.715**
CAT 0.468** –0.24 0.811** 0.777** 0.21 –0.407*
NO –0.754** 0.624** –0.538** –0.632** –0.715** –0.407*
*p < 0.05, **p < 0.01.
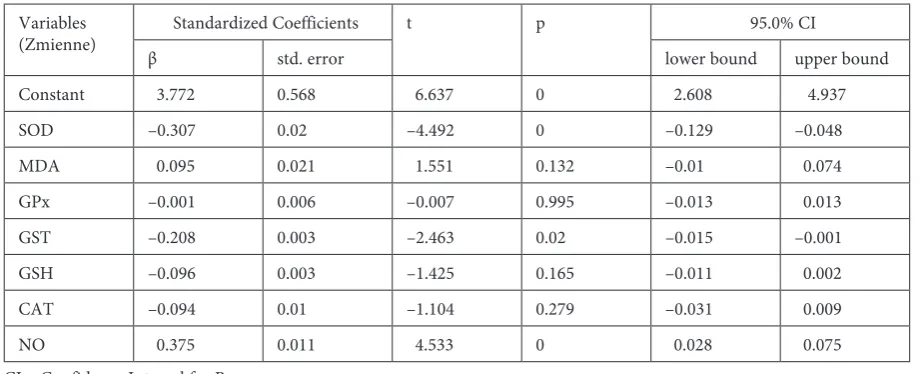
Table 3. Evaluation of linear regression analysis independent variables for predicting time of death
Tabela 3. Analizy liniowej regresji zmiennych niezależnych do przewidywania czasu zgonu
Variables
(Zmienne) Standardized Coefficients t p 95.0% CI
β std. error lower bound upper bound
Constant 3.772 0.568 6.637 0 2.608 4.937
SOD –0.307 0.02 –4.492 0 –0.129 –0.048
MDA 0.095 0.021 1.551 0.132 –0.01 0.074
GPx –0.001 0.006 –0.007 0.995 –0.013 0.013
GST –0.208 0.003 –2.463 0.02 –0.015 –0.001
GSH –0.096 0.003 –1.425 0.165 –0.011 0.002
CAT –0.094 0.01 –1.104 0.279 –0.031 0.009
NO 0.375 0.011 4.533 0 0.028 0.075
idants and antioxidants in favor of antioxidants in the 0–1 and 1–2 hours or probably death could be a continuing physiological reaction of the body.
Although SOD is found to be high in the (0–1 and 1–2 hours interval) hour of death, after this time SOD level was decreased. SOD protects cells from the toxic effects of superoxide radicals (O2–)
by exposing them to mutation [25]. The fact that SOD is high in the zero and first hour of death can lead one to think that an aerobic medium is sufficient for SOD to exert its antioxidant activity in these hours in the liver. While pancreatic and stomach mucosa face a more rapid enzymatic deg-radation by lytic enzymes, this event commences later in the liver [26]. Found to be higher in the 0–1 hour of death, GPx and GST activities showed a significant decrease at the end of the 1–2 hour of death. Contrary to GPx, the GSH level was significantly increased in the 1–2 hour of death. Decrease in GPx activity gives way to a decrease in total glutathione (GSH) and an increase in oxi-dized glutathione (GSSG). That is, the GSH/GSSG ratio decreases in oxidative damaging process [27]. However, an increase in GSH levels in the 1–2 hour of death might rely on the induction of ligase enzyme expression by 4-hydroxy-2-nonenal. In-vestigations have documented that 4-hydroxy-2-nonenal performs de novo synthesis of GSH from amino acids [28].
A moderately significant increase in the level of CAT observed in the 0–1 hour of death
disap-peared in the 1–2 hours. CAT catalyzes the reac-tion where hydrogen peroxide (H2O2) is
degra-dated to oxygen and water and has no effect on lipid peroxides [29]. NO levels in the 1–2 hours interval of death were nearly the same. It was in the 2–3 hour of death when NO levels commenced to show a significant increase.
The authors performed a linear regression analysis in order to search for factors predicting the EPI. Time of death was taken as dependent vari-able with SOD, MDA, GPx, GST, GSH, CAT, and NO as independent variables. This model resulted with a high predictive value (adjusted R square = 94.0%). SOD, GST and NO were found to be sig-nificant factors independently effecting prediction of the EPI (Table 3). The authors applied the lin-ear regression formula to the present cases, which resulted with a good ratio of prediction (Fig. 1). According to this formula SOD, GST and NO was significant informative in estimated the EPI.
In conclusion, the relationship between oxi-dant and antioxioxi-dant parameters is crucial in de-termining the EPI. This formulation can be helpful in detecting the EPI in forensic medicine. Post-mortem autolytic process is related to factors, such as the cause and manner of death, temperature, air humidity and environmental conditions are not examined in this study. These results are prelimi-nary, although significant results were found in this animal study. Therefore, further research on humans is needed.
References
[1] Henssge C, Madea B: Estimation of the time since death in the early post-mortem period. Forensic Sci Int 2004, 144, 167–175.
[2] Knight B, Knight BFp, Saukko PJ: Knight’s forensic pathology. Arnold, london 2004, 3thed., 76–97.
[3] Prieto-Castello MJ, Hernandez del Rincon JP, Perez-Sirvent C et al.: Application of biochemical and X-ray dif-fraction analyses to establish the postmortem interval. Forensic Sci Int 2007, 172, 112–118.
[4] Poloz YO, O’Day DH: Determining time of death: temperature-dependent postmortem changes in calcineurin A, MARCKS, CaMKII, and protein phosphatase 2A in mouse. Int J legal Med 2009, 123, 305–314.
[5] Aydn B, Colak B, Balc Y, Demirustu C: Consistency of postmortem interval estimations of physicians using only postmortem changes of putrefied dead bodies. Am J Forensic Med Pathol 2010, 31, 243–246.
[6] Lin X, Yin YS, Ji Q: Progress on DNA quantification in estimation of postmortem interval. Fa Yi Xue Za Zhi 2011, 27, 47–49.
[7] Zheng JL, Li XN, Zhang XD, Niu QS: DNA degradation in nucleolus of skeletal muscle, heart, liver, kidney and brain in mice after death. Fa Yi Xue Za Zhi 2010, 26, 161–164.
[8] Bauer M, Gramlich I, Polzin S, Patzelt D: Quantification of mRNA degradation as possible indicator of postmor-tem interval – a pilot study. leg Med (Tokyo) 2003, 5, 220–227.
[9] Fang C, Wang SC, Sun LM, Zhang XT, Long WQ, Jing HL: Concentration changes of potassium and hypoxan-thine in vitreous humor of swine and its application to postmortem interval estimation. Fa Yi Xue Za Zhi 2011, 27, 9–12.
[10] Tao T, Xu J, Luo TX, Liao ZG, Pan HF: Contents of vitreous humor of dead body with different postmortem intervals. Sichuan Da Xue Xue Bao Yi Xue Ban. 2006, 37, 898–900.
[11] Wehner F, Wehner HD, Schieffer MC, Subke J: Delimitation of the time of death by immunohistochemical detec-tion of insulin in pancreatic beta-cells. Forensic Sci Int 1999, 105, 161–169.
[12] Wehner F, Wehner HD, Subke J: Delimitation of the time of death by immunohistochemical detection of calci-tonin. Forensic Sci Int 2001, 122, 89–94.
[14] Sun Y, Oberley LW, Li Y: A simple method for clinical assay of superoxide dismutase. Clin Chem 1988, 34, 497–500.
[15] Ohkawa H, Ohishi N, Yagi K: Assay for lipid peroxides in animal tissues by thiobarbituric acid reaction. Anal Biochem 1979, 95, 351–358.
[16] Lawrence RA, Sunde RA, Schwartz GL, Hoekstra WG: Glutathione peroxidase activity in rat lens and other tis-sues in relation to dietary selenium intake. Exp Eye Res 1974, 18, 563–569.
[17] Habig WH, Pabst MJ, Jakoby WB: Glutathione S-transferases. The first enzymatic step in mercapturic acid for-mation. J Biol Chem 1974, 249, 7130–7139.
[18] Sedlak J, Lindsay RH: Estimation of total, protein-bound, and nonprotein sulfhydryl groups in tissue with Ellman’s reagent. Anal Biochem 1968, 25, 192–205.
[19] Aebi H: Catalase in vitro. Methods Enzymol 1984, 105,121–126.
[20] Moshage H, Kok B, Huizenga JR, Jansen PL: Nitrite and nitrate determinations in plasma: a critical evaluation. Clin Chem 1995, 41, 892–896.
[21] Bradford MM: A rapid and sensitive method for the quantitation of microgram quantities of protein utilizing the principle of protein-dye binding. Anal Biochem 1976, 72, 248–254.
[22] Iraz M, Ozerol E, Gulec M et al.: Protective effect of caffeic acid phenethyl ester (CAPE) administration on cisplatin-induced oxidative damage to liver in rat. Cell Biochem Funct 2006, 24, 357–361.
[23] Aguilar A, Alvarez-Vijande R, Capdevila S, Alcoberro J, Alcaraz A: Antioxidant patterns (superoxide dis-mutase, glutathione reductase, and glutathione peroxidase) in kidneys from non-heart-beating-donors: experi-mental study. Transplant Proc 2007, 39, 249–252.
[24] Cheeseman KH, Slater TF: An introduction to free radical biochemistry. Br Med Bull 1993, 49, 481–493.
[25] Fridovich I: Superoxide radical and superoxide dismutases. Annu Rev Biochem 1995, 64, 97–112.
[26] Scarpelli DG, Iannaccone PM: Cell death, autolysis and necrosis, In: Anderson’s pathology. Eds.: Kissane JM., Anderson WAD, MO: Mosbey, St. louis, 1990, 9th ed., 13.
[27] Melchiorri D, Sewerynek E, Reiter RJ, Ortiz GG, Poeggeler B, Nistico G: Suppressive effect of melatonin admin-istration on ethanol-induced gastroduodenal injury in rats in vivo. Br J Pharmacol 1997, 121, 264–270.
[28] Liu RM, Gao L, Choi J, Forman HJ: Gamma-glutamylcysteine synthetase: mRNA stabilization and independent subunit transcription by 4-hydroxy-2-nonenal. Am J Physiol 1998, 275, 861–869.
[29] Reilly PM. Schiller HJ, Bulkley GB: Pharmacologic approach to issue injury mediated by free radicals and other reactive oxygen metabolites. Am J Surg 1991, 161, 488–503.
Address for correspondence:
Halis Suleyman
Department of Pharmacology Ataturk University
Erzurum Turkey
Tel.: +90 442 231 65 58
E-mail: [email protected]
Conflict of interest: None declared