Available Online at www.ijpret.com
264
INTERNATIONAL JOURNAL OF PURE AND
APPLIED RESEARCH IN ENGINEERING AND
TECHNOLOGY
A PATH FOR HORIZING YOUR INNOVATIVE WORK
CRACK IMAGE ANALYSIS SYSTEM TO QUANTIFY CRACK PATTERN BY IMAGE
PROCESSING
KRUTIKA JAIN1, PROF ANJALI. B. RAUT2
1. ME Student, HVPM college of engineering and technology, Amravati University. 2. Head of Computer Science Department, HVPM College, Amravati University.
Accepted Date: 27/02/2014 ; Published Date: 01/05/2014
\
Abstract: Image processing Technology are proposed to quantify crack patterns .On the
basis of the technologies, a software “Crack Image Analysis System” (CIAS) has been developed . An image of soil crack network is used as an example to illustrate the image processing technologies and the operations of the CIAS. The quantification of the crack image involves the following three steps :image segmentation ,crack identification and measurement. First, the image is converted to a binary image using a cluster analysis method; noise in the binary image is removed; and crack spaces are fused. Then, the medial axis of the crack network is extracted from the binary image, with which nodes and crack segments can be identified. Finally, various geometric parameters of the crack network can be calculated automatically, such as node number, crack number, clod area, clod perimeter, crack area, width, length, and direction. The threshold used in the operations is specified by cluster analysis and other innovative methods. As a result, the objects (nodes, cracks and clods) in the crack network can be quantified automatically
Keywords: CIAS, Crack identification, Image segmentation, Spot removal, Crack restoration
Corresponding Author: MS. KRUTIKA JAIN
Access Online On:
www.ijpret.com
How to Cite This Article:
Krutika Jain, IJPRET, 2014; Volume 2 (9): 264-270
Available Online at www.ijpret.com
265
INTRODUCTION
Quantitative analysis of crack pattern is an important aspect of the study of cracking behavior of soil sand rocks. The shape, size, ruggedness, connectivity and branching of the crack patterns are not only associated with their historical stresses and strains, but also have implications for their futurest ability and functionality. Traditional manual characterization of the crack pattern is associated with low- accuracy, low-efficiency and artificial errors. In certain cases, the original crack pattern can be disturbed by human activities and equipment, which usually results in large measurement errors Advancement in the computer hardware and software capabilities has made image analysis a new and efficient tool that can be applied to process crack images. So far, with the aim to investigate the dynamics of crack formation, certain image processing technologies have been introduced to analyze the geometry of cracks. However, crack networks are complex systems, which involve crack segments, nodes, and the clods surrounded by the cracks. Current tools are only limited to the quantification of basic geometric parameters of cracks, such as crack direction crack shape fractal dimension etc. The advance in the research of cracking behaviors of materials requires a new tool to quantify crack networks and the geometry of all the objects in crack networks. In order to quantify the geometry of crack networks, software “Crack Image Analysis System” (CIAS) has been developed. By using this software, various geometric parameters can also be calculated automatically, such as node-and crack-numbers, clod area, clod perimeter, crack area, width, length, and direction.
IMAGE PROCESSING OF CRACK IMAGE
Preparation of Crack image
In order to illustrate the image processing technologies and the operations of the CIAS, an image of a laboratory soil crack was used as an example. A plate of soil slurry was placed in a dry-oven with constant temperature40 1C, and the final soil crack pattern is shown in Fig. 1a. Note that the figure represents the central part of the sample, an area which is120_120mm2 (1008_1008pixels) in size. The crack sand the background are distinguished according to their different gray levels. Therefore, the brightness of cracks and background should be quite different. The photos were taken in moderate light condition, and the direction of camera was perpendicular to the crack plane.
IMAGE SEGMENTATION
Available Online at www.ijpret.com
266
Fig1.(a)Original crack image and (b) gray-level histogram and cluster analysis are used to distinguish the crack sand clods. (c)Binary image with white and black spots, bottom right side shows a discontinuous crack, which can be repaired by crack restoration (Fig.2), and (d) the bridge between spots and real clods are eliminated using Closing, and spots are removed.
Can be determined using a cluster analysis method:(a) by using a given threshold T, the image can be divided into two pixel sets: the white pixels(W), of which the gray-level is greater than T, and the black pixels(K), which includes the remaining pixels. (b) Let GW and GK represent the average gray level of the pixel sets W and K, respectively. The new threshold is defined as the average of GW and GK. The average gray level of the image is used as the initial threshold. Then, repeat steps (a) and (b) until the threshold converges to a constant value, which is the optimal threshold. As shown in Fig.1b, the optimal threshold is between the two crests in the gray-level histogram, and as a result, the crack network is discriminated from the background automatically (Fig.1c). 2.3. Spot removal There are a large number of small spots in the binary image, such as white dots within the crack sand black spots over the clods (Fig. 1c). Isolated white regions (includes clods and spots) were identified using the Seed Filling algorithm.These dots and spots were then removed according to their different sizes). Since the black and white spots are much smaller than the crack sand the real clods, the spot threshold can also be specified using the cluster analysis method. The CIAS also provides the traditional Closing operation to reduce the noise (Fig. 1d).
CRACK NETWORK IDENTIFICATION
Clod identification and crack restoration
Available Online at www.ijpret.com
267
fine cracks may become discontinuous in the binary image (bottom-right side of Fig. 1c). As a result, two neighboring clods may connect with each other via the bridge between them. A clod division method is proposed to divide the clods and to repair the cracks. (1) First, a dilation operation is applied to the binary image to eliminate the narrow bridge between clods. In this way, the crack space is fused (Fig. 2a–b), since the diameter of the space is smaller than the diameter of the dilation structuring element B. (2) As the space (i.e. bridge)has been eliminated, the two isolated clods(S1 and S2 in Fig. 2c) can be identified using the Seed Filling algorithm.
Fig.2.Schematic diagram of clod division and crack restoration (a) two clods connect with each other via a crack space (see Fig. 1c). (b)The cracks A are dilated by a structuring element B, (c)Seed Filling is used to identify the two isolated regions, S1 and S2. (d–e) The white pixels are integrated to nearby seed clods using the Merging algorithm. (f) The crack is repaired along the interface between clods
Crack identification
Available Online at www.ijpret.com
268
from black to white. As shown in Fig. 3b, if N¼2, it is a normal medial axis pixel(P1); if N¼3, it is recognized as an intersection (I2); and If N¼1, the current pixel is an end node. (3) Track the pixel from a node along the medial axis until meeting another node; then, a crack medial axis is recorded. The remaining crack pixels can be integrated to a crack axis using the Merging algorithm
GEOMETRIC PARAMETERS AREA AND PERIMETER
The area and perimeter measurements are basically pixel counting and distance summation of boundary pixels, respectively. Since lines or curves are serrate at the micro scale, application of traditional methods (distancesummation) incorrectly predicts a greater perimeter. Therefore, an optimized method is used to calculate the perimeter, based on the principle of removing redundant boundary pixels. According to the deviation percentages of the traditional perimeters aregreaterthan5%, while the value using the improved new method is within0.2%.
Clod length, width and direction
Feret diameter was used to calculate the width, length and direction of the clod. The Feret diameter is defined as the orthogonal distance between a pair of the parallel tangents to the feature at a specified angle to the unit. The clod length and width are the maximum-and minimum Feret diameters where as the clod direction is defined as the direction of maximum Feret diameter.
Crack length, width and direction
Crack length is defined as the cumulative length of the crack medial axis pixels between two nodes, such as I1I2 of Fig. 3b. As shown in Fig. 3c, the crack width around a medial axis pixel (O) is defined as the summation of distance to two boundary pixels A and B, which are the closest pixels to the pixel O. The classic least square method is used to calculate the slope of the cracks according to the coordinates of the medial axis pixels. The crack slope can then be easily converted to the crack direction.
THE CIAS AND RESULTS
Available Online at www.ijpret.com
269
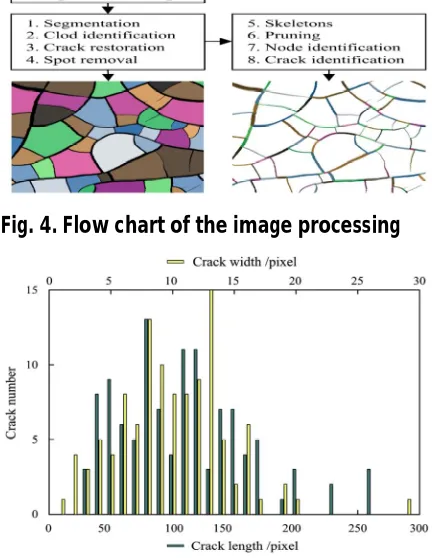
The crack length and widths distributions range from 29.7 to 261.4 and from 1.4 to 29.1 pixels, respectively (1pixel represents 0.119mm). Up to date, the CIAS have been used to study the fundamentals of soil cracks. Further, the software can also be used to quantify rock fractures.
Fig. 3. Schematic diagram of crack identification. (a)There is a parasitic branch in the skeletons of the crack, which can be cleaned up by Pruning, (b) medial axis of crack network is used to identify nodes(I1 and I2) and (c)Crack pixels are merged to the crack axes to identify crack segments
Fig. 4. Flow chart of the image processing
Available Online at www.ijpret.com
270
CONCLUSION
Crack indentification and Restoration are done by using seed feeling algorithm and crack dilation. The material presented in this paper is representative of spatial domain techniques commonly used in practice for image enhancement. This area of image processing is a dynamic field, and new techniques and applications are reported routinely in professional literature and in new product announcements. For this reason, the topics included in this paper were selected for their value as fundamental material that would serve as a foundation for understanding the state of the art in enhancement techniques, as well as for further study in this field.
REFERENCES
1. Olabarriaga SD, Smeulders AWM. Interaction in the Segmentation of medical images: a survey. Medical Image Analysis 2001;5:127–42.
2. LeJunS,HaoZ. Anew contour fill algorithm for outlined character image generation. Computer & Graph 1995;19:551–6.
3. Baer J.U.,Kent, T.F., Anderson, S.H., 2009. Image analysis and fractal geometry to characterize soiled siccation cracks. Geoderma 154(1–2),
4. Yu,W.W.,He,F.,Xi,P.,2010. A rapid 3D seed-filling algorithm based on scan slice. Computers and Graphics34 (4).
5. Gonzalez, R.C., Woods, R.E., 2002. Digital Image Processing. Prentice Hall, Up Saddle River, pp. 520–547.
6. G.J. Sive wright, P.J. Elliott, Interactive region and volume growing for segmenting volumes in MR and CT images, Med. Informat. 19 (1994) 71—80.
7. K.P. Fishkin, B.A. Barsky, A family of new algorithms for soft filling, Comput. Graph.
8. Dimensional seed filling in view lattice to accelerate volumetric rendering, Compute Graph.
9. S. Lejun, Z. Hao, A new contour fill algorithm for outlined character image generation, Comput. Graph.