R E S E A R C H
Open Access
Precise estimation of human corticospinal
excitability associated with the levels of
motor imagery-related EEG
desynchronization extracted by a locked-in
amplifier algorithm
Kensho Takahashi
1†, Kenji Kato
1,2,6†, Nobuaki Mizuguchi
1,3and Junichi Ushiba
1,4,5*Abstract
Background:Physical motor exercise aided by an electroencephalogram (EEG)-based brain-computer interface (BCI) is known to improve motor recovery in patients with stroke. In such a BCI paradigm, event-related desynchronization (ERD) in the alpha and beta bands extracted from EEG recorded over the primary sensorimotor area (SM1) is often used, since ERD has been suggested to be associated with an increase of corticospinal excitability. Recently, we demonstrated a novel online lock-in amplifier (LIA) algorithm to estimate the amplitude modulation of motor-related SM1 ERD. With this algorithm, the delay time, accuracy, and stability to estimate motor-related SM1 ERD were significantly improved compared with the conventional fast Fourier transformation (FFT) algorithm. These technical improvements to extract an ERD trace imply a potential advantage for a better trace of the excitatory status of the SM1 in a BCI context. Therefore, the aim of this study was to assess the precision of LIA-based ERD tracking for estimation of corticospinal excitability using a transcranial magnetic stimulation (TMS) paradigm.
Methods:The motor evoked potentials (MEPs) induced by single-pulse TMS over the primary motor cortex depending on the magnitudes of SM1 ERD (i.e., 35% and 70%) extracted by the online LIA or FFT algorithm were monitored during a motor imagery task of wrist extension in 17 healthy participants. Then, the peak-to-peak amplitudes of MEPs and their variabilities were assessed to investigate the precision of the algorithms.
Results:We found greater MEP amplitude evoked by single-pulse TMS triggered by motor imagery-related alpha SM1 ERD than at rest. This enhancement was associated with the magnitude of ERD in both FFT and LIA algorithms. Moreover, we found that the variabilities of peak-to-peak MEP amplitudes at 35% and 70% ERDs calculated by the novel online LIA algorithm were smaller than those extracted using the conventional FFT algorithm.
Conclusions:The present study demonstrated that the calculation of motor imagery-related SM1 ERDs using the novel online LIA algorithm led to a more precise estimation of corticospinal excitability than when the ordinary FFT-based algorithm was used.
Keywords:Brain-computer interface (BCI), Transcranial magnetic stimulation (TMS), Corticospinal excitability, Event-related desynchronization (ERD), Electroencephalogram (EEG), Sensorimotor cortex (SM1)
* Correspondence:[email protected]
†Kensho Takahashi and Kenji Kato contributed equally to this work. 1
Faculty of Science and Technology, Keio University, 3-14-1 Hiyoshi, Kohoku-ku, Yokohama, Kanagawa 223-8522, Japan
4Keio Institute of Pure and Applied Sciences (KiPAS), Keio University, 3-14-1
Hiyoshi, Kohoku-ku, Yokohama, Kanagawa 223-8522, Japan Full list of author information is available at the end of the article
Background
Physical motor exercise aided by an electroencephalo-gram (EEG)-based brain-computer interface (BCI) facili-tates functional recovery in patients with motor deficits due to stroke [1–12]. In such a BCI paradigm, event-re-lated desynchronization (ERD) in the alpha (8–13 Hz) and beta (15–30 Hz) bands is extracted from EEG sig-nals recorded over the primary sensorimotor area (SM1), and visual and sensory feedback contingent to the extent of ERD is provided via a motor-driven orth-osis or neuromuscular electrical stimulation. The repeti-tion of BCI-aided motor exercise in finger opening or arm reaching paradigms is suggested to help patients learn to activate sensorimotor cortical neurons more ef-ficiently than exercises without a BCI [9,13].
Previous studies using transcranial magnetic stimulation (TMS) delivered to the primary motor cortex have shown that an increase of corticospinal excitability is associated
with ERD [14] and is accompanied with a decrease of
GABAergic intracortical inhibition [15], indicating ERD as a biomarker of corticospinal excitability. However, the real-time estimation of ERD trace results has a time delay measured in hundreds of milliseconds. A variety of spec-tral analyses, such as fast Fourier transformation (FFT) [8,
10, 12, 16–20], continuous Wavelet transformation [21,
22], an autoregressive model [9,23,33], have been used to calculate the frequency spectrum in a given time-sliding window with certain overlaps, but the results were smoothed due to window overlapping, and were delayed due to window length, causing the inevitable limited reso-lution of ERD.
Recently, we successfully developed a novel online lock-in amplifier (LIA) algorithm to estimate the ampli-tude modulation of motor imagery-related alpha ERD over SM1 [24]. LIA can reliably extract signal amplitude in a defined frequency band using a point-by point multiplication and filtering algorithms. Using this algo-rithm, the delay time, accuracy, and stability to estimate motor-related SM1 ERD were significantly improved compared with those calculated by the conventional on-line FFT, continuous Wavelet transformation, and auto-regressive algorithms. These technical improvements to extract an ERD trace imply a potential advantage for a better trace of the excitatory status of SM1 in the con-text of a BCI.
Therefore, in this paper, we assessed the precision of LIA-based ERD tracking for estimation of corticospinal ex-citability using a TMS paradigm. We monitored the motor evoked potentials (MEPs) induced by single-pulse TMS over the primary motor cortex depending on the magni-tude of SM1 ERD (i.e., 35% and 70%) extracted by the novel online LIA and conventional FFT algorithms during a motor imagery task of wrist extension in healthy partici-pants. Then, we compared the peak-to-peak amplitudes of
MEPs and their variabilities triggered by the different mag-nitudes of ERD extracted by the novel LIA and conven-tional FFT algorithms to investigate their precision of corticospinal excitability.
Methods
Participants
Seventeen healthy participants (average age, 23.8 ± 2.8 years) participated in this study. All participants were right-handed, without any medical or psychological dis-orders according to self-reports. Informed consent was given by all participants after they received an explan-ation of the experimental procedure. The experimental protocol used in this study was in accordance with the Helsinki Declaration and was approved by the ethics committee of Keio University.
Data acquisition EEG recordings
EEG signals were recorded with 128-channel Geodesic Sensor Nets over the whole scalp. Electrode impedance
was kept lower than 40 kΩthroughout the experiments
[25]. The EEG signals were amplified and band-pass and notch filtered between 5 and 70 Hz by the Geodesic EEG System (Electrical Geodesics Incorporated [EGI], Oregon, USA) and then recorded at a sampling rate of 1000 Hz. The EEG signals were extracted using a large Laplacian filter centered on C3, which was defined as the nearest channel to the contralateral SM1 [24], since we recorded EEG sensorimotor responses during motor imagery tasks of right wrist extension (see Experimental
proceduresin the Methods section).
ERD estimation algorithms
First, we used an FFT algorithm as the conventional method to probe the motor-imagery-related ERDs [8,10,
12,15,19,20]. According to these previous studies, EEG data were processed using the following 4 steps: (1) seg-mentation of 1-s time windows with 99% overlap; (2) power spectrum density calculation by FFT algorithm with a Hanning window; (3) determination of a fre-quency of interest (FOI), which showed the most signifi-cant ERD over the alpha bands by visual inspection in
Screening session (see Experimental procedures in the
Methods section); and (4) ERD transformation [15]. The algorithm of the motor-related ERD was defined as follows:
ERDðf;tÞ ¼A fð ;tÞ−R fð Þ R fð Þ 100
where A is the power spectrum density (PSD) of the
which was most reactive frequency displaying ERD over the alpha band during the kinesthetic motor imagery task in the screening session.
Second, we used LIA-based algorithm as a novel esti-mation method [24]. According to the previously estab-lished algorithm with LIA [24], EEG data were processed using the following 4 steps: (1) determination of a FOI; (2) applying a narrow band-pass filter (FOI ± 1 Hz) using a second-order Butterworth band-pass filter with a 1-s time window; (3) LIA process (i.e. point-by-point multi-plication and integration of the input signal with a refer-ence trigonometric basis signal) with segmentation of 1/ FOI s with a 99% overlap time window; and (4) ERD transformation [15].
In briefly, the previous study suggested that the aver-aged time delays by the online LIA algorithm (200 ± 9.49 ms) were around 300 ms shorter than those by the online FFT algorithm (503 ± 18 ms) [24]. In addition, the accuracy and stability to detect amplitude modulation of motor-imagery-related ERDs by the online LIA algo-rithm were significantly higher than those calculated by the online FFT algorithm (p< 1.0*10–10, p < 1.0*10–9, respectively) [24].
Surface electromyography (EMG) recordings
Surface EMG activity was recorded with Ag/AgCl elec-trodes (fixed electrode distance: 20 mm) over the muscle belly of the right flexor carpi radialis and extensor carpi radialis (ECR) muscles. Impedance for all channels was
maintained below 20 kΩthrough the experiments. EMG
signals were band-pass filtered (5–1000 Hz with 2nd
order Butterworth) with a notch (50 Hz to avoid power line contamination), and digitized at 2 kHz using a bio-signal amplifier (Neuropack MEB-9200; Nihon Koh-den, Tokyo, Japan). The pre-stimulus EMG activity and MEP were analyzed using−50 to 150 ms periods of each pulse in an offline process.
TMS protocol
Single-pulse TMS was applied with a double-cone coil (outer diameter of each coil: 11 cm, angle of each coil: 95°) connected to a Magstim 200 magnetic stimulator (Magstim, Whitland, UK). The optimal coil position was determined where the motor evoked potential (MEP) amplitude in the ECR was observed with the lowest stimulus intensity and marked with the Brainsight TMS navigation system (Rogue Research, Cardiff, UK). The optimal coil orientation and location remained constant throughout the session. The resting motor threshold (rMT) intensity was defined as the lowest stimulator output intensity capable of inducing an MEP with at least 50 μV peak-to-peak amplitude in relaxed muscles in at least half of the 10 trials [26,27]. TMS in all experi-ments was applied with an intensity of 120% of the
individual rMT. The values of rMT in each participant
are shown in Table 1. We inspected the EMG data
dur-ing offline analysis, discarddur-ing any trials containdur-ing
pre-stimulus EMG activities more than ±20 μV. Less
than 5% of all trials were rejected due to contamination.
Experimental procedures Screening session
Firstly, a screening session was performed to investigate the most reactive frequency associated with the motor imagery-related SM1 ERD in each participant. The par-ticipants sat in a comfortable armchair and performed kinesthetic motor imagery of right wrist extension with a fixed repetitive time scheme (Fig.1Aa). A 20-in.
com-puter monitor was placed 60–90 cm in front of their
eyes. Then, the screening session started with the pres-entation of the word“Rest”at the center of the monitor. After 5 s, the word displayed in the monitor changed to
“Image,” and the participant was asked to perform
kinesthetic motor imagery of wrist extension for 5 s. Then, the monitor went black and the participant could move freely for 3 s. This overall process was repeated for a total of 25 trials.
TMS sessions
Each participant performed a total of 5 experimental conditions with TMS in a predetermined randomized order, which was counterbalanced across the partici-pants. In each condition, the rest period was randomized from 4 to 6 s to prevent the participants from predicting task onset in each trial. Then, TMS was applied to the SM1 at different timings over the 5-s task period de-pending on the following 5 conditions.
InCondition 1“Relaxed”, the participants were instructed
to be relaxed during the task phase instead of performing the motor imagery task, as a control session. TMS was ap-plied randomly during the task phase. The stimulus was applied 25 times.
In Condition 2“FFT, ERD35%” and Condition 3“FFT,
ERD70%”, the participants were instructed to perform
the kinesthetic motor imagery task of right wrist exten-sion during the task phase. TMS was applied immedi-ately after instantaneous ERDs calculated by the online
FFT algorithm reached 35% in Condition 2 or 70% in
Condition 3during the motor imagery task. The
partici-pants were asked to continue the kinesthetic motor im-agery task even after TMS was applied. We ended the session when the number of successful trials (i.e. ERD
values were reached to 35% in Condition 2 or 70% in
Condition 3) reached 25. In case of trials that the ERD
overlap used for the FFT algorithm were determined as 1000 ms and 90%, according to the previous study [15].
In Condition 4“LIA, ERD35%” and Condition 5 “LIA,
ERD70%,” the participants were instructed to perform
the same kinesthetic motor imagery task of right wrist extension during the task phase. TMS was applied im-mediately after instantaneous ERDs calculated by the
on-line LIA algorithm reached 35% in Condition 4 or 70%
in Condition 5 during the kinesthetic motor imagery
task. The participants were asked to continue the kinesthetic motor imagery task even after TMS was ap-plied. We ended the session when the number of suc-cessful trials (i.e. ERD values were reached to 35% in
Condition 4or 70% in Condition 5) reached 25. In case
of trials that the ERD could not be reached to the tar-geted values, it was not counted as the number of suc-cessful trials (i.e. TMS was not applied).
To reduce the participants’bias, the order of the con-ditions 2–5 were blinded for the participants.
Data analysis and statistics
After removing the trials in which the pre-stimulus
EMG activity was more than ±20 μV, the peak-to-peak
MEP amplitudes were calculated in each trial and TMS session. Then, the peak-to-peak MEP amplitudes at ERD 35% and ERD 70% (Conditions 2–5) were normalized by those at the resting condition (Condition 1). Finally, the
average and standard deviation (SD) of normalized peak-to-peak MEP amplitudes across trials in every con-dition and participant were calculated.
The average of normalized peak-to-peak MEP
ampli-tudes across participants was compared between
Condi-tion 1 and Conditions 2–5 using a t-test, followed with
Bonferroni correction. In addition, two-way repeated measures analysis of variance (ANOVA) was performed to compare normalized peak-to-peak amplitude between
the 4 TMS conditions (Conditions 2–5). The SD of
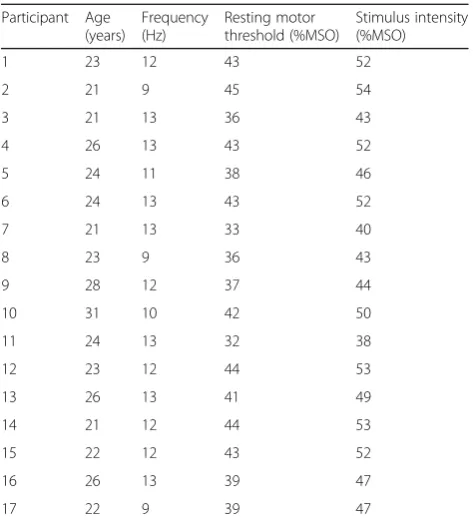
Table 1Most reactive frequency displaying ERD during the right wrist motor imagery task in the screening session, resting motor threshold, and stimulus intensity in each participant
Participant Age (years)
Frequency (Hz)
Resting motor threshold (%MSO)
Stimulus intensity (%MSO)
1 23 12 43 52
2 21 9 45 54
3 21 13 36 43
4 26 13 43 52
5 24 11 38 46
6 24 13 43 52
7 21 13 33 40
8 23 9 36 43
9 28 12 37 44
10 31 10 42 50
11 24 13 32 38
12 23 12 44 53
13 26 13 41 49
14 21 12 44 53
15 22 12 43 52
16 26 13 39 47
17 22 9 39 47
MSOmaximum stimulator output
normalized peak-to-peak amplitude was also compared
between the four TMS conditions (Conditions 2–5)
using two-way repeated measures ANOVA. If ANOVA yielded a significant F value, a post-hoc test was then performed using a t-test with Bonferroni correction.
Results
Motor imagery-related SM1 ERD
In the screening session, all participants showed signifi-cant task-related alpha ERDs around C3 during the kinesthetic motor imagery task of right wrist extension. The characteristics of the most reactive frequency of motor imagery-related SM1 ERDs are summarized in Table 1. The representative data (Subject 9) of topo-graphic maps of the averaged motor imagery-related SM1 ERDs over 25 trials obtained from 128-channel EEG signals over the most reactive frequency were fur-ther shown inConditions 1–5during rest (Fig.2Aa) and when the ERDs reached 35% and 70% calculated by the online FFT and LIA algorithms during the kinesthetic motor imagery task (Fig. 2Ab-e). Motor imagery-related
alpha ERD magnitudes occurred around C3 in
Condi-tions 2–5, suggesting that the observed alpha ERD was
likely to localize to the contralateral SM1. In addition, one-way ANOVA was performed to compare power values during the resting periods betweenConditions 2– 5. As a result, there was no significant difference in the resting-state power values over the most reactive fre-quency (F = 1.80,p= 0.158), indicating that the reference power values for calculating ERDs did not differ between
Conditions 2–5. The numbers of unsuccessful trial were
less than 4 trials for all conditions.
Changes in MEP amplitudes at the different levels of ERD magnitudes obtained by the LIA and FFT algorithms
To test corticospinal excitability at certain magnitudes of SM1 ERD during the right wrist kinesthetic motor im-agery task, we applied single-pulse TMS over the pri-mary motor cortex during the rest condition (Condition
1“Relaxed”) and during wrist kinesthetic motor imagery
at ERD 35% and 70% calculated by the conventional
on-line FFT algorithm (Condition 2 “FFT, ERD35%” and
Condition 3 “FFT, ERD70%”), and by the novel online
LIA algorithm (Condition 4 “LIA, ERD35%” and
Condi-tion 5 “LIA, ERD70%”). Then, we assessed the
peak-to-peak MEP amplitudes in each condition.
Representative waveforms of MEPs in the right ECR muscle during the relaxed (Condition 1) and kinesthetic motor imagery (Conditions 2–5) tasks in a single partici-pant (Subject 9) are shown in Fig. 2B. MEP amplitudes evoked by single-pulse TMS were facilitated during kinesthetic motor imagery (rest = 195.1 ± 106.1 μV, motor imagery at ERD 35% by FFT and LIA =353.3 ± 189.9 and 640.6 ± 163.0μV, and motor imagery at ERD 70% by FFT
and LIA = 638.8 ± 250.7 and 730.1 ± 144.1μV, respectively). The averaged peak-to-peak MEP amplitudes induced by single-pulse TMS from the ECR across participants were compared between each condition. As a result, the aver-aged MEP amplitudes were significantly greater in
Condi-tion 2 “FFT, ERD35%” (p< 0.001), Condition 3 “FFT,
ERD70%”(p< 0.05),Condition 4“LIA, ERD35%”(p< 0.05),
and Condition 5“LIA, ERD70%” (p< 0.001), compared to
Condition 1“Relaxed” (Additional file1: Figure S1),
indi-cating that corticospinal excitability was increased more when motor imagery-related alpha SM1 ERD occurred than during the resting state, irrespective of ERD magni-tude (i.e., 35% or 70%) and estimation algorithm (i.e., on-line LIA or FFT algorithm). On the other hand, there were no significant differences in the averaged MEP amplitudes
between Condition 2 “FFT, ERD35%” and Condition 4
“LIA, ERD35%”(p= 0.655), and betweenCondition 3“FFT,
ERD70%” and Condition 5 “LIA, ERD70%” (p= 0.661),
suggesting that the averaged MEP amplitudes did not in-fluence to estimation algorithms in each ERD magnitude.
Next, normalized peak-to-peak MEP amplitudes were compared between the four ERD-triggered TMS condi-tions (Conditions 2–5) with two-way ANOVA (Fig. 3), indicating the main effect of ERD values (F (1, 14) = 16.51,p< 0.01). A post-hoc test using a t-test with Bon-ferroni correction further suggested that the normalized
MEP amplitudes inCondition 3“FFT, ERD70%”showed
a significant increase compared to those in Condition 2
“FFT, ERD35%” (post hocp< 0.001). Similarly, the
nor-malized MEP amplitudes inCondition 5“LIA, ERD70%”
showed a significant increase compared to those in
Con-dition 4“LIA, ERD35%” (post hocp< 0.001), suggesting
that in both online estimation algorithms, SM1 excitabil-ity was significantly associated with the different levels of motor imagery-related alpha ERDs. On the other hand, there were no significant differences in the
nor-malized MEP amplitudes between Condition 2 “FFT,
ERD35%” and Condition 4 “LIA, ERD35%” (p= 0.922),
and betweenCondition 3“FFT, ERD70%”andCondition
5 “LIA, ERD70%” (p= 0.583), suggesting that the
nor-malized MEP amplitudes did not influence to estimation algorithms in each ERD magnitude.
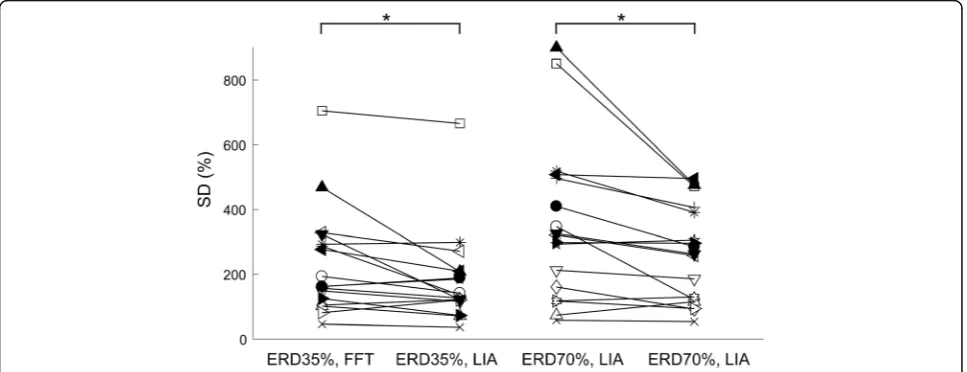
Changes in the variabilities of MEP amplitudes at different levels of ERD magnitudes obtained by the LIA and FFT algorithms
To investigate the estimation precision of instantaneous corticospinal excitability reflected by the MEP ampli-tudes induced by single-pulse TMS triggered by the level of motor imagery-related ERDs, we assessed the SD of normalized peak-to-peak MEP amplitudes at ERD 35% and ERD 70%, extracted by the conventional online FFT algorithm (Condition 2“FFT, ERD35%”and Condition 3
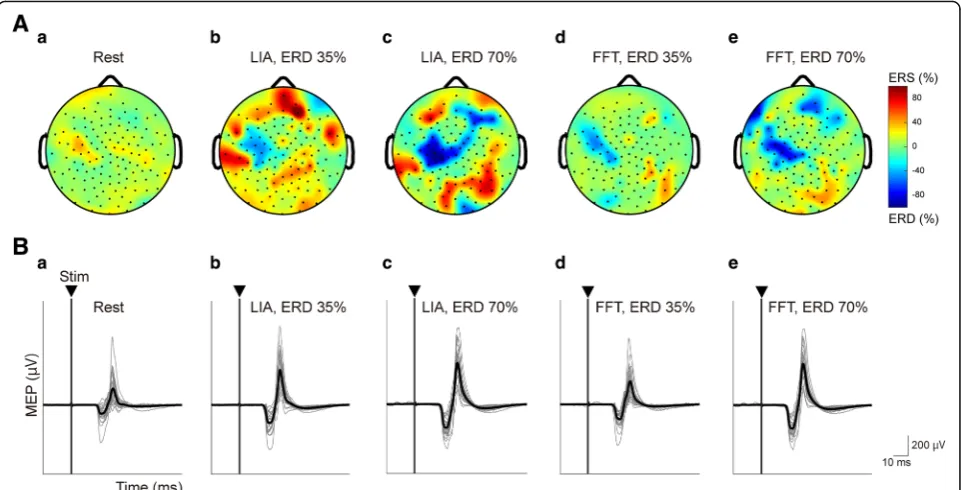
Fig. 2Representative topographic map and MEP traces induced by single-pulse TMS recorded from the right ECR at ERD 35% and ERD 70%, calculated by the online FFT or LIA algorithm.A: Representative topographies of the averaged ERDs over trials during the resting condition (a), wrist kinesthetic motor imagery at ERD 35% (b) and ERD 70% (c) calculated by the online FFT algorithm, and ERD 35% (d) and ERD 70% (e) calculated by the online LIA algorithm, obtained from 128-channel EEG data. Topographic maps are illustrated in the most reactive frequency displaying motor imagery-related ERD. Data were obtained from Subject 9. Electrode positions are shown by dots. Negative values (blue colors) indicate strong ERD.B: Example MEP traces induced by single-pulse TMS recorded from the ECR during the resting condition (a) and during kinesthetic motor imagery of right wrist extension at ERD 35% (b) and ERD 70% (c) calculated by the online FFT algorithm, and ERD 35% (d) and ERD 70% (e) calculated by the online LIA algorithm. Thin gray lines represent representative MEP traces across 25 trials. Thick black lines represent the averaged MEP traces. The triangles and vertical lines represent stimulus onset (Stim). As ERD increased, MEP amplitudes induced by single-pulse TMS were facilitated in both cases of ERD estimations based on the online FFT and LIA algorithms. ECR, extensor carpi radialis; ERD, event-related desynchronization; FFT, fast Fourier transformation; LIA; lock-in amplifier; MEP, motor evoked potential; TMS; transcranial magnetic stimulation. Data were obtained from Subject 9
“LIA, ERD35%” and Condition 5 “LIA, ERD70%”), and
compared them using two-way ANOVA (Fig.4). As a
re-sult, we found main effects of ERD magnitudes (i.e., ERD 35% and ERD 70%) [F (1, 14) = 6.81, p< 0.05] and algo-rithms (i.e., FFT and LIA algoalgo-rithms) [F (1, 14) = 5.17,p< 0.05]. Moreover, an interaction was found between both factors [F (1, 14) = 8.69,p< 0.05]. Post hoc tests with Bon-ferroni’s correction showed that the SD of normalized
peak-to-peak MEP amplitudes in Condition 4 “LIA,
ERD35%” was smaller than that in Condition 2 “FFT,
ERD35%”(p< 0.05, Fig.4). Similarly, the SD of normalized
peak-to-peak MEP amplitudes in Condition 5 “LIA,
ERD70%” was smaller than that in Condition 3 “FFT,
ERD70%”(p< 0.05, Fig.4). These results suggest that the
variabilities of MEP amplitudes at both levels of ERD mag-nitude (i.e., ERD 35% and ERD 70%) extracted by the novel online LIA algorithm were reduced compared to those extracted by the conventional FFT algorithm.
Discussion
In the present study, we found greater MEP amplitude evoked by single-pulse TMS triggered by motor imagery-related alpha SM1 ERDs than that randomly applied at rest. This enhancement was associated with the magni-tude of ERD (i.e., 35% and 70%) for both the FFT and LIA algorithms, which is consistent with a previous study [15]. Moreover, we found that the variabilities of peak-to-peak MEP amplitudes at the levels of ERD (i.e., 35% and 70%) calculated by the novel online LIA algorithm were re-duced compared to those extracted by the conventional FFT algorithm. Based on the previous findings that LIA-based algorithm can detect motor-related SM1 ERD
more accurately and stably than conventional FFT algo-rithm [24], the present results suggest that the accurate calculation of motor imagery-related SM1 ERDs extracted by the novel online LIA algorithm led to a precise estima-tion of human corticospinal excitability.
Extensive previous studies have consistently demon-strated that alpha/beta ERDs following kinesthetic motor imagery are a reliable biomarker for increased excitabil-ities in the sensorimotor cortex and corticospinal tract [28–31]. Previous TMS studies have shown an inverse correlation between MEP amplitude and alpha band power [32,33], and an inverse correlation between intra-cortical inhibition and the alpha ERD level during kinesthetic motor imagery [15]. Indeed, an additional analysis revealed that both algorithms detected targeted values of ERD over SM1 (Additional file1: Figure S2). In addition, the magnitude of motor imagery-related SM1 ERD during kinesthetic motor imagery was associated with an increase in F-wave persistence, indicating the potentiation of spinal motoneurons during kinesthetic
motor imagery accompanied with SM1 ERD [19]. The
present findings also reproduced the correlation be-tween the magnitude of motor imagery-related SM1 ERD and MEP amplitude. Moreover, we notably dem-onstrated the reduced variability of the results when the novel LIA algorithm was used compared to the FFT algorithm. This result suggests that motor imagery-re-lated SM1 ERDs extracted by the LIA algorithm would be a more reliable biomarker to represent increased excitabilities in sensorimotor cortex and corticospinal tract than when an ordinary FFT-based algorithm is used.
A finger movement exercise aided by an ipsilesional SM1 ERD-based BCI stimulates SM1 while attempting paralyzed finger movements, resulting in an improve-ment of impaired moveimprove-ments [13]. Therefore, the pre-cise estimation of the ERD trace by the newly proposed LIA algorithm and resulting improved correlation be-tween SM1 ERD and peak-to-peak MEP could be poten-tially more beneficial for neurorehabilitation than the existing algorithm. For instance, delayed visual feedback attenuates error-based sensorimotor learning during prism adaptation [34,35] and a gradual visuomotor rota-tion task [36]. Since BCI-mediated movement exercise is characterized by error-based learning through ERD state-dependent visual feedback [13, 20], the LIA-based instantaneous and accurate visual feedback of sensori-motor and corticospinal excitability assures a stable input-output association, resulting in efficient error-based learn-ing. Further studies are awaited to investigate whether BCI learning using the LIA algorithm is more effective for neurorehabilitation than using the conventional method.
In general, lock-in measurements can extract instant-aneous amplitude modulation in a defined single frequency by the point-by-point multiplication and inte-gration of an input with a reference trigonometric basis signal [24]. In the present study, the input signal was de-fined as EEG amplitude modulation over a single fre-quency, which showed the most reactive ERD during motor imagery. In contrast, previous studies have dem-onstrated that motor imagery-related ERDs are associ-ated with a broad frequency range including the alpha and beta frequency bands [31, 37, 38]. Although we demonstrated that the magnitudes of ERD calculated over a single frequency are associated with MEP ampli-tudes, the multi-frequencies calculation by parallel pro-cessing of LIAs may allow additional improvements in terms of the precise estimation of corticospinal excitabil-ity. In addition, in future study, we need to think to in-corporate the other filtering algorithms such as Gaussian, a generalized matched filter to optimize signal noise ra-tio in real time, or machine learning algorithms to achieve the additional improvements of the LIA-based algorithms [39,40].
Conclusion
The present study demonstrated that the variability of normalized peak-to-peak MEP amplitudes at different magnitudes of ERD extracted by a novel LIA algorithm were reduced more than those extracted by the conven-tional FFT algorithm. This result suggests that the LIA algorithm can be incorporated effectively into existing BCI paradigms to estimate human corticospinal excit-ability more precisely. This finding would be useful for the neurorehabilitation of patients with a movement disorder.
Additional file
Additional file 1:Figure S1.Peak-to-peak MEP amplitudes during the resting state and motor imagery of right wrist extension at ERD 35% and ERD 70%, calculated by the online FFT or LIA algorithm. The averaged MEP amplitudes were significantly greater inCondition 2“FFT, ERD35%”(p < 0.05),Condition 3“FFT, ERD70%”(p< 0.001),Condition 4“LIA, ERD35%”(p < 0.01), andCondition 5“LIA, ERD70%”(p< 0.001), compared toCondition 1“Relaxed.”Each line shows the result obtained from each participant. *p < 0.05, **p< 0.01, ***p< 0.005. ERD, event-related desynchronization; FFT, fast Fourier transformation; LIA; lock-in amplifier; MEP, motor evoked potential.Figure S2.Topography map of true positive rate (%) across subjects. True positive rate is defined as a percentage that exceed the targeted ERD value among 25 trials of the motor imagery task. Both the LIA-based and FFT-based methods can specifically detect the motor-imagery-related ERDs from the vicinity of the C3. (ZIP 3206 kb)
Abbreviations
BCI:brain-computer interface; ECR: extensor carpi radialis; EEG: electroencephalogram; ERD: event-related desynchronization; FFT: fast Fourier transformation; LIA: lock-in amplifier; MEPs: motor evoked potentials; rMT: resting motor threshold; SM1: primary sensorimotor area; TMS: transcranial magnetic stimulation
Acknowledgements
We thank S. Ishii, K. Nanjo, and S. Ohtaki for their technical support and S. Kasuga for helpful discussions.
Funding
This study was supported in part by MEXT KAKENHI Grant Number 15H05880 (Non-linear Neuro-Oscillology) to JU, Development Business of Medical Devices/System Study Realizing Future Medical Care, from the Japan Agency for Medical Research and Development (AMED) to J.U.,“Development of Brain-Machine Interface Technology”under the Strategic Research Program for Brain Sciences from AMED to J.U., Keio Institute of Pure and Applied Sciences research program to J.U., a Grant-in-Aid for Young Scientists (B) and the Ministry of Education, Culture, Sports, Science, and Technology (no. 16 K16467) to K.K., and a Sasakawa Scientific Research Grant from the Japan Science Society to K.K.
Availability of data and materials
The datasets acquired and/or analyzed during the current study are available from the corresponding author on reasonable request.
Authors’contributions
TK, KK, NM, and JU designed the study; TK performed the experiments and analyzed data; TK, KK, NM, and JU interpreted the results of the experiments; TK and KK prepared the figures and drafted the manuscript; TK, KK, NM, and JU edited and revised the manuscript, and approved the final version of the manuscript.
Ethics approval and consent to participate
This study was conducted according to the Declaration of Helsinki. The experimental procedures were approved by the ethics committee of the Faculty of Science and Technology, Keio University. Written informed consent was obtained from all participants prior to the experiments.
Consent for publication
We obtained written consent to publish the data from all participants prior to the experiments.
Competing interests
The authors declare that they have no competing interests.
Publisher’s Note
Author details
1Faculty of Science and Technology, Keio University, 3-14-1 Hiyoshi,
Kohoku-ku, Yokohama, Kanagawa 223-8522, Japan.2Department of Rehabilitation Medicine, Keio University School of Medicine, 35
Shinanomachi, Shinjuku, Tokyo 160-8582, Japan.3The Japan Society for the Promotion of Science, 5-3-1 Kojimachi, Chiyoda-ku, Tokyo 102-0083, Japan. 4Keio Institute of Pure and Applied Sciences (KiPAS), Keio University, 3-14-1
Hiyoshi, Kohoku-ku, Yokohama, Kanagawa 223-8522, Japan.5Department of Biosciences and Informatics, Faculty of Science and Technology, Keio University, 3-14-1 Hiyoshi, Kouhoku-ku, Yokohama, Kanagawa 223-8522, Japan.6Present address: Center of Assistive Robotics and Rehabilitation for Longevity and Good Health, National Center for Geriatrics and Gerontology, 7-430, Morioka-cho, Obu, Aichi 474-8511, Japan.
Received: 10 November 2017 Accepted: 18 October 2018
References
1. Daly JJ, Wolpaw JR. Brain-computer interfaces in neurological rehabilitation. Lancet Neurol. 2008;7:1032–43.
2. Daly JJ, Cheng R, Rogers J, Litinas K, Hrovat K, Dohring M. Feasibility of a new application of noninvasive brain computer Interface (BCI): a case study of training for recovery of volitional motor control after stroke. J Neurol Phys Ther. 2009;33:203–11.
3. Broetz D, Braun C, Weber C, Soekadar SR, Caria A, Birbaumer N. Combination of brain-computer interface training and goal-directed physical therapy in chronic stroke: a case report. Neurorehabil Neural Repair. 2010;24: 674–9.
4. Prasad G, Herman P, Coyle D, McDonough S, Crosbie J. Applying a brain-computer interface to support motor imagery practice in people with stroke for upper limb recovery: a feasibility study. J Neuroeng Rehabil. 2010;7:60.
5. Wang W, Collinger JL, Perez MA, Tyler-Kabara EC, Cohen LG, Birbaumer N, Brose SW, Schwartz AB, Boninger ML, Weber DJ. Neural interface
technology for rehabilitation: exploiting and promoting neuroplasticity. Phys Med Rehabil Clin N Am. 2010;21:157–78.
6. Ang KK, Guan C, Chua KS, Ang BT, Kuah CW, Wang C, Phua KS, Chin ZY, Zhang H. A large clinical study on the ability of stroke patients to use an EEG-based motor imagery brain-computer interface. Clin EEG Neurosci. 2011;42:253–8.
7. Caria A, Weber C, Brötz D, Ramos A, Ticini LF, Gharabaghi A, Braun C, Birbaumer N. Chronic stroke recovery after combined BCI training and physiotherapy: a case report. Psychophysiology. 2011;48:578–82. 8. Shindo K, Kawashima K, Ushiba J, Ota N, Ito M, Ota T, Kimura A, Liu M.
Effects of neurofeedback training with an electroencephalogram-based brain-computer interface for hand paralysis in patients with chronic stroke: a preliminary case series study. J Rehabil Med. 2011;43:951–7.
9. Ramos-Murguialday A, Broetz D, Rea M, Läer L, Yilmaz O, Brasil FL, Liberati G, Curado MR, Garcia-Cossio E, Vyziotis A, Cho W, Agostini M, Soares E, Soekadar S, Caria A, Cohen LG, Birbaumer N. Brain-machine interface in chronic stroke rehabilitation: a controlled study. Ann Neurol. 2013; 74:100–8.
10. Mukaino M, Ono T, Shindo K, Fujiwara T, Ota T, Kimura A, Liu M, Ushiba J. Efficacy of brain-computer interface-driven neuromuscular electrical stimulation for chronic paresis after stroke. J Rehabil Med. 2014;46:378–82. 11. Ang KK, Chua KS, Phua KS, Wang C, Chin ZY, Kuah CW, Low W, Guan C. A randomized controlled trial of EEG-based motor imagery brain-computer Interface robotic rehabilitation for stroke. Clin EEG Neurosci. 2015;46:310–20. 12. Ono T, Tomita Y, Inose M, Ota T, Kimura A, Liu M, Ushiba J. Multimodal
sensory feedback associated with motor attempts alters BOLD responses to paralyzed hand movement in chronic stroke patients. Brain Topogr. 2015;28: 340–51.
13. Ushiba J, Soekadar SR. Brain-machine interfaces for rehabilitation of poststroke hemiplegia. Prog Brain Res. 2016;228:163–83.
14. Hummel F, Andres F, Altenmüller E, Dichgans J, Gerloff C. Inhibitory control of acquired motor programmes in the human brain. Brain. 2002;125(Pt 2): 404–20.
15. Takemi M, Masakado Y, Liu M, Ushiba J. Event-related desynchronization reflects downregulation of intracortical inhibition in human primary motor cortex. J Neurophysiol. 2013;110:1158–66.
16. Krusienski DJ, McFarland DJ, Wolpaw JR. Value of amplitude, phase, and coherence features for a sensorimotor rhythm-based brain-computer interface. Brain Res Bull. 2012;87:130–4.
17. Wang Y, Veluvolu KC, Lee M. Time-frequency analysis of band-limited EEG with BMFLC and Kalman filter for BCI applications. J Neuroeng Rehabil. 2013;10:109. 18. Ge S, Wang R, Yu D. Classification of four-class motor imagery employing
single-channel electroencephalography. PLoS One. 2014;9:e98019. 19. Takemi M, Masakado Y, Liu M, Ushiba J. Sensorimotor event-related
desynchronization represents the excitability of human spinal motoneurons. Neuroscience. 2015;297:58–67.
20. Ono T, Kimura A, Ushiba J. Daily training with realistic visual feedback improves reproducibility of event-related desynchronisation following hand motor imagery. Clin Neurophysiol. 2013;124:1779–86.
21. Cvetkovic D, Übeyli ED, Cosic I. Wavelet transform feature extraction from human PPG, ECG, and EEG signal responses to ELF PEMF exposures: a pilot study, Digit. Signal Process. 2008;18:861–74.
22. Al-Fahoum AS, Al-Fraihat AA. Methods of EEG signal features extraction using linear analysis in frequency and time-frequency domains. ISRN Neurosci. 2014;8:73021 Review.
23. Gunduz A, Brunner P, Daitch A, Leuthardt EC, Ritaccio AL, Pesaran B, Schalk G. Decoding covert spatial attention using electrocorticographic (ECoG) signals in humans. NeuroImage. 2012;60:2285–93.
24. Kato K, Takahashi K, Mizuguchi N, Ushiba J. Online detection of amplitude modulation of motor-related EEG desynchronization using a lock-in amplifier: Comparison with a fast Fourier transform, a continuous wavelet transform, and an autoregressive algorithm. J Neurosci Methods. 2017;293:289–98.
25. Ferree TC, Luu P, Russell GS, Tucker DM. Scalp electrode impedance, infection risk, and EEG data quality. Clin Neurophysiol. 2001;112:536–44. 26. Groppa S, Oliviero A, Eisen A, Quartarone A, Cohen LG, Mall V, Kaelin-Lang
A, et al. A practical guide to diagnostic transcranial magnetic stimulation: report of an IFCN committee. Clin Neurophysiol. 2012;123:858–82. 27. Kraus D, Naros G, Bauer R, Leão MT, Ziemann U, Gharabaghi A. Brain-robot
interface driven plasticity: distributed modulation of corticospinal excitability. NeuroImage. 2016;125:522–32.
28. Pfurtscheller G, Neuper C. Future prospects of ERD/ERS in the context of brain-computer interface (BCI) developments. Prog Brain Res. 2006;159:433–7 Review. 29. Formaggio E, Storti SF, Avesani M, Cerini R, Milanese F, Gasparini A, Acler M,
Pozzi Mucelli R, Fiaschi A, Manganotti P. EEG and FMRI coregistration to investigate the cortical oscillatory activities during finger movement. Brain Topogr. 2008;21:100–11.
30. Formaggio E, Storti SF, Cerini R, Fiaschi A, Manganotti P. Brain oscillatory activity during motor imagery in EEG-fMRI coregistration. Magn Reson Imaging. 2010;28:1403–12.
31. Yuan H, Liu T, Szarkowski R, Rios C, Ashe J, He B. Negative covariation between task-related responses in alpha/beta-band activity and BOLD in human sensorimotor cortex: an EEG and fMRI study of motor imagery and movements. NeuroImage. 2010;49:2596–606.
32. Zarkowski P, Shin CJ, Dang T, Russo J, Avery D. EEG and the variance of motor evoked potential amplitude. Clin EEG Neurosci. 2006;37:247–51. 33. Sauseng P, Klimesch W, Gerloff C, Hummel FC. Spontaneous locally
restricted EEG alpha activity determines cortical excitability in the motor cortex. Neuropsychologia. 2009;47:284–8.
34. Kitazawa S, Kohno T, Uka T. Effects of delayed visual information on the rate and amount of prism adaptation in the human. J Neurosci. 1995;15:7644–52. 35. Tanaka H, Homma K, Imamizu H. Physical delay but not subjective delay
determines learning rate in prism adaptation. Exp Brain Res. 2011;208:257–68. 36. Honda T, Hirashima M, Nozaki D. Adaptation to visual feedback delay
influences visuomotor learning. PLoS One. 2012;7:e37900.
37. Meirovitch Y, Harris H, Dayan E, Arieli A, Flash T. Alpha and beta band event-related desynchronization reflects kinematic regularities. J Neurosci. 2015;35:1627–37.
38. Di Nota PM, Chartrand JM, Levkov GR, Montefusco-Siegmund R, DeSouza JF. Experience-dependent modulation of alpha and beta during action observation and motor imagery. BMC Neurosci. 2017;18:28.
39. Kim SE, Behr MK, Ba D, Brown EN. State-space multitaper time-frequency analysis. Proc Natl Acad Sci U S A. 2018;115(1):E5–E14.