R E S E A R C H A R T I C L E
Open Access
Optimal likelihood-ratio multiple testing with
application to Alzheimer
’
s disease and
questionable dementia
Donghwan Lee
1†, Hyejin Kang
2,3†, Eunkyung Kim
2,4, Hyekyoung Lee
2, Heejung Kim
2,4, Yu Kyeong Kim
2,5,
Youngjo Lee
3,6*and Dong Soo Lee
2,4,7*Abstract
Background:Controlling the false discovery rate is important when testing multiple hypotheses. To enhance the detection capability of a false discovery rate control test, we applied the likelihood ratio-based multiple testing method in neuroimage data and compared the performance with the existing methods.
Methods:We analysed the performance of the likelihood ratio-based false discovery rate method using simulation data generated under independent assumption, and positron emission tomography data of Alzheimer’s disease and questionable dementia. We investigated how well the method detects extensive hypometabolic regions and compared the results to those of the conventional Benjamini Hochberg-false discovery rate method.
Results:Our findings show that the likelihood ratio-based false discovery rate method can control the false discovery rate, giving the smallest false non-discovery rate (for a one-sided test) or the smallest expected number of false assignments (for a two-sided test). Even though we assumed independence among voxels, the likelihood ratio-based false discovery rate method detected more extensive hypometabolic regions in 22 patients with Alzheimer’s disease, as compared to the 44 normal controls, than did the Benjamini Hochberg-false discovery rate method. The contingency and distribution patterns were consistent with those of previous studies. In 24 questionable dementia patients, the proposed likelihood ratio-based false discovery rate method was able to detect hypometabolism in the medial temporal region.
Conclusions:This study showed that the proposed likelihood ratio-based false discovery rate method efficiently identifies extensive hypometabolic regions owing to its increased detection capability and ability to control the false discovery rate.
Background
Several multiple hypothesis testing methods have been proposed for use in neuroimaging studies. Bonferroni correction is the simplest but the most conservative method for controlling the family-wise error rate (FWER). However, it often fails to detect voxels with real activation or difference. As an alternative approach, the Benjamini and Hochberg [1] method for controlling the false
discovery rate (FDR) was applied to neuroimaging stud-ies by Genovese, Lazar and Nichols [2]. The FDR con-trol gives statistically less conservative procedures than FWER. However, Cohen and Sackrowitz [3] proved that the Benjamini and Hochberg procedure is inadmissible under any loss function that is a linear combination of false discoveries and false non-discoveries. Given a fixed FDR, it is desirable to maximize the power by minimiz-ing the false non-discovery rate (FNDR).
Recently, Lee and Bjørnstad [4] proposed a new multiple hypothesis test based on the likelihood-ratio-based FDR (LR-FDR). They showed that the problem of large-scale multiple testing is naturally expressed as an inference problem for finding the true discoveries. And they repre-sented the underlying effects of interest by the (unknown)
* Correspondence:[email protected];[email protected]
†Equal contributors 3
Data Science for Knowledge Creation Research Center, Seoul National University, Seoul, Korea
2
Department of Nuclear Medicine, Seoul National University College of Medicine, Seoul, Korea
Full list of author information is available at the end of the article
discrete random variables. Statistical inferences are for two types of unknowns, namely parameters (fixed unknowns) and unobservables (random unknowns). Bjørnstad [5] showed that all information on parameter and unob-servable data was in the extended likelihood, such as the h-likelihood [6]. Lee, Nelder and Pawitan [7] extensively introduced a random effect analysis using the extended likelihood. More recently, Lee and Bjørnstad [4] showed how the extended likelihood can be used to derive their proposed LR-FDR method. This method is optimal when (a) determining the order in which the test results can be called significant and (b) controlling error rates given this order. Provided an assumed statistical model is true, the likelihood exploits all information in the data to provide the most efficient testing. Therefore, it is important to search for the best-fitting model enhancing the performance of a multiple hypothesis test. The likeli-hood approach provides various well-developed model-checking and model-selection procedures.
In reviewing existing multiple tests, Efron [8] began by summarizing statistics such asp-values [1] and test statis-tics [8]. He then described how to find a single-threshold rule for such statistics by assuming a common alternative. A typical analysis process is involved in model selection and model prediction. Model selection aims to find a par-simonious, well-fitting model for the basic responses and model prediction uses summarizing statistics from the pri-mary analysis to make statistical inferences [9]. However, starting with the summarizing statistics makes the model selection for the basic responses secondary and difficult, leading to inefficient tests [4]. In addition, assumptions about a common alternative may not always be feasible. For BH-FDR, the conventional t-statistics (and corre-sponding p-value) are used for testing the difference of means between two groups. The LR-FDR method models with the basic response, not summarizing statistics, which allows for different alternatives for each test. The likeli-hood approach provides an efficient way of controlling the FDR by simultaneously minimizing the FNDR and the useful information such as consistent estimates of effect size or proportion of null hypotheses.
In this study, we first applied the LR-FDR method to simulated data with extensive alternative proportion (hypometabolic areas in neuroimaging data) and then to brain positron emission tomography (PET) data of three groups: Alzheimer’s disease (AD), questionable dementia (QD), and normal controls (NC). QD is also known as mild cognitive impairment (MCI), and the QD patients in our study were particularly at risk of developing dementia in the near future. We extended the model of Lee and Bjørnstad [4] to allow the distribution of test-statistic is asymmetric.
We compared the LR-FDR method to conventional thresholding using Benjamini and Hochberg’s FDR
(BH-FDR), to establish its efficiency when determining hypometabolic regions in AD and QD groups.
Methods
The LR-FDR method
Consider a hierarchical model for the basic responses. For theνth location within the brain and thejth individ-ual in the control group (ν=1, …, N and j= 1,…, n1), suppose that the responseyvj1is modeled by
yvj1¼ξvþ evj1; ð1Þ
where ξv is the mean parameter and evj1~N(0,ϕv1). Then, the treatment (or disease) group hasn2individuals (j= 1,…,n2), and the responseyvj2is modeled by
yvj2 ¼ξvþwvþevj2; ð2Þ
where wv is the treatment (or disease) effect, and evj2~N(0,ϕv2). Thus, conditional on wv, the difference between the means of the two groups,
dv¼yv2−yv1; ð3Þ
followsN(wv,ψv), withψv=ϕv1/n1+ϕv2/n2andyv1¼
P j
yvjk=nk , for v= 1,…,N and k= 1, 2. To estimate ψ=
(ψ1, …,ψN), we use the unbiased estimators of ϕvk (v= 1,…,Nandk= 1, 2),
^
ϕvk ¼
1
nk−1
Xnk
j¼1
yvjk−yvk
2
andψ^v
¼ϕ^v1=n1þϕ^v2=n2: ð4Þ
To complete the model, specify the model for the treatment effects,wv.
One-sided test
Let the null hypothesisHvbe thevth voxel is not abnor-mally activated (not different between two groups). Following Lee and Bjørnstad [4], we defined the binary random variable ov, such thatov= 0 if the null hypothesis Hvis true,ov= 1 ifHvis false, and ps=P(ov=s) for s= 0 or 1, with p0+p1= 1. Now, the multiple test problem can be viewed as predictingov.
Conditional on ov, assume thatwv follows the normal distribution:
Givenov¼0;wveN 0;σ2
;
givenov¼1;wveN μ;τ2
:
Here, we consider only normal distribution for wv. However, this likelihood approach can be easily extended to other distributions. In this study, we prefer to have
σ2
modeled by 0 <Var(wv) =σ2. Here,ψvin (4) represents the within-test variation, σ2the between-test variation for Uninteresting cases, and τ2 the between-test vari-ation for the Interesting cases. If ψv is assumed to be common (i.e.,ψv=ψfor allv), this means that there is nothing special about any voxel in the alternative, and they are all statistically exchangeable. How can we de-termine whether voxels are all (statistically) exchange-able? Since we assume that the ψvs are not common and estimate them separately, we have a statistical model that allows all active voxels to have the same mean effect, but with different sampling variances. In addition to ϕv1 and ϕv2, in this model, we have the fixed parametersθ= (p0,μ,σ2,τ2).
We denote d= (d1, …, dN)T and let w and o be the vectors of wvand ov, respectively. In this study, ois the inferential focus and w is a nuisance parameter which can be integrated out as follows:
logfθðd;oÞ ¼ log Z
fθðd;w;oÞdw
¼XN
v¼1
logfθðdvjovÞ þ logfθð Þov ;
½
where
logfθðdvjovÞ ¼I oðv¼0Þ −
1
2log 2π ψvþσ 2
− d2v
2ðψvþσ2Þ
þI oð v¼1Þ −
1
2log 2π ψvþτ 2
− ðdv−μÞ2
2ðψvþτ2Þ
" #
logfθð Þ ¼ov I ovð ¼0Þlogp0þI ovð ¼1Þlog 1ð −p0Þ;
whereI(∙) is the indicator function.
To estimate the fixed parameters,θ, Lee and Bjørnstad [4] used the maximum-likelihood (ML) estimator for the log-likelihood,
lð Þ ¼θ X N
v¼1
logfθð Þdv ; ð5Þ
where logfθ(dv) =∑ovlog fθ(dv,ov) andψvare substituted byψv^ :This avoids the downward bias of the ML estimation owing to the large number of nuisance parameters,ψv, in the model [4].
Sincefθ(dv,ov) is a density function for a mixture, the unboundedness of likelihood might occur without a proper constraint on the parameters. However, Hath-away [10] pointed out that this problem can be resolved by a local maximizer of the likelihood in the interior of the parameter space that is consistent and asymptotically efficient. Therefore, to avoid the unboundedness prob-lem, we are actually looking for a good local maximum of the likelihood, which would satisfy both σ^2>0 and
^
τ2>0 [11]. To estimate θ, we used the expectation-maximization (EM) algorithm of Dempster, Laird and Rdin [12], with the proper initial values.
Letδvbe a test for the vth null hypothesis,Hv :δv= 0 (non-discovery) ifHvis not rejected, andδv= 1 (discovery) ifHvis rejected. For someα> 0, consider the loss function
Lðα;δ1;…;δNÞ ¼
XN
v¼1
h
I ovð ¼1ÞIðδv¼0Þ
þαI oð v¼0ÞIðδv¼1Þ:
ð6Þ
Lee and Bjørnstad [4] showed that the optimal deci-sion rule, δα1;…;δαN , that minimizes the risk with the loss function (6) is
δα
v ¼1 ifR dvð ;θÞ>α;
¼0 otherwise;
where R dð v;θÞ ¼PPððoovv¼¼10jjddvvÞÞ¼
p1N dð v;μ; ψvþτ2Þ
p0N dð v;0; ψvþσ2Þ is the
likeli-hood ratio. Among tests with the common expected number of discoveries, this test is optimal in the sense that it controls the FDR with the smallest FNDR.
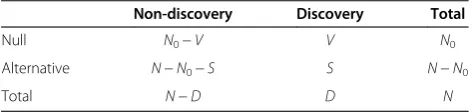
The outcomes of multiple tests can be summarized as in Table 1. Following Lee and Bjørnstad [4], we define the FDR and FNDR as E(V)/E(D) and E(N−N0−S)/E (N−D), respectively. Benjamini and Hochberg defined the Fdr as E(V/D), but Genovese and Wasserman [13] showed that Fdr =E(V/D) and FDR =E(V)/E(D) are asymptotically equivalent (inN) if the tests are independ-ent. Suppose we want a test with an FDR level ofκ. In this
study, we first estimate the FDR as ^FDRð Þα , for each α.
Then, we search for the cutoffαsuch that FDR^ðαÞ ¼κ to obtain the optimal test,δα1;…;δαN ;with an FDR con-trol ofκ. Lee and Bjørnstad [4] used the following estimator:
FDRð Þα
^
¼E Vð Þjθ¼^θ
D ;
which works well in their examples from genetic studies in whichNis of the order of several thousands. However, in brain images for which N= 329,694 > > 10,000, we
Table 1 The outcomes of N multiple hypothesis tests
Non-discovery Discovery Total
Null N0−V V N0
Alternative N−N0−S S N−N0
found thatD can sometimes be less than E Vð Þθ¼^θ: To avoid this problem, we use the estimator
FDRð Þα
^¼ E Vð Þjθ¼^θ
E Vð Þθ¼^θþE Sð Þθ¼^θ:
In our models, δα
v¼I R dð ð v;θÞ> αÞ ¼I dv<clvordv>cuv
. For a givenα, the cutoff values cl
v and cuv can be solved
numerically from the equationR(dv;θ) =α. Then,
E Vð Þ ¼XP ov¼0;δαv ¼1
¼p0XP δαv ¼1jov¼0Þ
¼p0
X Φ clv=
ffiffiffiffiffiffiffiffiffiffiffiffiffiffiffiffi ψvþσ2
q
þΦ~ cuv=
ffiffiffiffiffiffiffiffiffiffiffiffiffiffiffiffi ψvþσ2
q
h i
;
E Sð Þ ¼XP ov¼1;δαv ¼1
¼p1XP δαv ¼1jov¼1Þ
¼p1
X
Φ clv−μ=
ffiffiffiffiffiffiffiffiffiffiffiffiffiffiffiffi ψvþσ2 q
þΦ~ cuv−μ=
ffiffiffiffiffiffiffiffiffiffiffiffiffiffiffiffi ψvþσ2
q
;
where Φ(∙) is the cumulative distribution function of a standard normal distribution and Φ~ð Þ ¼∙ 1−Φð Þ∙ : By plugging in the estimates of θ, we obtain an estimator for the FDR.
Two-sided test
In a two-sided problem, we may take only two actions. We can either simply accept or reject the null hypothesis without distinguishing between the positive and negative effects. In the case of brain data, it is important to assign abnormal regional changes at the voxel level. An abnor-mal voxel can be defined as an abnorabnor-mally positive (hypermetabolic) or negative (hypometabolic) state. Es-pecially positive activity might be associated with a treat-ment effect after treattreat-ment or functional compensation, while negative activity might be associated with func-tional deficit. This statistically specific determination of an abnormal voxel influences clinical interpretations. Therefore, this method allows us to consider the sign of the test statistic to decide whether the alternative discov-ery is positive or negative when the null hypothesis is rejected. In other words, we would never conclude that there is a discovery without stating whether the effect is positive or negative. As we show in the discussion on our results, in neuroimaging, an entire alternative can be either hypermetabolic or hypometabolic, whereas in genetics, alternatives often exist in both directions.
Extending the one-sided test model from the previous section, we used thetwo-sided multiple testing with three actionsof Lee and Bjørnstad [4]. Here, the discrete ran-dom variable,ov, takes one of the three states: (a)ov= 0 if theith case is“Uninteresting;”(b)ov= 1 if theith case is “Interesting, with a Positive effect;” and (c) ov=−1 if
the ith case is “Interesting, with a Negative effect.” In addition,ps=P(ov=s) for s =−1, 0, 1, withp0+p1+p−1= 1.
Consider the differences in (3). Suppose that, condi-tional onov,wvfollows a normal distribution, as follows:
Givenov¼0;wveN0;σ2;
givenov¼1;wveNμP;τ2P;
givenov¼−1; wveN−μN;τ2N;
where μP, μN> 0. For simplicity of arguments, in this paper, we assume thatμP=μN=μ and τ2P¼τ2N¼τ2. In this model, we have the fixed parametersθ= (p0,p1,μ,σ2,τ2), yielding a three-mixture model. Thus, we can use the EM algorithm to estimateθ. Sinceovtakes one of three states, the decision ruleδvalso takes a value in {0, 1,−1}. In other words,δv= 0 (non-discovery) ifHvis not rejected,δv= 1 ifHvis rejected with a positive effect, and δv=−1 ifHv is rejected with a negative effect.
For someα+> 0 andα−> 0, consider the loss function
Lðαþ; α−;δ1;…;δNÞ ¼
XN
v¼1
h
I oð v≠0ÞIðδv≠ovÞ
þI ovð ¼0ÞfαþIðδv¼1Þ
þα−Iðδv¼−1Þg
i
ð7Þ
Then, the optimal decision rule that minimizes the risk in the loss function (7) is
δαþ;α−
v ¼1 ifRþðdv;θÞ>αþandRþðdv;θÞ−R−ðdv;θÞ>αþ−α−;
¼−1 ifR−ðdv;θÞ>α−andRþðdv;θÞ−R−ðdv;θÞ<αþ−α−;
¼0 otherwise:
where
Rþðdv;θÞ ¼Pðov¼1jdÞ P ovð ¼0jdÞ¼
p1N dvð ;μ; ψvþτ2Þ p0N dvð ;0; ψvþσ2Þ;
R−ðdv;θÞ ¼Pðov¼−1jdÞ P oð v¼0jdÞ
¼p−1N dvð ;−μ; ψvþτ2Þ p0N dð v;0; ψvþσ2Þ
:
If we control the FDR at level κ for both directions usingα+ and α−, the resulting two-sided test with three
actions maintains the FDR at the same level. Further-more, this optimal test allows more flexible analysis which can control the FDR at different level for each dir-ection, for example, 0.05 for positive direction and 0.01 for negative direction. In fact, Lee and Bjørnstad [4] showed that the resulting multiple two-sided test with three actions δαþ;α−
1 ;…;δαþ;αN −
Simulation data
Simulation data were generated with a dimension of 400 × 400 pixels. We set the proportion of positive pixels to 80% (Simulation I) and 60% (Simulation II) per 160,000 total pixels, considering that the estimates of p1 were high in our PET data. For each simulation setting, we varied μ= 1, 3, 5 and fixed σ2= 0.3 and τ2= 0.5. From (1) and (2), we randomly generated yvj1 and yvj2 for v= 1,…, 160, 000, j1= 1,…, 30, and j2= 1,…, 30. For each simulation, we generated 100 simulation data sets and applied both the LR-FDR and BH-FDR methods to control the FDR at the 0.05 level.
AD and QD PET data
PET data were composed of two types of patient groups and one control group. The first group consisted of 22 probable AD patients (mean age, 66.9 ± 7.2) with moder-ate dementia according to the criteria of the Mini-Mental State Examination (MMSE), with a mean MMSE score of 13 ± 5.0, and a Clinical Dementia Rating (CDR) score between 1 and 3. Generally, the MMSE score can be indicated severe (<9), moderate (10–18), mild (19–24) cognitive impairment. The AD patients suffered progres-sive memory loss, but had no disturbance of conscious-ness. The second group comprised 24 QD patients (mean age, 67.3 ± 9.0) who showed objective evidence of memory and/or cognitive impairments, but did not satisfy the criteria for AD. Their CDR scores were all 0.5, and their mean MMSE scores were 23 ± 4.1.
All the patients were diagnosed by clinical evaluation using the National Institute of Neurological and Com-municative Disorders and Stroke and Alzheimer’s Dis-ease and Related Disorders Association AD criteria as a guideline. The two patient groups described above were compared with 44 normal control (NC) subjects (mean age, 68.9 ± 5.2). These NC subjects were recruited from the Health Care Center at Seoul National University Hospital and had no history of neurological disorders, psychiatric disorders, significant medical conditions, or substance abuse. For subject screening, the Korean ver-sion of the modified MMSE and the Mood Evaluation Scale were used, and only right-handed subjects were included in the study. Furthermore, there was no signifi-cant age difference among the three groups. This study was approved by the institutional review board (IRB) of the Seoul National University Hospital. PET data of our patients were only part of the patient’s standard care. We used patient’s data from database obtained from 1996 to 1999. Normal controls were recruited for other study purpose (i.e., creation of Korean Standard Brain Template) from Center for Health Promotion and Opti-mal Aging of Seoul National University Hospital in 2001 [14], who provided informed consent which was verbal form. For our research using identifiable human data,
such as PET data in database of department, although we didn’t receive documented informed consent from participants, IRB of our institute decided that this study protocol was applicable to exceptional situations where consent would be impracticable to obtain due to reuse storage data in database. Also our study was conducted in a manner that minimizes possible abuse to human subject’s health and rights and no clinical intervention was performed for our study.
PET image acquisition
18
F-FDG PET images were obtained using an ECAT EXACT 47 (Siemens-CTI, Knoxville, TN, USA) PET scanner with an intrinsic resolution of 5.2 mm FWHM. After obtaining a transmission scan measured by68Ge rod sources for attenuation correction, an emission scan was obtained. During the resting state,18F-FDG was adminis-tered in doses of 370 MBq (10 mCi) for 30 min to obtain a static emission scan. All participants were scanned under the normal environmental noise conditions in the scanner room. For transaxial image reconstruction a fil-tered back-projection algorithm (Shepp-Logan filter at a cutoff frequency of 0.3 cycles/pixel as 128 × 128 × 47 matrices of size 2.1 × 2.1 × 3.4 mm) was used.
Image processing
All PET images were preprocessed using Statistical Parametric Mapping (SPM 2, University College of London, UK) and implemented in the Matlab 6.5 (Mathworks Inc., USA) environment. After spatial normalization to the Montreal Neurological Institute (MNI) space, all im-ages were smoothed with a Gaussian filter of 16 mm full width at half maximum (FWHM). The PET signal inten-sity was normalized to the individual’s total mean count for the cerebellum. This region was chosen as a refer-ence region because it remains relatively unaffected until late in the progression of AD, if at all. To remove non-brain voxels, normalized and smoothed PET im-ages were exclusively masked with a binary brain mask image. The same masked PET images were applied to both LR-FDR and BH-FDR methods using R software.
Results
Simulation results
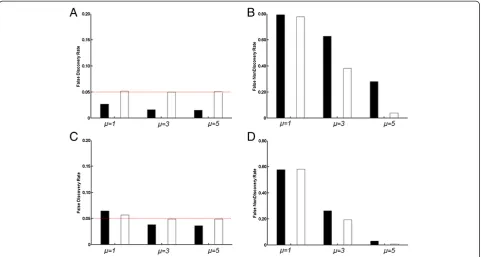
We applied the proposed LR-FDR method to the simu-lated data set. The simusimu-lated data had a pixel dimension of 400 × 400, which yielded a total 160,000 tests. We considered two simulation settings with varying p1, the proportion of pixels with ov= 1: p1 was 80% in Simula-tion I and 60% in SimulaSimula-tion II. Figure 1 shows the FDR and FNDR results based on the 100 simulated data sets.
Simulation II (p1= 60%). The LR-FDR method yielded FDR results quite close to 0.05 in both simulation settings. The minimum and maximum of the average FDR from the 100 repeated tests were 0.049 and 0.056, respectively, across all settings. The BH method often yielded a more conservative FDR control for most of the settings.
Results of the AD and QD data analysis
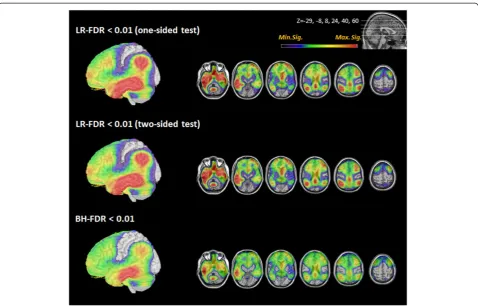
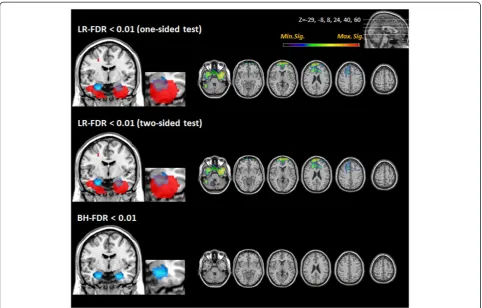
In probable AD cases, all methods (one-sided test of LR-FDR, two-sided test of LR-FDR, conventional BH-FDR methods) revealed hypometabolic regions at FDR level 0.01 (Figure 2). Both the one-sided and two-sided tests of LR-FDR showed hypometabolism in the bilateral posterior cingulate, frontal, temporal, and parietal areas, the extent of which was wider than that shown by conventional BH-FDR. More specifically, the LR-FDR method showed that the hypometabolic regions spread to the posterior pre-frontal and anterior occipital regions in the AD group. No hypometabolic areas were observed in the sensorimotor and visual areas by any of the methods. Quantification using the LR-FDR method generally found a greater num-ber of voxels than did the BH-FDR method (Table 2). In the QD cases, the LR-FDR method showed hypometabolic regions in both medial temporal areas, including the hippocampus and anterior frontal cortex (Figure 3). The
hypometabolic voxels in the medial temporal regions were found more easily using LR-FDR method at 0.05, 0.01, 0.005, and 0.001. However, no hypometabolic region was found by BH-FDR method with controlling FDR at 0.01 (Table 3).
The estimates of the fixed parameters are shown in Table 4. In the AD cases, two-sided tests give the effect size, ^μ = 4.524, and the estimated probability of “ Inter-esting, with a Negative effect,” ^p−1 = 0.771. Since ^p1 approaches 0 in the two-sided test, both tests have the same parameter estimates and the same number of significant voxels. In the QD cases, very few hypermeta-bolic region was found.
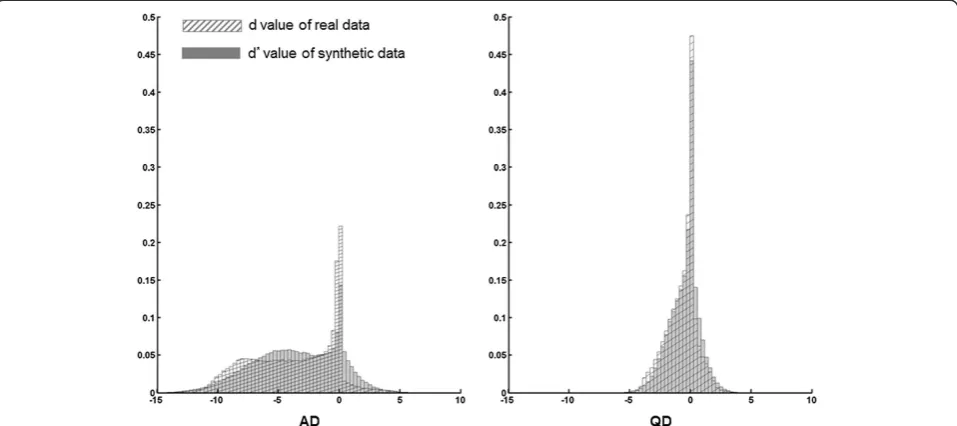
The distribution oftv¼ dv=
ffiffiffiffiffiffiffiffiffiffiffiffiffiffiffiffi ψvþσ2 p
at the nullov= 0 wasN(0, 1). However, Figure 4 shows that mosttv-values for both the AD and QD groups were located on the left of the theoretical null distribution, N (0, 1). Lee and Bjørnstad [4], when analyzing genetic data, assumed that p1=p−1, but we did not do so here, as in our neuroimag-ing data, p1≪p−1. For both the AD and QD PET data, the symmetric model (with p1=p−1) was not plausible. Therefore, we avoided using the wrong symmetric model by estimating,p1andp−1separately. To check the good-ness of fit, we first generated a synthetic sample,dv;from the fitted model,fθ(dv), using the estimated parameters in Table 4. Figure 4 shows the histogram of dv. Since the shapes of the histograms of thedv(from the real data) and
dv (from the synthetic data) were similar, we could say that resulting model fitting was appropriate.
In AD group, the result of the LR-FDR one-sided test was the same as that of the LR-FDR two-sided test with three actions, because in these data, there was no positive
effect (^p1¼0). In other words, no hypermetabolic region was found in AD patient group.
Discussion
In this study, we applied the LR-FDR method to neuro-imaging data. We found that the LR-FDR method in-creased the detection capability in the simulated as well as brain PET data, allowing us to decrease the FNDR and find larger areas of abnormality under the given level of the FDR, respectively. Decreasing the FNDR worked when the difference of the means of the two groups was within a range specified in the simulation study. When we com-pared the two patient groups (AD and QD) with NC group, the three actions of 1, 0, and−1, corresponding to positive (normal < patients), null (normal = patients), and negative (normal > patients) differences, revealed areas of hyper-, eu-, and hypo-metabolism, respectively. Only negative results (i.e., hypometabolism) in AD patients as compared to normal were obtained and visualized in both the one-sided test and the two-sided test with three actions. In the two-sided test with three actions, Figure 2Brain regions with significantly lower FDG uptake in probable AD compared to NC.Regions with lower FDG uptake in probable AD are displayed. The left hemisphere is shown as a 3D volume rendering. The reduction in the FDG uptake in the temporal, parietal, and posterior prefrontal regions was commonly found in the LR-FDR and BH-FDR methods. Extensive hypometabolic areas extending to posterior prefrontal were detected with the LR-FDR one-sided and two-sided tests. The color bar range from minimum to maximum significance level denotes the significance of the likelihood ratio in both LR-FDR methods and of thep-value in BH-FDR method. (AD: Alzheimer’s disease; FDR: False discovery rate; LR-FDR: Likelihood ratio false discovery rate; NC: Normal controls).
Table 2 Total number of voxels in the whole brain with significant hypometabolism at different threshold levels
Comparisons Threshold levels
Number of significant voxels
LR-FDR (one-sided)
LR-FDR (two-sided)
BH-FDR
NC > AD FDR 0.001 194789 194789 165451
FDR 0.005 213881 213881 207426
FDR 0.01 223091 223091 221507
FDR 0.05 249706 249706 251100
NC > QD FDR 0.001 8471 7740 47
FDR 0.005 18094 16767 140
FDR 0.01 25624 23813 212
FDR 0.05 53229 50287 22038
the estimated probability of a hypermetabolic region was zero in cases with AD. In these cases, extensive regional metabolic reduction was found throughout the brain, with the same degree, by the one-sided test and two-sided test with three actions.
In existing literature, several reports have stated that abnormalities in glucose metabolism are probably present in the medial part of the temporal lobes early in the devel-opment of AD [15,16]. QD or MCI subjects (CDR score of 0.5) are likely to show initial minor abnormalities
[17,18] that, in some cases, have progressed to probable AD upon follow-up [16,19,20]. Various investigators have attempted to find the predictive areas of abnormality, by using both FDG PET [16] and MRI using voxel-based morphometry [21], to predict future development of AD. Among these predictors are medial temporal lobe involve-ment of MRI signal loss (atrophy) [18-21], accumulation of neutritic plaques [22], and hypometabolism [16,23].
The expansion of hypometabolism to the temporal, cingulate, or other cortices was a common finding in AD. However, the right/left asymmetry of involvement or the exact nature of the abnormality in the hippocampus shown by FDG PET or MRI has not been consistently Figure 3Brain regions with significantly lower FDG uptake in QD compared to NC.The coronal view in the left column shows hypometabolism in the medial temporal regions in QD. An anatomical map of the hippocampus is displayed in blue. Regions with a lower FDG uptake are displayed in red. The LR-FDR one-sided and two-sided tests disclosed more extensive hypometabolic areas in both temporal lobes than did the BH-FDR method. (FDR: False discovery rate; LR-FDR: Likelihood ratio false discovery rate; NC: Normal controls; QD: Questionable dementia).
Table 3 Total number of voxels in hippocampus with significant hypometabolism at different threshold levels Comparisons Threshold
levels
Number of significant voxels
LR-FDR one-sided
(L/R)
LR-FDR two-sided
(L/R)
BH-FDR (L/R)
NC > QD FDR 0.001 0/117 0/117 0/0
FDR 0.005 1/181 1/184 0/0
FDR 0.01 12/217 12/217 0/0
FDR 0.05 118/303 121/303 0/158
NC: Normal controls; QD: Questionable dementia.
Table 4 Parameter estimates
Comparisons Tests μ σ2 τ2 P
0 P1 P−1
NC > AD One-sided −4.524 0.001 9.437 0.229 0.771
-Two-sided 4.524 0.001 9.437 0.229 0.000 0.771
NC > QD One-sided −1.437 0.000 0.696 0.669 0.331
-Two-sided 1.479 0.000 0.594 0.674 0.004 0.323
reported [18,24-26]. This might be due to differences between patients and the normal populations examined, but might also be due to differences in the statistical methods used to detect abnormalities. Thus far, consid-erable effort has been made to control false positives, but less effort has gone into minimizing false negatives. Using this novel LR-FDR method to minimize the FNDR, we found right-dominant abnormalities in the hippocampus in a relatively small patient group.
Using simulation studies, we showed that the LR-FDR method controlled the FDR quite near to the stated level. In contrast, the BH-FDR method did not maintain the stated FDR level, and instead became more conserva-tive (i.e., a lower FDR then set beforehand). Furthermore, the LR-FDR method reduced the FNDR significantly in certain situations, according to the simulation study, as compared to the BH-FDR method. The FNDR reduction became greater asp1increased. In the neuroimaging data, such as the AD PET data, p1 was larger (e.g., 0.771), whereas in the genomic studies, p1was often small (i.e., less than 0.05). The BH-FDR method assumes thatσ2= 0. However, the LR-FDR method allows for non-zero between-test variations (σ2> 0 orτ2> 0). In our PET study using real imaging data, we found that the maximum like-lihood estimates of τ2 are very different from zero. In a neuroimaging data analysis, the LR-FDR method was pre-ferred over the BH-FDR method. The LR-FDR method had a higher detection capability, and showed extensive hypometabolic regions in patients with AD or QD. Espe-cially, in QD group, no significant area was found in BH-FDR at 0.01, although the hypometabolic voxels were 229
in LR-FDR method. One possibility is that the hippocam-pal region was falsely assigned as a null in the BH-FDR method at this threshold level.
The data used in this study were drawn from Lee, Kang, Jang, Cho, Kang, Lee, Kang, Lee, Woo and Lee [27], and the assessment of cerebral glucose metabolism by FDG-PET in a resting state correlated well with the progression of disease severity in patients with AD [23,28]. Unlike patients with cognitive deterioration as-sociated with old age, patients with AD showed de-creased FDG uptake in both parietal regions, including the posterior cingulate and temporal areas and the frontal cortices, as the disease progressed [29,30]. Pri-mary sensory and motor cortices, as well as visual and deep gray cortices remained relatively intact in AD until late in the disease progression [31]. FDG-PET results, analyzed by all three methods, showed a characteristic spatial pattern of glucose hypometabolism in the par-ietal, temporal, and posterior prefrontal regions in pa-tients with AD, as compared to the NC group. In AD cases, the pattern of distribution was similar. However, unlike the conventional methods, the LR-FDR method showed more extensive hypometabolic areas, extending symmetrically to posterior prefrontal cortices.
revealed hypometabolism in bilateral medial temporal areas. The hypometabolism seen on the right side was more extensive and severe in LR-FDR method.
We showed that the LR-FDR method for two-sided multiple testing with three actions can be applied to neuroimaging data analysis to find hypermetabolic or hypometabolic regions. In the search for a pre-symptomatic imaging biomarker in the prodromal phase of AD (i.e., QD), we propose that the LR-FDR method is the most efficient tool and, therefore, optimizes the chances for success. Ac-cording to the good fitting of the model shown in Figure 4, we could say that the non-symmetric model fitting and efficient analysis was feasible to yield robust results from the LR-FDR method, using either the one-sided test or two-sided test with three actions. In the non-symmetric cases, none of the methods employed by Lee and Bjørnstad [4] worked, assuming p1=p−1. This is the advantage our LR-FDR method holds, when applied to neuroimaging data, over any existingp-value based methods.
The extended likelihood principle of Bjørnstad [5] means that if the assumed model is correct, all informa-tion on the unknowns is in the extended likelihood. Therefore, this can be the basis for the most efficient test. However, if the assumed model is not correct, the likelihood method may fail. All the existing multiple test-ing procedures have been developed without considertest-ing a proper model choice, so that, as Lee and Bjørnstad [4] showed, existing methods may not maintain the stated FDR level if any of their model assumptions are wrong. Under the likelihood approach, we can use the likelihood-based model-checking and model-selection procedures to enhance the performance of the test [4].
After reviewing the simulation data, we were surprised that the BH-FDR and LR-FDR methods produced so high an FNDR when the difference was small, for ex-ample,μ= 1. We need to improve the methods to ob-tain robust results, even when the alternative and null distributions overlap by so much. Another interesting area of future research would be to study robust models for various violations of model assumptions using double hierarchical generalized linear models [7,34]. Furthermore, the neuroimaging data are actu-ally spatiactu-ally correlated among the voxels. Owing to the difficulty in specifying the full spatial dependency, we assumed independence over voxels. Genovese, Roeder and Wasserman [35] showed that exploiting the depend-ency structure improved the power. Thus, a further exten-sion of the LR-FDR method to a spatially correlated model would be a promising prospect for future work.
Conclusions
We applied the LR-FDR method to PET data from AD and QD patients and compared the performance to that of conventional BH-FDR method. We found that the
LR-FDR method enabled us to find more voxels with a congruent distribution. Based on our findings from the AD and QD PET subjects and our simulation study, proving the increased efficiency, bilateral hippocampal hypometabolism might serve as a marker for QD. It would be interesting to extend this approach to perform individual analyses of PET or MRI images to find a meaningful region of brain. A prospective study of a co-hort of subjects with QD (or MCI), in which individuals might show a conversion to AD, is warranted, and the LR-FDR method would prove advantageous in such studies.
Competing interests
The authors declare that they have no competing interests.
Authors’contributions
DL analysed the data, contributed analysis tool and drafted the manuscript. HK analysed the data, drafted the manuscript and interpreted the results. EK analysed the data and visualized the results. HL helped to set and analyse simulation data. HJK and YK collected data and participated in design and coordination. YL developed the analysis tool, conceived and designed the analysis, and drafted the manuscript. DSL conceived and designed the analysis, interpreted the results and drafted manuscript. All authors read and approved the final manuscript.
Acknowledgements
This research was supported by the National Research Foundation of Korea (NRF) grant funded by the Ministry of Education, Science and Technology (MEST) (grant No. 2011–0030810, 2011–0030815 and 2014M3C7A1062896).
Author details 1
Department of Statistics, Ewha Womans University, Seoul, Korea.
2Department of Nuclear Medicine, Seoul National University College of
Medicine, Seoul, Korea.3Data Science for Knowledge Creation Research Center, Seoul National University, Seoul, Korea.4Interdisciplinary Program in
Cognitive Science, Seoul National University, Seoul, Korea.5Department of Nuclear Medicine, Seoul Metropolitan Government Seoul National University Boramae Medical Center, Seoul, Korea.6Department of Statistics, Seoul National University, Seoul, Korea.7Department of Molecular Medicine and
Biopharmaceutical Sciences, Graduate School of Convergence Science and Technology, and College of Medicine, Seoul National University, Seoul, Korea.
Received: 18 September 2014 Accepted: 15 January 2015 Published: 30 January 2015
References
1. Benjamini Y, Hochberg Y. Controlling the false discovery rate: a practical and powerful approach to multiple testing. J R Statist Soc B. 1995;57(1):289–300. 2. Genovese CR, Lazar NA, Nichols T. Thresholding of statistical maps in
functional neuroimaging using the false discovery rate. Neuroimage. 2002;15(4):870–8.
3. Cohen A, Sackrowitz H. More on the inadmissibility of step-up. J Multiv Anal. 2007;98:481–92.
4. Lee Y, Bjørnstad JF. Extended likelihood approach to large-scale multiple testing. J Roy Stat Soc B. 2013;75(3):553–75.
5. Bjørnstad JF. On the generalization of the likelihood function and likelihood principle. J Am Stat Assoc. 1996;91:791–806.
6. Lee Y, Nelder JA. Hierarchical generalized linear models (with discussion). J Roy Stat Soc B. 1996;58:619–78.
7. Lee Y, Nelder JA, Pawitan Y. Generalized linear models with random effects : unified analysis via h-likelihood. Boca Raton, FL: Chapman & Hall/CRC; 2006. 8. Efron B. The Future of Indirect Evidence. Stat Sci. 2010;25(2):145–57. 9. McCullagh P, Nelder JA. Generalized linear models 2nd ed. London; New
York: Chapman and Hall; 1989.
11. Hastie T, Tibshirani R, Friedman JH. The elements of statistical learning: data mining, inference, and prediction 2nd ed. New York: Springer; 2009. 12. Dempster A, Laird N, Rdin D. Maximum Likelihood from Incomplete Data
via the EM Algorithm. J R Statist Soci B. 1977;39:1–38.
13. Genovese CR, Wasserman L. Operating characteristics and extensions of the FDR procedure. J Roy Stat Soc B. 2002;64:499–518.
14. Lee JS, Lee DS, Kim J, Kim YK, Kang E, Kang H, et al. Development of Korean standard brain templates. J Kor Med Sci. 2005;20(3):483–8.
15. De Santi S, de Leon MJ, Rusinek H, Convit A, Tarshish CY, Roche A, et al. Hippocampal formation glucose metabolism and volume losses in MCI and AD. Neurobiol Aging. 2001;22(4):529–39.
16. Morbelli S, Piccardo A, Villavecchia G, Dessi B, Brugnolo A, Piccini A, et al. Mapping brain morphological and functional conversion patterns in amnestic MCI: a voxel-based MRI and FDG-PET study. Eur J Nucl Med Mol Imaging. 2010;37(1):36–45.
17. Almkvist O, Basun H, Backman L, Herlitz A, Lannfelt L, Small B, et al. Mild cognitive impairment–an early stage of Alzheimer’s disease? J Neural Transm Suppl. 1998;54:21–9.
18. Wolf H, Grunwald M, Kruggel F, Riedel-Heller SG, Angerhofer S, Hojjatoleslami A, et al. Hippocampal volume discriminates between normal cognition; questionable and mild dementia in the elderly. Neurobiol Aging. 2001;22(2):177–86.
19. Chetelat G, Fouquet M, Kalpouzos G, Denghien I, De la Sayette V, Viader F, et al. Three-dimensional surface mapping of hippocampal atrophy progression from MCI to AD and over normal aging as assessed using voxel-based morphometry. Neuropsychologia. 2008;46(6):1721–31.
20. Chetelat G, Landeau B, Eustache F, Mezenge F, Viader F, de la Sayette V, et al. Using voxel-based morphometry to map the structural changes associated with rapid conversion in MCI: a longitudinal MRI study. Neuroimage. 2005;27(4):934–46.
21. Risacher SL, Saykin AJ, West JD, Shen L, Firpi HA, McDonald BC. Baseline MRI predictors of conversion from MCI to probable AD in the ADNI cohort. Curr Alzheimer Res. 2009;6(4):347–61.
22. Koivunen J, Scheinin N, Virta JR, Aalto S, Vahlberg T, Nagren K, et al. Amyloid PET imaging in patients with mild cognitive impairment: a 2-year follow-up study. Neurology. 2011;76(12):1085–90.
23. Silverman DH, Small GW, Chang CY, Lu CS, Kung De Aburto MA, Chen W, et al. Positron emission tomography in evaluation of dementia: Regional brain metabolism and long-term outcome. JAMA. 2001;286(17):2120–7. 24. Apostolova LG, Dinov ID, Dutton RA, Hayashi KM, Toga AW, Cummings JL,
et al. 3D comparison of hippocampal atrophy in amnestic mild cognitive impairment and Alzheimer’s disease. Brain. 2006;129(Pt 11):2867–73. 25. Geroldi C, Laakso MP, DeCarli C, Beltramello A, Bianchetti A, Soininen H,
et al. Apolipoprotein E genotype and hippocampal asymmetry in Alzheimer’s disease: a volumetric MRI study. J Neurol Neurosur Psych. 2000;68(1):93–6.
26. Tapiola T, Pennanen C, Tapiola M, Tervo S, Kivipelto M, Hanninen T, et al. MRI of hippocampus and entorhinal cortex in mild cognitive impairment: a follow-up study. Neurobiol Aging. 2008;29(1):31–8.
27. Lee DS, Kang H, Jang MJ, Cho SS, Kang WJ, Lee JS, et al. Application of false discovery rate control in the assessment of decrease of FDG uptake in early Alzheimer dementia. Korean J Nucl Med. 2003;37(6):374–81.
28. Desgranges B, Baron JC, Lalevee C, Giffard B, Viader F, de La Sayette V, et al. The neural substrates of episodic memory impairment in Alzheimer’s disease as revealed by FDG-PET: relationship to degree of deterioration. Brain. 2002;125(Pt 5):1116–24.
29. Alexander GE, Chen K, Pietrini P, Rapoport SI, Reiman EM. Longitudinal PET Evaluation of Cerebral Metabolic Decline in Dementia: A Potential Outcome Measure in Alzheimer’s Disease Treatment Studies. Am J Psychiatry. 2002;159(5):738–45.
30. Langbaum JB, Chen K, Lee W, Reschke C, Bandy D, Fleisher AS, et al. Categorical and correlational analyses of baseline fluorodeoxyglucose positron emission tomography images from the Alzheimer’s Disease Neuroimaging Initiative (ADNI). Neuroimage. 2009;45(4):1107–16. 31. Frisoni GB, Pievani M, Testa C, Sabattoli F, Bresciani L, Bonetti M, et al. The
topography of grey matter involvement in early and late onset Alzheimer’s disease. Brain. 2007;130(Pt 3):720–30.
32. Li Y, Rinne JO, Mosconi L, Pirraglia E, Rusinek H, DeSanti S, et al. Regional analysis of FDG and PIB-PET images in normal aging, mild cognitive impairment, and Alzheimer’s disease. Eur J Nucl Med Mol Imaging. 2008;35(12):2169–81.
33. Mosconi L, Tsui WH, De Santi S, Li J, Rusinek H, Convit A, et al. Reduced hippocampal metabolism in MCI and AD: automated FDG-PET image analysis. Neurology. 2005;64(11):1860–7.
34. Lee Y, Nelder JA. Double hierarchical generalized linear models (with discussion). Appl Statis. 2006;55:139–85.
35. Genovese CR, Roeder K, Wasserman L. False discovery control with p value weighting. Biometrika. 2006;93:509–24.
doi:10.1186/1471-2288-15-9
Cite this article as:Leeet al.:Optimal likelihood-ratio multiple testing with application to Alzheimer’s disease and questionable dementia.BMC Medical Research Methodology201515:9.
Submit your next manuscript to BioMed Central and take full advantage of:
• Convenient online submission
• Thorough peer review
• No space constraints or color figure charges
• Immediate publication on acceptance
• Inclusion in PubMed, CAS, Scopus and Google Scholar
• Research which is freely available for redistribution