Fabrication and Optical Characterization of Zinc Oxide Nanoparticles
Prepared via a Simple Sol-gel Method
K. HedayatiDepartment of Science, Arak University of Technology, Arak, Iran
Abstract
In this research zinc oxide (ZnO) nano-crystalline powders were prepared by sol-gel method using zinc acetate. The ZnO nanoparticles were characterized by X-ray diffraction (XRD), scanning electron microscopy (SEM), ultraviolet-visible (UV-Vis), Fourier transform infra-red (FT-IR) and energy dispersive X-ray (EDX) spectroscopy. The structure of nanoparticles was studied using XRD pattern. The crystallite size of ZnO nanoparticles was calculated by Debye– Scherrer formula. Morphology of nano-crystals was observed and investigated using the SEM. The grain size of zinc oxide nanoparticles were in suitable agreement with the crystalline size calculated by XRD results. The optical properties of particles were studied with UV-Vis an FTIR absorption spectrum. The Raman spectrum measurements were carried out using a micro-laser Raman spectrometer forms the ZnO nanoparticles. At the end studied the effect of calcined temperature on the photoluminescence (PL) emission of ZnO nanoparticles.
2015 JNS All rights reserved
Article history: Received 22/09/2015 Accepted 08/11/2015 Published online 01/12/2015
Keywords: Nanoparticle Sol-gel Zinc Oxide
*Corresponding author: E-mail address:
Phone: +98 8633670021
Fax: +98 8633670021
1. Introduction
Zinc oxide is a very important semiconductor with a direct wide band gap of 3.37 eV and a large exciton binding energy of 60 meV at room temperature [1]. Therefore, ZnO nanoparticles have many applications in solar cells [2], gas sensor [3], anti-virus agent in coating [4] and electroluminescent devices [5]. The nonlinear properties of ZnO are very interesting for the
production of optical devices [6]. ZnO has been synthesized using several method as like homogeneous precipitation [7] microwave methods [8] thermal evaporation [9], pulsed laser deposition [10], spray pyrolysis [11] and solution–gelation (sol–gel) [12].
optical and electronic properties strongly dependence to preparation method of synthesis of this material. The sol–gel method is a popular method because of its low cost, reproducibility, simplicity and reliability conditions of synthesis. In this work, the sol–gel method was used to prepare ZnO nanoparticles. Then the nanoparticles calcined at 400, 500 and 600 οC. The crystallinity, size, morphology, and optical properties of ZnO nano particles were investigated.
2. Experimental
2.1. Materials and characterization
For the synthesis of zinc oxide nanoparticles, the following procedure was used. The chemical precursors used in reaction zinc acetate dehydrate (Zn(CH3COO)2·2H2O), citric acid (C6H8O7) and
distilled water (all materials from Merck Company were used without further purification). Firstly, 10 ml of aqueous 1 M citric acid solution and 50 ml of aqueous 0.1 M zinc acetate solution, prepared using deionized water. The solution is kept in an ultrasonic bath at room temperature for 2 hours to obtain a homogeneous solution. The obtained solution were heated using a hot plate on 60°C with a magnetic stirring until forming the gel. Then the temperature was increased to 180°C until preparation a dry gel. Finally, the precursors were calcined in an oven at 400, 500 and 600 οC for 4 hours.
Structure of nanoparticles was studied using X-ray
diffraction with CuKα (λ=1.54 Å) radiation. The shape and size of nanoparticles were investigated by scanning electron microscope images. Analyze for elemental was obtained using EDX. The optical properties of ZnO nanoparticles were analyzed using UV–Vis spectroscopy. The FTIR analysis performed in order to determine the materials existed in ZnO sample. FTIR studies are conducted on compressed
pills prepared by mixing ZnO powder with potassium bromide. The Raman-scattering experiments were carried out using a laser Raman at room temperature. The PL spectr
a were recorded
with a Photoluminescence spectrophotometer.
All the chemicals were used as received without further purifications. X-ray diffraction (XRD) patterns were recorded by a Philips X-ray diffractometer using Ni-filtered CuKα radiation. Scanning electron microscopy (SEM) images were obtained using a LEO instrument (Model 1455VP). Prior to taking images, the samples were coated by a very thin layer of Pt (BAL-TEC SCD 005 sputter coater) to make the sample surface conducting obtain better contrast and prevent charge accumulation.
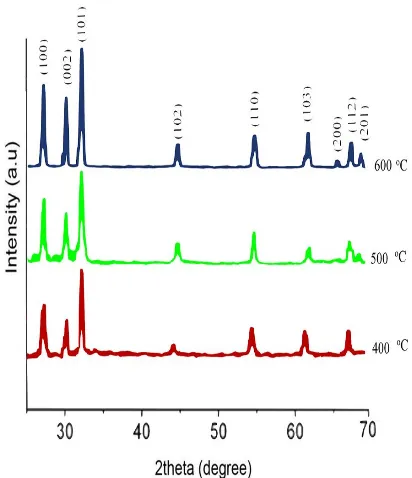
Fig. 1. XRD patterns of ZnO nanoparticles at calcined temperature in 400, 500 and 600 οC.
3. Results and discussion
crystalline structure and phase formation of zinc oxide nanoparticles. The nanoparticles crystallite size was calculated from X-ray line broadening using Debye–Scherrer equation [13]:
D=0.9λ/β Cosɵ (1)
where λ is the X-ray wavelength (CuKα radiation
equals to 1.54Å), θ is the Bragg diffraction angle, and β is the FWHM of the XRD peak appearing at
the diffraction angle θ. The crystallite sizes
calculated are about 31, 45 and 53 nm for the samples with calcined temperature in 400, 500 and 600 οC respectively.
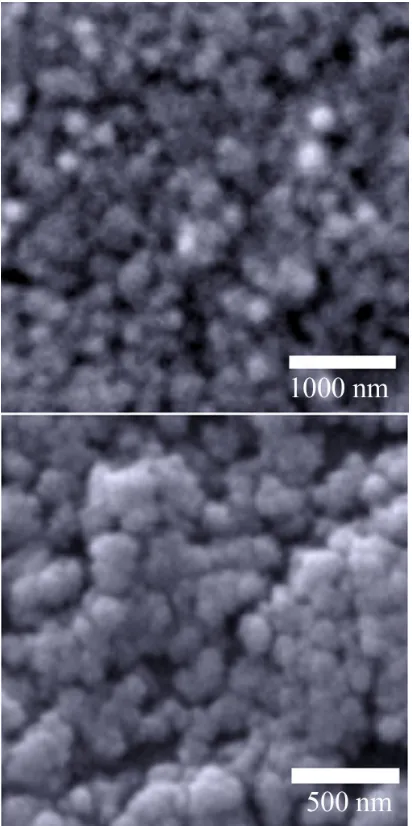
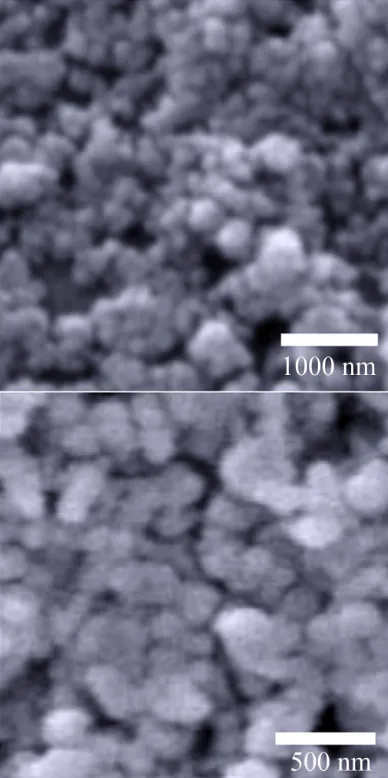
SEM images of ZnO with calcined temperature in 400, 500 and 600 οC are shown in Fig. 2.a – 2c, respectively. The images show that the ZnO nanocrystals are approximately spherical in shape with an average diameter less than of 80 nm which increases with increasing calcined temperature. At temperature of 400 οC the lowest nanoparticles and at temperature of 600 οC product with higher agglomeration were synthesized. It seems at higher temperatures growth stage is preferential compare to nucleation stage [18-22].
The chemical composition of the zinc oxide nanoparticles calcined at 500 οC was studied using EDX and is drawn in Fig. 3. The weight percentages of Zn and O are close to the stoichiometric this result confirms that the the ZnO nanoparticles contains only Zn and O elements.
Fig. 4 shows the FTIR spectrum of the ZnO
nanoparticles calcined at 500 °C. The peak at 451 cm−1 is the characteristic absorption of Zn–O bond. Other absorption peaks which corresponding the carboxylate and hydroxyl impurities in the materials. This result is a good agreement with other works [14,15].
Optical absorption spectra of samples calcined at 400, 500 and 600 οC using UV-Vis are indicated in Fig. 5. With annealing the
nanoparticles the absorption curve was shifted to longer wavelengths. This red-shift was associated with increasing the cluster dimensions.
Fig. 2a. SEM images of ZnO nanoparticles at calcined temperature in 400οC.
Fig. 2b. SEM images of ZnO nanoparticles at calcined temperature in 500 οC.
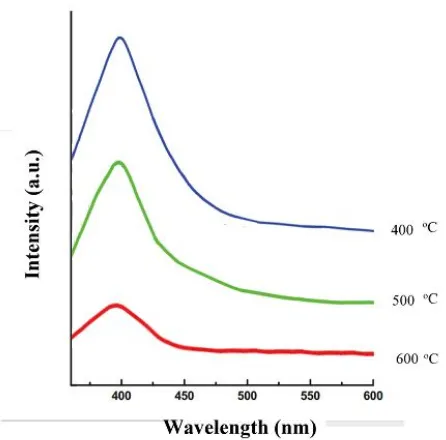
The room temperature PL spectra of ZnO nanoparticles calcined temperature in 400, 500 and 600 οC are shown in Fig. 7. The PL spectra exhibit a width emission at 390 nm. This photoluminescence peaks derive from the quantum size effect. Also the PL spectra indicate the PL intensity of the ZnO nanoparticles increases with increasing calcined temperature. This result is according to the other reports [21-22].
The ZnO nanoparticles synthesized using sol–gel method were calcined in 400, 500 and 600 οC. The
XRD spectra of nanoparticles determine the crystalline structure of zinc oxide. Debye–Scherrer equation indicates the crystallite sizes increasing with increased calcined temperature of samples. SEM images of ZnO nanocrystals have shown the grain size increases with increasing calcined temperature. The EDX represented nanoparticles contains only Zn and O elements. The FTIR spectrm of ZnO nanoparticles show the characteristic absorption of Zn–O bond.
Fig. 2c. SEM image of ZnO nanoparticles at calcined temperature in 600 οC.
good agreement with other works. The PL spectra indicate the PL intensity of the ZnO nanoparticles increases with increasing calcined temperature.
Fig. 3. EDX spectrum of ZnO nanoparticles at calcined temperature in 500 οC.
Fig. 4. FTIR spectrum of ZnO nanoparticles at calcined temperature in 500 οC.
Fig. 5. UV-Vis spectra of ZnO nanoparticles at calcined temperature in 400, 500 and 600 οC.
Fig. 7. Photoluminescence spectra of ZnO nanoparticles at calcined temperature at 400, 500 and 600 οC.
4
. Conclusion
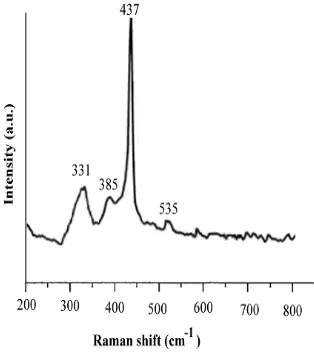
The ZnO nanoparticles were synthesized using sol– gel method at various calcined temperatures in 400, 500 and 600 οC. The XRD spectra of nanoparticles determine the crystalline structure of zinc oxide. Debye–Scherrer equation indicates the crystallite sizes increasing with increased calcined temperature of samples. SEM images of ZnO nanocrystals have shown the grain size increases with increasing calcined temperature. The EDX represented nanoparticles contains only Zn and O elements. The FTIR spectra of ZnO nanoparticles showed the characteristic absorption of Zn–O bond. At last, Optical absorption spectra of samples indicate a red shift with annealing the nanoparticles. The Raman spectrum of ZnO nanoparticles are shown the Raman peaks that in a good agreement with other works. The PL spectra indicate the PL intensity of the ZnO nanoparticles increases with increasing calcined temperature.
Acknowledgements
Authors are grateful to council of Arak University of Technology for providing financial support to undertake this work.
References
[1] Y. Li, L. Xu, X. Li, X. Shen, A. Wang, Applied Surface Science 256 (2010) 4543–4547.
[2] L. Bahadur, M. Hamdani, J.F. Koenig, P. Chartier, Solar Energy Mater. 14 (I986) 107. [3] N. A. Samat, R. M. Nor, Ceramics International 39 (2013) S545–S548.
[4] Z.S. Hu, G. Oskam, P.C. Searson, J. Colloid Interf. Sci. 263 (2003) 454–460.
[5] F.C.M. Van De Pol, Cer. Bull. 69,1990.1959. [6] A. Sharma, B.P. Singh, S. Dhar, A. Gondorf, M. Spasova, Surface Science 606 (2012) L13–L17. [7] J.H. Kim, W.C. Choi, H.Y. Kim, Y. Kang, Y.-K. Park, Powder Technol. 153 (2005) 166–175.
[8] S. Komarneni,M. Bruno, E.Mariani, Mater. Res. Bull. 35 (2000) 1843–1847.
[9] Z.R. Dai, Z.W. Pan, Z.L. Wang, , Adv. Funct. Mater. 13 (2003) 9–24.
[10] S.S. Alias, A.B. Ismail, A.A. Mohamad, J Alloys Compd 499 (2010) 231–237.
[11] T. Tani, L. Mädler, S.E. Pratsinis, J. Nanopart. Res. 4 (2002) 337–343.
[12] A. Erol, S. Okur, B. Comba, O. Mermer, M.C.
Arıkan, Sensors Actuators B145 (2010) 174–180. [13] K. Hedayati, G. Nabiyouni, Appl. Phys. A 116 (2014) 1605-1612.
[14] A. K. Zaka, W.H. Abd. Majid, M. Darroudi, R Yousefi, “Mater Lett 65 (2011) 70–73.
[15] R.Y. Hong, J.H. Li, L.L. Chen, D.Q. Liu, H.Z. Li, Y. Zheng, J. Ding, Powder Technology 189 (2009) 426–432.
[17] Z. Wang, H. Zhang, L. Zhang, J. Yuan, S. Yan, C.n Wang, Nanotechnology14(2003) 11–15. [18] G. Xiong, U. Pal, J. Garcia Serrano, J App Phys 101, (2007) 024317.
[19] L. Nejati-Moghadam, D. Ghanbari, M. Salavati-Niasari, A. Esmaeili-Bafghi-Karimabad , S. Gholamrezaei, J. Mater. Sci. Mater. Electron. 26 (2015) 6075-6082
[20] S. Gholamrezaei, M. Salavati-Niasari, D. Ghanbari, J Indus Eng Chem. 20 (2014) 3335-3341.
[21] P. Jamshidi, M. Salavati-Niasari, D. Ghanbari, H.R. Shams, J Clust Sci. 24 (2013) 1151-1162