Progress in Biological Sciences
Vol. 4, Number 2, Summer / Autumn 2014/245-260Automatic classification of highly related Malate
Dehydrogenase and L-Lactate Dehydrogenase based
on 3D-pattern of active sites
Received: 24 March, 2014; Accepted: 29 July, 2014
Amir Rahimi1,2, Armin Madadkar-Sobhani1,3 , RouzbehTouserkani4, BahramGoliaei1*
1. Department of Bioinformatics, Institute of Biochemistry and Biophysics, University of Tehran, Tehran, Iran 2. Department of Molecular Medicine, School of Advanced Medical Sciences and Technologies, Shiraz University of
Medical Sciences, Shiraz, Iran
3. Department of Life Sciences, Barcelona Supercomputing Center, Barcelona, Spain
4. School of Computer Sciences
,
Institute for Research in Fundamental Sciences (IPM), Tehran, IranAccurate protein function prediction is an important subject in bioinformatics, especially where sequentially and structurally similar proteins have different functions. Malate dehydrogenase and L-lactate dehydrogenase are two evolutionary related enzymes, which exist in a wide variety of organisms. These enzymes are sequentially and structurally similar and share common active site residues, spatial patterns and molecular mechanisms. Here, we study various features of the active site cavity of 229 PDB chain entries and try to classify them automatically by various classifiers including the support vector machine, k nearest neighbour and random forest methods. The results show that the support vector machine yields the highest predictive performance among mentioned classifiers. Despite very close and conserved patterns among Malate dehydrogenases and L-lactate dehydrogenases, the SVM predicts the function efficiently and achieves 0.973 Matthew’s correlation coefficient and 0.987 F-score. The same approach can be used in other enzyme families for automatic discrimination between homologous enzymes with common active site elements, however, acting on different substrates.
Keywords: active site pattern, L-lactate dehydrogenase, malate dehydrogenase, protein function prediction, spatial arrangement.
Introduction
Enzymes play essential roles in biochemical processes and catalyse various substrates and reactions (1, 2). Approximately, half of proteins have enzymatic properties (3). However, for only 5% of enzyme sequences in current databases, the functional annotations have been characterized experimentally (4-6). In keeping with the high costs of function determination via wet lab research, there is a large domain for computational methods to predict the functions of enzyme precisely. An important point in the computational protein function prediction is attention to the fact that simply transferring the annotation of the sequentially or structurally nearest protein to the unknown one may cause misannotation (7,8). The divergent evolution can cause variation in the reactions catalysed by homologous enzymes and conversely, similar reaction types and mechanisms can be achieved via convergent evolution (1, 9). Hence, significant sequential or structural similarities of two proteins are neither necessary nor sufficient evidence for having the same function (7, 8, 10). Among enzymes with pairwise sequence similarity above 50%, less than 30% have identical EC-numbers (11). Previous studies show that 10% of any pair of enzymes, even with 70% sequence identity, have different substrates (9). Therefore, determining the reaction type and the substrate specificity are two major aspects of the enzymes’ functional annotation (12). Enzymes tend to conserve the physiochemical properties of their active sites
to be able to distinguish between closely similar compounds quickly and specifically (2). Therefore, exploring function specific 3D-motifs in protein structures and evaluating physicochemical features of potential active or binding sites is a biologically sound way for precise function annotation (5, 13-15). In this category, recently, Nagao et al. have developed a new method of enzyme function prediction based on random forests (EFPrf), which predicts the fourth-digit level of the EC number in each CATH homologous superfamily (16); Rahimi et al. classified homologous enzymes by comparing their active site patterns to predefined representative templates for each EC number (7) and Erdin et al. used multiple templates per protein structure to improve the performance of the Evolutionary Trace Annotation (ETA) pipeline (5, 17, 18).
As a suitable case for such studies, malate dehydrogenase (MDH) and L-lactate dehydrogenase (L-LDH) are two evolutionary related enzymes with the same inherited active site elements and molecular mechanisms. The MDHs and the L-LDHs form a large super family, which play important roles in metabolic pathways and have been isolated and characterized from a wide variety of organisms (19). From the evolutionary aspect, these enzymes are highly related and have similar sequences and structures. As represented in Eq.1 and Eq.2, the MDHs and the L-LDHs catalyse the inter conversion of 2-hydroxy acids to the corresponding 2-keto acids using NAD as a cofactor (20).
MDH
(1) (S)-malate + NAD(+) oxaloacetate + NADH
LDH
The MDHs exist across three domains of life from Archaea to human and catalyse the reversible oxidation of malate to oxaloacetate (EC number 1.1.1.37) (21). The reaction depends on the oxidation/reduction of NAD as cofactor. The positively charged NAD+ acts as a hydride acceptor in the oxidation reaction, and the NADH provides the hydride for reduction of oxaloacetate to malate in the reverse reaction. The MDHs are key parts of the citric acid cycle within the mitochondrial matrix and the prokaryotic cytoplasm and also in the malate/aspartate shuttle across the mitochondrial membrane (20,21). The L-LDHs have been found in Eukarya and Bacteria but not in Archaea (22). The L-LDH catalyses the interconversion of L-lactate and pyruvate associated with the interconversion of NADH and NAD+ (EC number 1.1.1.27). In the forward direction, a proton is taken from lactate and a hydride donated to NAD+. In the reverse direction, a proton is donated to pyruvate, and a hydride ion abstracted from NADH.
The interesting aspect of MDH and LDH evolution is that at least two ancestral gene duplications are needed to explain the main functional distribution through the phylogenetic tree of these enzymes (19, 22). According to the phylogenetic studies, this superfamily can be divided into three main clades including dimeric MDHs, tetrameric L-LDHs and [LDH-like] MDHs (19, 21). Furthermore, recent functional changes between MDH and LDH have been reported to occur in nature. For example, the LDH in trichomonads most likely evolved in recent events of gene duplication from their cytosolic dimeric MDH (23). Consequently, transferring the annotation of the sequentially nearest enzyme to an unannotated protein may cause misannotation especially in the dehydrogenase superfamily.
In this study, various physicochemical features have been extracted from the active site cavities of several MDHs and L-LDHs and then, the capability of these features in discriminating between MDHs and L-LDHs have been tested using various classifiers.
Materials and Methods
Structures and active sites
MDHs too. As a result, we considered the Histidine-Arginine-Aspartate triad as active elements for both MDHs and L-LDHs. The structures with mutation in their active site elements were excluded in this study. Therefore, all the enzymes have the Asp-Arg-His triad in their active site.
Feature Vectors construction
All protein structures were preprocessed by PDB2PQR version 1.7(32) to convert the PDB file format to PQR. This software complements the original PDB files with missing atoms and hydrogens and also adds the charge and radius of each atom. The PDB2PQR was set to use AMBER99 force field (33) and not to optimize hydrogen bonding network.
In order to construct a feature vector for each active site entry, various properties were extracted from the active site cavities including the spatial arrangement of functional elements, hydrophobicity, charge and the volume of the cavity. To represent the spatial arrangement of functional elements, the Euclidean distance between the spatial positions of the active site residues were calculated based on the alpha carbon coordinates of each residue.
For extracting other features from the active site cavity, a hypothetical sphere of radius 5Å centred at the mean point of the active site elements was drawn. The radius of the sphere was compromised experimentally to gather maximum information and minimum noise. The total hydrophobicity index of each active site entry was equal to sum of the hydrophobicity indexes of all residues, which have at least one heavy atom in the aforementioned sphere. The value of hydrophobicity index for each residue at pH=7 were set as suggested by Monera et al. (34). In addition, the sum of all positively and negatively charged heavy atoms within the supposed sphere were measured as “Positive charge” and “Negative charge”, respectively, and considered as two features of the active site cavity.
To estimate the total volume of each active site cavity, the volume of every heavy atom, which occupies the abovementioned sphere, was subtracted from the whole volume (Eq.3). In cases where atoms partially overlap with the sphere, the volume of the joint lens was calculated using Eq.4.
(3)
(4)
In sum, for each active site entry seven
All features were normalized by scaling between -1 and 1 by the min-max normalization method.
Classifiers
In this study, three popular classifiers including the support vector machine (SVM), k nearest neighbours (kNN) and random forest methods with different classification strategies have been tested for efficiently categorizing the enzymes according to function. In order to implement the classifiers, Orange version 2.6.1 (35) was
used, which is an open source data mining toolbox. Orange embeds a popular implementation of SVM in LIBSVM package (36). Table 1 shows the optimized parameters used for the SVM classifier of this study. The kNN was adjusted to use Euclidian distance and k = 3. We tried to adjust these parameters to achieve maximum performance.
The random forest included 100 trees according to (37, 38), which consider m random features at each split. The m was equal to square root of number of attributes in the data set as suggested by (38).
Table 1. The optimum parameters for SVM classifier
Data normalization [-1,1]
Kernel RBF, g=0.50
Cost (C) 1.0
Numeric precision 0.0015 Complexity bound (nu) 0.15
Sequence alignment and
phylogenetic tree
The Uniprot ID for each protein structure was taken from the CSA, and the corresponding sequence was downloaded from Uniprot at http://www.uniprot.org/ (39). In order to provide some insight into the evolutionary relationship between malate dehydrogenases and L-lactate dehydrogenases, the multiple sequence alignment was performed using Clustal Omega version 1.2.1 (40-42). The phylogenetic tree was drawn using a neighbour joining algorithm without distance correction and based on sequence identity.
Classification evaluation
In this study, the Jackknife cross-validation test was used to estimate the effectiveness of the predictors in practical application. As explained in (43) the Jackknife test is regarded as the least arbitrary in comparison with other cross-validation tests, such as the independent dataset test and subsampling test and can always return a unique result for a given benchmark dataset. Hence, the Jackknife test has been widely used by investigators to examine the quality of various predictors (44-52). The prediction performances were evaluated by F-score (Eq.5) and Matthew’s Correlation Coefficient (Eq.6).
(5) F 2TP
2TP FP FN
(6) MCC TP TN FP FN
(TP FP)(TP FN)(TN FP)(TN FN)
The F-score is the harmonic mean of precision and recall and reaches its best value at 1 and worst score at 0. As there is no greater priority for any classes of this study, the average F-score of different classes is reported. The MCC is a correlation coefficient between the observed and predicted binary classifications and returns a value between −1 and +1 where a coefficient of +1 indicates a perfect prediction, 0 not better than random prediction and −1 means overall disagreement between prediction and observation. Thus, the MCC can be used as a balanced measure even if the size of the classes is very different (7).
In addition, the Receiver Operating Characteristic (ROC) curves were plotted for each classifier (supplementary Fig.1) in which the true positive rate (Sensitivity) is plotted in the function of the false positive rate (1-Specificity). In this measure, a test with perfect discrimination has a ROC curve that passes through the upper left corner (100% sensitivity, 100% specificity). Therefore, the closer the ROC curve to the upper left corner the higher the accuracy of the test. Theoretically, the shape of the ROC curve depends on selecting the target class. Since there is no greater priority between different classes of this study to be considered as a positive group, for each target class a distinct ROC plot was drawn.
Results and Discussion
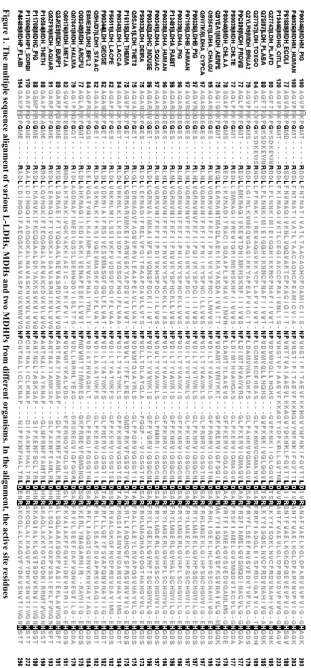
The amino acid sequence analysis (Fig.1 and
Fig.2) reveals that MDHs and L-LDHs have an intermixed evolution. The mitochondrial MDH of eukaryotes (e.g., Human [Uniprot ID=P40926]) is highly identical to some eubacteria MDH (e.g., Escherichia coli [Uniprot ID=P61889]). On the other hand, cytosolic MDH of eukaryotes (e.g., Pig
[Uniprot ID=P11708]) has a relatively high sequence similarity to the MDH from chloroplasts (e.g., Sorghum [Uniprot ID=P17606]) and some other eubacteria (e.g., Thermusthermophilus [Uniprot ID=P10584]) (20, 29). This interpretation is in keeping with the theory of endosymbiosis for the origin of mitochondria and chloroplast. In addition, it can be perceived from Figure 2 that the archaeal MDHs (e.g., Aeropyrumpernix [Uniprot ID=Q9YEA1] and Haloarculam arismortui [Uniprot ID=Q07841]) are intermixed with L-LDHs. Previous crystallographic studies showed that archaeal MDHs have more structural similarity to tetrameric L-LDHs rather than to dimeric MDHs (53-55) and consequently are identified as [LDH-like] MDHs.
Fi
gure
1.
Th
e mu
lti
ple
sequ
ence
a
li
gnment of
vari
ous
L
-LDHs,
MDHs
and
two M
DHPs
fro
m
different or
ganis
ms.
In
the
ali
gnment,
the
ac
tive
sit
e re
sid
ue
s
(ac
cor
din
g
to
th
e
CS
A) ar
e high
li
ghted and
the
most e
ffe
cti
ve
r
esidu
e
in s
ub
strate
sp
ec
if
ic
ity
is
Figure2. The phylogenetic tree of various L-LDHs, MDHs and two MDHPs from different organisms.The tree is drawn using neighbor joining algorithm and based on sequence identity.
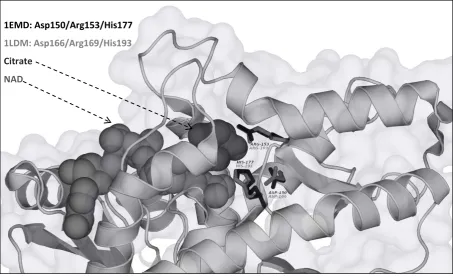
The structural analysis shows that the spatial arrangement of these residues is conserved too. Figure 3 demonstrates a schematic view of the MDH active site from E.coli coupled with NAD as a cofactor and Citrate as a substrate analogue (PDB structure 1EMD) in contrast to the spatial arrangement of active site elements of L-LDH from spiny dogfish (PDB structure 1LDM).
As elucidated in Figure 3, the spatial arrangements of Histidine-Arginine-Aspartate triad are completely identical in MDH and L-LDH. Previous studies show that using 3D-templates and geometrical constraints cannot efficiently separate these enzymes according
to their EC-numbers and the maximum achieved MCC equals to 0.5 (7). Therefore, other properties of the active site cavities, such as charge, unoccupied free space and hydrophobicity have been evaluated.
Figure 3. A schematic view of PDB structure 1EMD which shows the MDH active site from E.coli coupled with NAD as cofactor and Citrate as substrate analog. The active site residues of the MDH are shown in black and the
superimposed corresponding residues of L-LDH from Squalusacanthias (PDB structure 1LDM) are shown in
gray.The image was created by PyMOL(66).
Figure 4. The classification performance of different classifiers. The Nearest Sequence method uses sequence information and the random forest, kNN and SVM use structural features.
1EMD: Asp150/Arg153/His177
1LDM: Asp166/Arg169/His193
Citrate
According to the Gini index (56, 57) the top three discriminative features were “Free Space”, “Hydrophobicity” and “Negative charge”. The Jackknife cross-validation test and ROC curve analysis reveal that the SVM has slightly superior classification performance in comparison. The SVM is a popular classification method, which has been successfully utilized for many computational tasks in bioinformatics (58-65). This technique often yields the highest predictive performance results by constructing a hyperplane in the attribute space, which maximizes the margin between the instances of different classes. The SVM has regularization parameters which make it possible to avoid over-fitting. Furthermore, utilizing the appropriate kernel function facilitates the separation of different classes and improves the classification performance. In this study, the RBF kernel (Radius Based Function) had superior exploitation in comparison with Linear or Sigmoid kernels.
The results also show that function annotation based on structural features is
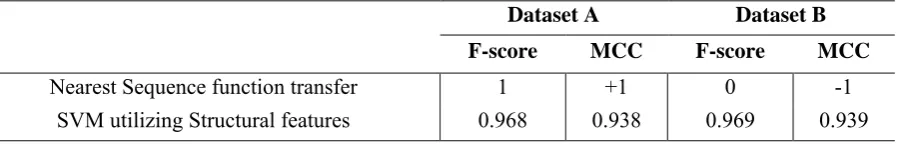
more efficient than transferring the annotation of the sequentially nearest enzyme to a query one (Fig.4). That is due to the fact that the evolution of the dehydrogenase superfamily is complex and functional changes between MDH and LDH have been reported to occur several times in nature (Madern, 2002; Madern et al., 2004; Wu et al., 1999) and also by few mutations in lab conditions (Wilks et al., 1988). In addition, the performance of sequence-based methods completely depends on the selected dataset and is not very robust. For example, let us assume dataset A (including Uniprot IDs: E8ME30, Q9YEA1, P00343, P80040, Q60176 and Q2YLR9) and dataset B (including Uniprot IDs: P16115, Q27743, O08349, P40926, Q2YLR9 and Q60176); Transferring the EC number of the sequentially nearest enzyme to the query protein (by leaving one procedure out) yields 100% correct answers in dataset A and 100% wrong answers in dataset B. However, the performance of the structure-based method of this paper is robust and stays stable for both datasets A and B (Table 2).
Table 2.Comparison of the performance stability of sequence based and structure based methods on different datasets
Dataset A Dataset B F-score MCC F-score MCC
Nearest Sequence function transfer 1 +1 0 -1
SVM utilizing Structural features 0.968 0.938 0.969 0.939
Conclusion
Through enzyme evolution, the physicochemical properties of the active site microenvironment may change not only by mutations in the functional elements, but also by the mutations of surrounding residues, which may affect the substrate specificity and generate new enzymes. MDHs and L-LDHs are evolutionary related enzymes with conserved functional elements and mutable
MDHs and L-LDHs by SVM classifier. The results showed that protein function prediction based on a 3D pattern of active site is efficient and robust. This approach is applicable in studying other enzyme families.
However, it should be mentioned that applying the same approach in other enzyme families may result in different performances and should be optimized on a per case basis..
Supplementary Figure 1A
Supplementary Figure 1B
1. Almonacid, D.E. and Babbitt, P.C. (2011) Toward mechanistic classification of enzyme functions.
Current Opinion in Chemical Biology, 15, 435-442.
2. Weng, Y.Z., Chang, D.T.H., Huang, Y.F. and Lin, C.W. (2011) A study on the flexibility of enzyme active sites. BMC Bioinformatics, 12.
3. Wang, Y.C., Wang, Y., Yang, Z.X. and Deng, N.Y. (2011) Support vector machine prediction of enzyme function with conjoint triad feature and hierarchical context. BMC Systems Biology, 5, S6. 4. Valencia, A. (2005) Automatic annotation of protein function. Curr Opin Struct Biol, 15, 267-274. 5. Erdin, S., Venner, E., Lisewski, A.M. and Lichtarge, O. (2013) Function prediction from networks
of local evolutionary similarity in protein structure. BMC Bioinformatics, 14, S6.
6. The-UniProt-Consortium (2012) Reorganizing the protein space at the Universal Protein Resource (UniProt). Nucleic Acids Res, 40, D71-75.
7. Rahimi, A., Madadkar-Sobhani, A., Touserkani, R. and Goliaei, B. (2013) Efficacy of function specific 3D-motifs in enzyme classification according to their EC-numbers. J Theor Biol, 336, 36-43.
8. Punta, M. and Ofran, Y. (2008) The rough guide to in silico function prediction, or how to use sequence and structure information to predict protein function. PLoS Computational Biology, 4, e1000160.
9. Erdin, S., Lisewski, A.M. and Lichtarge, O. (2011) Protein function prediction: towards integration of similarity metrics. Current Opinion in Structural Biology, 21, 180-188.
10. Whisstock, J.C. and Lesk, A.M. (2003) Prediction of protein function from protein sequence and structure. Q Rev Biophys, 36, 307-340.
11. Rost, B. (2002) Enzyme function less conserved than anticipated. Journal of Molecular Biology, 318, 595-608.
12. Röttig, M., Rausch, C. and Kohlbacher, O. (2010) Combining structure and sequence information allows automated prediction of substrate specificities within enzyme families. PLoS Computational Biology, 6, e1000636.
13. Laskowski, R.A., Watson, J.D. and Thornton, J.M. (2005) Protein function prediction using local 3D templates. Journal of Molecular Biology, 351, 614-626.
14. Torrance, J.W., Bartlett, G.J., Porter, C.T. and Thornton, J.M. (2005) Using a Library of Structural Templates to Recognise Catalytic Sites and Explore their Evolution in Homologous Families.
Journal of Molecular Biology, 347, 565-581.
15. Konc, J. and Janežič, D. (2014) Binding site comparison for function prediction and pharmaceutical discovery. Current Opinion in Structural Biology, 25, 34-39.
17. Erdin, S., Ward, R.M., Venner, E. and Lichtarge, O. (2010) Evolutionary Trace Annotation of Protein Function in the Structural Proteome. Journal of Molecular Biology, 396, 1451-1473. 18. Ward, R.M., Venner, E., Daines, B., Murray, S., Erdin, S., Kristensen, D.M. and Lichtarge, O.
(2009) Evolutionary trace annotation server: Automated enzyme function prediction in protein structures using 3D templates. Bioinformatics, 25, 1426-1427.
19. Madern, D. (2002) Molecular evolution within the L-malate and L-lactate dehydrogenase super-family. J Mol Evol, 54, 825-840.
20. Minarik, P., Tomaskova, N., Kollarova, M. and Antalik, M. (2002) Malate dehydrogenases--structure and function. Gen Physiol Biophys, 21, 257-265.
21. Kawakami, R., Sakuraba, H., Goda, S., Tsuge, H. and Ohshima, T. (2009) Refolding, characterization and crystal structure of (S)-malate dehydrogenase from the hyperthermophilic archaeon Aeropyrum pernix. Biochim Biophys Acta, 1794, 1496-1504.
22. Madern, D., Cai, X., Abrahamsen, M.S. and Zhu, G. (2004) Evolution of Cryptosporidium parvum lactate dehydrogenase from malate dehydrogenase by a very recent event of gene duplication. Mol Biol Evol, 21, 489-497.
23. Wu, G., Fiser, A., ter Kuile, B., Sali, A. and Muller, M. (1999) Convergent evolution of Trichomonas vaginalis lactate dehydrogenase from malate dehydrogenase. Proc Natl Acad Sci U S A, 96, 6285-6290.
24. Berman, H.M., Westbrook, J., Feng, Z., Gilliland, G., Bhat, T.N., Weissig, H., Shindyalov, I.N. and Bourne, P.E. (2000) The Protein Data Bank. Nucleic Acids Res, 28, 235-242.
25. Laskowski, R.A. (2011) Protein Structure Databases. Molecular Biotechnology, 48, 183-198. 26. Porter, C.T., Bartlett, G.J. and Thornton, J.M. (2004) The Catalytic Site Atlas: a resource of
catalytic sites and residues identified in enzymes using structural data. Nucleic Acids Research, 32, D129-D133.
27. Hall, M.D. and Banaszak, L.J. (1993) Crystal structure of a ternary complex of Escherichia coli malate dehydrogenase citrate and NAD at 1.9 A resolution. J Mol Biol, 232, 213-222.
28. Birktoft, J.J. and Banaszak, L.J. (1983) The presence of a histidine-aspartic acid pair in the active site of 2-hydroxyacid dehydrogenases. X-ray refinement of cytoplasmic malate dehydrogenase. J Biol Chem, 258, 472-482.
29. Goward, C.R. and Nicholls, D.J. (1994) Malate dehydrogenase: a model for structure, evolution, and catalysis. Protein Sci, 3, 1883-1888.
30. Abad-Zapatero, C., Griffith, J.P., Sussman, J.L. and Rossmann, M.G. (1987) Refined crystal structure of dogfish M4 apo-lactate dehydrogenase. J Mol Biol, 198, 445-467.
31. Birktoft, J.J., Rhodes, G. and Banaszak, L.J. (1989) Refined crystal structure of cytoplasmic malate dehydrogenase at 2.5-A resolution. Biochemistry, 28, 6065-6081.
32. Dolinsky, T.J., Nielsen, J.E., McCammon, J.A. and Baker, N.A. (2004) PDB2PQR: an automated pipeline for the setup of Poisson-Boltzmann electrostatics calculations. Nucleic Acids Res, 32, W665-667.
(RESP) model perform in calculating conformational energies of organic and biological molecules? Journal of Computational Chemistry, 21, 1049-1074.
34. Monera, O.D., Sereda, T.J., Zhou, N.E., Kay, C.M. and Hodges, R.S. (1995) Relationship of sidechain hydrophobicity and alpha-helical propensity on the stability of the single-stranded amphipathic alpha-helix. J Pept Sci, 1, 319-329.
35. Demšar, J., Curk, T., Erjavec, A., Gorup, Č., Hočevar, T., Milutinović, M., Možina, M., Polajnar, M., Toplak, M. and Starič, A. (2013) Orange: data mining toolbox in Python. Journal of Machine Learning Research, 14, 2349-2353.
36. Chang, C.-C. and Lin, C.-J. (2011) LIBSVM: A library for support vector machines. ACM Trans. Intell. Syst. Technol., 2, 1-27.
37. Oshiro, T.M., Perez, P.S. and Baranauskas, J.A. (2012), In Machine Learning and Data Mining in Pattern Recognition. Springer, pp. 154-168.
38. Genuer, R., Poggi, J.-M. and Tuleau, C. (2008) Random Forests: some methodological insights.
arXiv preprint arXiv:0811.3619.
39. UniProtConsortium (2013) Update on activities at the Universal Protein Resource (UniProt) in 2013. Nucleic Acids Res, 41, D43-47.
40. McWilliam, H., Li, W., Uludag, M., Squizzato, S., Park, Y.M., Buso, N., Cowley, A.P. and Lopez, R. (2013) Analysis Tool Web Services from the EMBL-EBI. Nucleic Acids Res, 41, W597-600. 41. Goujon, M., McWilliam, H., Li, W., Valentin, F., Squizzato, S., Paern, J. and Lopez, R. (2010) A
new bioinformatics analysis tools framework at EMBL-EBI. Nucleic Acids Res, 38, W695-699. 42. Sievers, F., Wilm, A., Dineen, D., Gibson, T.J., Karplus, K., Li, W., Lopez, R., McWilliam, H.,
Remmert, M., Soding, J. et al. (2011) Fast, scalable generation of high-quality protein multiple sequence alignments using Clustal Omega. Mol Syst Biol, 7, 539.
43. Chou, K.C. (2011) Some remarks on protein attribute prediction and pseudo amino acid composition. J Theor Biol, 273, 236-247.
44. Cao, J.Z., Liu, W.Q. and Gu, H. (2012) Predicting viral protein subcellular localization with Chou's pseudo amino acid composition and imbalance-weighted multi-label K-nearest neighbor algorithm. Protein Pept Lett, 19, 1163-1169.
45. Chen, Y.K. and Li, K.B. (2013) Predicting membrane protein types by incorporating protein topology, domains, signal peptides, and physicochemical properties into the general form of Chou's pseudo amino acid composition. J Theor Biol, 318, 1-12.
46. Chou, K.C. (2001) Prediction of protein cellular attributes using pseudo-amino acid composition.
Proteins, 43, 246-255.
47. Qiu, J.D., Huang, J.H., Shi, S.P. and Liang, R.P. (2010) Using the concept of Chou's pseudo amino acid composition to predict enzyme family classes: an approach with support vector machine based on discrete wavelet transform. Protein Pept Lett, 17, 715-722.
49. Lin, H. (2008) The modified Mahalanobis Discriminant for predicting outer membrane proteins by using Chou's pseudo amino acid composition. J Theor Biol, 252, 350-356.
50. Shi, S.P., Qiu, J.D., Sun, X.Y., Suo, S.B., Huang, S.Y. and Liang, R.P. (2012) A method to distinguish between lysine acetylation and lysine methylation from protein sequences. J Theor Biol, 310, 223-230.
51. Sahu, S.S. and Panda, G. (2010) A novel feature representation method based on Chou's pseudo amino acid composition for protein structural class prediction. Comput Biol Chem, 34, 320-327. 52. Moosavi, S., Rahgozar, M. and Rahimi, A. (2013) Protein function prediction using neighbor
relativity in protein-protein interaction network. Comput Biol Chem, 43, 11-16.
53. Richard, S.B., Madern, D., Garcin, E. and Zaccai, G. (2000) Halophilic adaptation: novel solvent protein interactions observed in the 2.9 and 2.6 A resolution structures of the wild type and a mutant of malate dehydrogenase from Haloarcula marismortui. Biochemistry, 39, 992-1000. 54. Lee, B.I., Chang, C., Cho, S.J., Eom, S.H., Kim, K.K., Yu, Y.G. and Suh, S.W. (2001) Crystal
structure of the MJ0490 gene product of the hyperthermophilic archaebacterium Methanococcus jannaschii, a novel member of the lactate/malate family of dehydrogenases. J Mol Biol, 307, 1351-1362.
55. Dalhus, B., Saarinen, M., Sauer, U.H., Eklund, P., Johansson, K., Karlsson, A., Ramaswamy, S., Bjork, A., Synstad, B., Naterstad, K. et al. (2002) Structural basis for thermophilic protein stability: structures of thermophilic and mesophilic malate dehydrogenases. J Mol Biol, 318, 707-721.
56. Ceriani, L. and Verme, P. (2012) The origins of the Gini index: extracts from Variabilità e Mutabilità (1912) by Corrado Gini. The Journal of Economic Inequality, 10, 421-443.
57. Gini, C. (1997) Concentration and dependency ratios. Rivista di Politica Economica, 87, 769-792. 58. Zakeri, P., Moshiri, B. and Sadeghi, M. (2011) Prediction of protein submitochondria locations
based on data fusion of various features of sequences. J Theor Biol, 269, 208-216.
59. Yahalom, R., Reshef, D., Wiener, A., Frankel, S., Kalisman, N., Lerner, B. and Keasar, C. (2011) Structure-based identification of catalytic residues. Proteins-Structure Function and Bioinformatics, 79, 1952-1963.
60. Wang, Y.C., Wang, Y., Yang, Z.X. and Deng, N.Y. (2011) Support vector machine prediction of enzyme function with conjoint triad feature and hierarchical context. BMC Syst Biol, 5 Suppl 1, S6.
61. Wang, T., Xia, T. and Hu, X.M. (2010) Geometry preserving projections algorithm for predicting membrane protein types. J Theor Biol, 262, 208-213.
62. Tong, W., Williams, R.J., Wei, Y., Murga, L.F., Ko, J. and Ondrechen, M.J. (2008) Enhanced performance in prediction of protein active sites with THEMATICS and support vector machines.
Protein Science, 17, 333-341.
63. Sonavane, S. and Chakrabarti, P. (2010) Prediction of Active Site Cleft Using Support Vector Machines. Journal of Chemical Information and Modeling, 50, 2266-2273.
residues from protein structure using support vector machine with sequence and structural features. Biochem Bioph Res Co, 367, 630-634.
65. Mohabatkar, H., Beigi, M.M., Abdolahi, K. and Mohsenzadeh, S. (2013) Prediction of allergenic proteins by means of the concept of Chou's pseudo amino acid composition and a machine learning approach. Med Chem, 9, 133-137.