A new approach for Modeling and Evaluation of efficiency and power generation in
Stirling engine; Analytical study
H. Saberinejada, A. Keshavarz*b, M. Bastamic, M. Payandehdoosta
a PhD Student, Faculty of mechanical engineering, K.N. Toosi university of Technology, b Professor , Faculty of mechanical engineering, K.N. Toosi university of Technology, c Master science , Faculty of mechanical engineering, K.N. Toosi university of Technology,
Abstract
Although the Stirling engine (SE) had been invented many years ago, the investigation on it is still going
on among many researches due to variety of input energy resources such as, solar energy, fossil fuel, biomass and geothermal energy. In this paper, the thermodynamic cycle of a Stirling engine is analyzed by employing a new analytical model. A new method is presented to evaluate the output power and efficiency of real Stirling engines. In this method, correcting functions are applied on the Schmidt equations to achieve more accurate results with respect to the adiabatic model. This approach eliminates the numerical procedures as well as the iterative solver. It is also able the results to achieve more accuracy with open-form solution. A non-linear regression is peropen-formed on the Schmidt equations to achieve the correctness factors. The correctness factors are function of structural and operational characteristics of the engine. Moreover, available output data of GPU-3 SE was compared with the results of this model. The comparison indicates that the model results are in good agreement with the SE output. Thus, this model may use as an appropriate method for modeling the Stirling engines outputs.Keywords:Stirling engine, analytical solution, non-linear regression, thermodynamic analysis
1. Introduction
Stirling engine (SE) is one of the most important green-energy technologies. Due to many advantages, this old invention recently fascinates many researchers in industrial and academic centers [1-4]. Some of the these advantages are: low noise, high thermal efficiency, requiring little maintenance, low level of toxic emission if used by fuel and being pliable to use almost any kind of heat source. Despite some disadvantages existed in SEs, currently they are successfully applied in the micro combined heat and power (CHP) system and power generation. Inability to rapidly change the power, lower power to weight ratio and exclusive technology has hindered the application of SEs in more general fields. In the event that these problems are solved by new researches, this old invention might become more common in future.
Generally, the thermodynamic analysis of SE can be classified to open-form (implicit equations) and closed-form solutions (explicit equations).
The Schmidt solution is the most prominent closed-form solution to analyze SE [5]. Considerable efforts have been made to develop and improve the Schmidt analysis considering engine losses [6-8].
The adiabatic analysis is an open-form method. In this method, the whole workspaces of engine are considered adiabatic and the heat transfer occurs only in cold and hot heat exchangers. The working fluid leaves the cold and hot heat exchangers exactly with the same temperature, respectively. In such methods the heat regenerating process is assumed to be ideal. Solving of adiabatic models always needs cyclic numerical integration and developing of computational programs. The adiabatic model is closer to reality compared to isothermal model for engines and usually leads to more accurate results. Timumi et al [9] tried to develop the adiabatic method by dividing the engine to five parts. They obtained more accurate results to predict the SE
performance in comparison to adiabatic method [9]. Also, many researches have been made to develop and improve the adiabatic analysis considering engine losses [4, 10, 11].
In addition to thermodynamic analysis of SE, numerical methods with high computational cost are introduced recently to evaluate the performance of different part of SE [12-14] .
The motivation of this research is introducing a new method based on Schmidt model to predict actual behavior of SE with low computational cost and accuracy close to adiabatic method. According to authors best knowledge, no development of Schmidt model based on correction of effective parameters is done up to now. Also no closed-form (explicit) method which simulates SE with accuracy of adiabatic method has been presented. Also, this new approach has been evaluated by GPU-3 SE data.
2. Mathematical model
In this part, structural components and thermo-fluid processes of engine are assumed to be ideal and heat input and output power of engine are calculated by corrected equations. To find the correcting functions, the results of adiabatic model are set as the appropriate outcome and then it is tried to match the results of primary model to it.
The Schmidt model assumes sinusoidal variation for working volume in engine cylinders and presents equations (1-2) to calculate output power and efficiency of engine. Equations (1-6) explain Schmidt method for SE. The details of Schmidt and adiabatic method are presented in references[5, 15].
(1)
(2) [ ( ) ( ) ] (3)
Where, S is defined as follow
⁄
(4)
So, using differentials of working volume, the expansion and compression work in a cycle is calculated as:
√
⁄
(5)
√ ⁄ (6)
√ ⁄ (7)
In the above equations,
are given
by: √ (8) ( ) ( ) (9) (( ) ( )
⁄ ) (10)
√
(11)
Where, , are crank angle, phase angle
between compression and expansion spaces, sweep and dead volume respectively. Subscripts of ‘c’ and ‘e’ denote the compression and expansion.
The correcting process is employed to reach the accuracy of adiabatic second order computational methods. To this end, correctness functions are employed.
To define and exactly apply the correctness functions, the effective parameters on output power and engine efficiency should be specified. According to equation (7), such parameters are mean working pressure of engine, expanding displacement volume, phase lag angle, temperature ratio and dead volume. As the effects of and for both isothermal and adiabatic models are linear, they cannot be the main source of error in obtained results of isothermal method in comparison with adiabatic method. So correctness functions are considered for three other non-linear parameters.
The suggested correlations for output power and efficiency are as follows:
( ) ( √ ⁄ )
(12)
( ) (13)
In this equation, F and G are correcting factors which are functions of phase lag angle of engine ( ), temperature ratio of cold to hot source ( ) and dead to compression volume ratio ( ).
To completely cover the range of different parameters in real engines, in each investigation, five quantitative levels is considered for all three mentioned parameters. So to apply regression to the equation of each correctness function, a sample size
H. Saberinejad, A. Keshavarz, M. Bastami and M. Payandehdoost 2328
the beginning, the Schmidt equation is solved based on the value of triple parameters. Then, with such data the adiabatic model is solved by using numerical code which is developed in MATLAB software. Finally by dividing the results of adiabatic model and Schmidt model, the amount of sample data for each correctness function is obtained. So for obtaining sample data to regression the correctness functions,
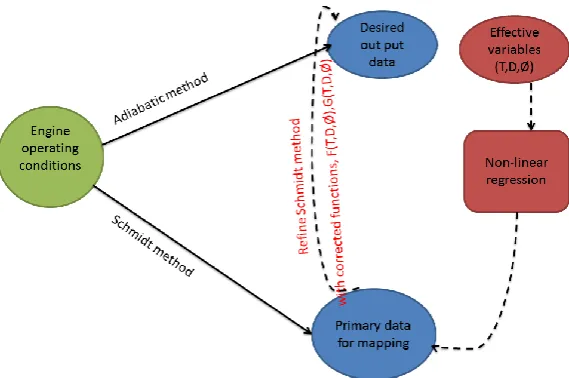
each of Schmidt and adiabatic models are solved 250 times. Fig.1 shows the mathematical model of presented method schematically. Part of data used in calculating correctness functions are listed in table 1.
.
Fig1. Schematic of the proposed approach to modeling SE
Table 1.Sample data for calculated correctness functions
NO TC [k]
TH [k] T=TC/TH φ D=DV/VC η (Schmidt)
η (Adiab)
W(Schmidt) [W]
W(Adiab) [W]
F G
1 294 1176 0.25 75 1.0 0.75 0.617 9078.20 9009.21 0.99240 0.82267
2 294 1176 0.25 75 1.3 0.75 0.645 7683.44 8034.37 1.04567 0.86000
3 294 1176 0.25 75 1.6 0.75 0.662 6689.11 7211.83 1.07814 0.88267
4 294 1176 0.25 75 1.9 0.75 0.674 5931.79 6524.97 1.10000 0.89867
5 294 1176 0.25 75 2.2 0.75 0.682 5329.61 5946.15 1.11568 0.90933
121 294 653 0.45 135 1.0 0.55 0.375 3895.34 4577.28 1.17507 0.68182
122 294 653 0.45 135 1.3 0.55 0.407 3251.75 4126.90 1.26913 0.74000
123 294 653 0.45 135 1.6 0.55 0.427 2802.69 3708.07 1.32304 0.77636
124 294 653 0.45 135 1.9 0.55 0.440 2466.16 3347.60 1.35741 0.80000
125 294 653 0.45 135 2.2 0.55 0.449 2202.00 3040.48 1.38078 0.81636
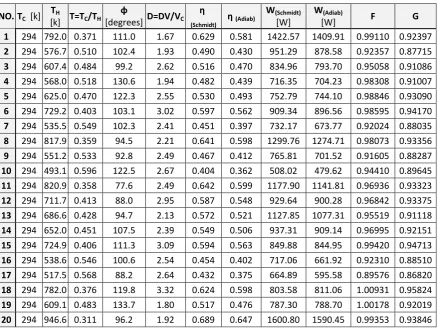
Table 2. Sample data for calculated corrected functions (F, G)
NO. TC [k] TH
[k] T=TC/TH φ
[degrees] D=DV/VC
η
(Schmidt) η(Adiab)
W(Schmidt) [W]
W(Adiab)
[W] F G
1 294 792.0 0.371 111.0 1.67 0.629 0.581 1422.57 1409.91 0.99110 0.92397
2 294 576.7 0.510 102.4 1.93 0.490 0.430 951.29 878.58 0.92357 0.87715
3 294 607.4 0.484 99.2 2.62 0.516 0.470 834.96 793.70 0.95058 0.91086
4 294 568.0 0.518 130.6 1.94 0.482 0.439 716.35 704.23 0.98308 0.91007
5 294 625.0 0.470 122.3 2.55 0.530 0.493 752.79 744.10 0.98846 0.93090
6 294 729.2 0.403 103.1 3.02 0.597 0.562 909.34 896.56 0.98595 0.94170
7 294 535.5 0.549 102.3 2.41 0.451 0.397 732.17 673.77 0.92024 0.88035
8 294 817.9 0.359 94.5 2.21 0.641 0.598 1299.76 1274.71 0.98073 0.93356
9 294 551.2 0.533 92.8 2.49 0.467 0.412 765.81 701.52 0.91605 0.88287
10 294 493.1 0.596 122.5 2.67 0.404 0.362 508.02 479.62 0.94410 0.89645
11 294 820.9 0.358 77.6 2.49 0.642 0.599 1177.90 1141.81 0.96936 0.93323
12 294 711.7 0.413 88.0 2.95 0.587 0.548 929.64 900.28 0.96842 0.93375
13 294 686.6 0.428 94.7 2.13 0.572 0.521 1127.85 1077.31 0.95519 0.91118
14 294 652.0 0.451 107.5 2.39 0.549 0.506 937.31 909.14 0.96995 0.92151
15 294 724.9 0.406 111.3 3.09 0.594 0.563 849.88 844.95 0.99420 0.94713
16 294 538.6 0.546 100.6 2.54 0.454 0.402 717.06 661.92 0.92310 0.88510
17 294 517.5 0.568 88.2 2.64 0.432 0.375 664.89 595.58 0.89576 0.86820
18 294 782.0 0.376 119.8 3.32 0.624 0.598 803.58 811.06 1.00931 0.95824
19 294 609.1 0.483 133.7 1.80 0.517 0.476 787.30 788.70 1.00178 0.92019
20 294 946.6 0.311 96.2 1.92 0.689 0.647 1600.80 1590.45 0.99353 0.93846
3. Correctness function
In this research, the regression process is done by using R, Statistical Programming Language. To find the correctness function of output power and engine efficiency, non-linear three parameters Regression is applied. To this end, different models with different structures such as hyperbolic, logarithmic, Exponential and also polynomials with different degrees are evaluated. The result of using these models for regression is compared by considering Least Squares method as criteria. Also a set of 20 random data (Test-Point data) to examine each model. By different employed investigations, it was shown that the objective functions for this research are best presented by polynomial functions. Also the polynomials, which consider the effect of the interaction of three mentioned parameters, show more desirable results.
Further analysis showed that increasing the degree of polynomials reduces the Residual Sum of Squares (RSS) favorably, which results in almost zero RSS in
a suggested model. But by using test-point-data and appearing the over fitting, the performance of this model has been challenged.
Although, the fitted function captures all sample data or is close to them well, but its smoothness can be ignored. So in choosing the regression model, both the following sample data and smoothness should be considered.
The set of random test-point-data applied to examine suggested models for correcting power and efficiency of engine with slider and crank mechanism is listed in table 2.
Relative error percentage for each model with respect to test-point-data is calculated as follows:
( ∑ |
|
)
(14)
H. Saberinejad, A. Keshavarz, M. Bastami and M. Payandehdoost 2330
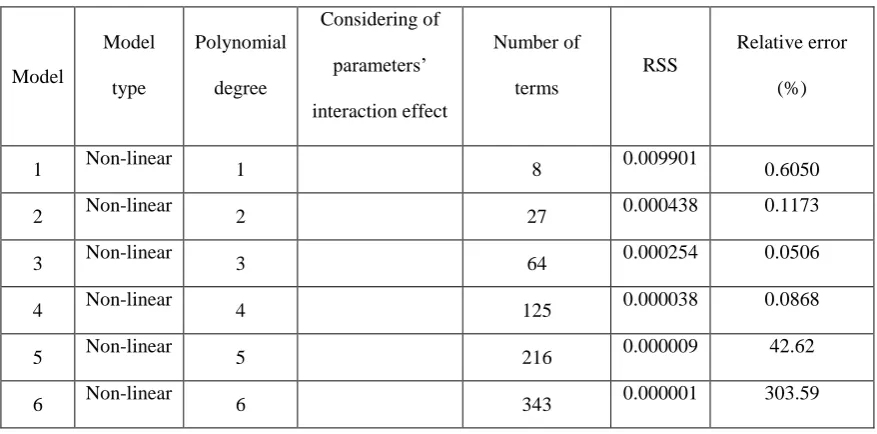
Six suggested models for regression of correcting function of output power are compared and listed in table 3, considering RSS and mean relative error percentage as comparison criteria.
According to the number of effective parameters, the visual representation of under fitting of suggested function is not applicable. But by checking the relative error and least square values in table 3, it is evident that increasing the degree of polynomial
would deteriorate the results of regression process. The result of relative error in table 3 clearly shows over fitting phenomena for models number 5 and 6.
Considering criteria such as matching the results of regression process and sample data, the relative error percentage of regression during the application of test-point data and the number of terms of polynomial, model 2 in table 3 is chosen as corrected function fitted for engine output power correlation.
Table 3. Comparison of suggested fitting modals for corrected function F
Model
Model
type
Polynomial
degree
Considering of
parameters’
interaction effect
Number of
terms
RSS
Relative error
(%)
1 Non-linear 1 8 0.009901 0.6050
2 Non-linear 2 27 0.000438 0.1173
3 Non-linear 3 64 0.000254 0.0506
4 Non-linear 4 125 0.000038 0.0868
5 Non-linear 5 216 0.000009 42.62
6 Non-linear 6 343 0.000001 303.59
4. Quantifying the SE energy losses
To introduce more accurate results, the SE losses are considered in suggested model as follows:
The total pressure loss during the cycle can be obtained from Eq. (15).
∑ (15)
The flow resistance of a component and a pipe ∑ is discussed in [15].
The regenerator resistance and average
Nusselt number can be calculated from Eq. (16) and (17) [14].
⁄
(16)
(17)
( ) (18)
The heat loss in the regenerator can be calculated as Eq. (18) and the heater and cooler actual temperature are calculated as equations (19) [15].
(19a)
(19b)
The work loss can be calculated from equation (19).
∮ (20)
5. Results and Discussion
In this section, the correctness functions are presented. Also, this new method is evaluated by GPU-3 SE data. The operational characteristics of the engines are distinguished by [16]. The other characteristics of the engine are geometrical and structural parameters, which are constant. The experimental results of GPU-3 engine as specified by [16] are used for the validation.
The results of new approach and other analytical models to estimate the output power and efficiency of GPU-3 are listed in table4 and compared to experimental data.
.
(21)
Table4. Results of different models and experimental data for GPU-3
model Output power (W) Engine efficiency (%)
Adiabatic model 8286 62.0
Extended adiabatic model by Urieli and Berchowitz 17]
8300 62.5
Timumi model (without considering engine loss)[18]
7109 54.9
Semi-steady model of Urieli et al. [19]
7400 53.1
Urieli et al. model (considering pressure loss) [19]
6700 52.5
Timumi model (considering engine loss)[18]
4273 38.5
Present model* 4150 37.1
Experimental data of GPU-3 engine[16]
3958 35.0
(22)
H. Saberinejad, A. Keshavarz, M. Bastami and M. Payandehdoost 2332
Conclusion
In this research, a new mathematical method is used to investigate the output power and efficiency of actual Stirling engines. More comparative results with accuracy and validity of adiabatic method are obtained without using any tedious numerical and iterative techniques. By using the correctness functions and engine energy losses correlations, the evaluating of output power and thermal efficiency of actual engines are applicable. These are used as a set of close-form correlations. The comparison results showed good agreement with an error of less than 3% for thermal efficiency predictions.
References
[1] S. Tyagi, S. Kaushik, and M. Singhal, "Parametric study of irreversible Stirling and Ericsson cryogenic refrigeration cycles," Energy conversion and management, vol. 43, pp. 2297-2309, 2002.
[2] F. Formosa and G. Despesse, "Analytical model for Stirling cycle machine design," Energy Conversion and Management, vol. 51, pp. 1855-1863, 2010.
[3] H. Solmaz and H. Karabulut, "Performance comparison of a novel configuration of beta-type Stirling engines with rhombic drive engine," Energy Conversion and
Management, vol. 78, pp. 627-633, 2014. [4] C. J. Paul and A. Engeda, "Modeling a
complete Stirling engine," Energy, vol. 80, pp. 85-97, 2015.
[5] G. Schmidt, "Classical analysis of operation of Stirling engine," A report published in German engineering union (Original German), vol. 15, pp. 1-12, 1871.
[6] I. Urieli and D. Berchowitz, "Stirling cycle machine analysis," Bristol Hilger Ltd, 1984. [7] S. KILDEGARD ANDERSEN, H. Carlsen,
and P. GROVE THOMSEN, "Preliminary results from simulations of temperature oscillations in stirling engine regenerator matrices," Energy, vol. 31, pp. 1371-1383, 2006.
[8] I. Batmaz and S. Üstün, "Design and manufacturing of a V-type Stirling engine with double heaters," Applied Energy, vol. 85, pp. 1041-1049, 2008.
[9] Y. Timoumi, I. Tlili, and S. B. Nasrallah, "Performance optimization of Stirling engines," Renewable Energy, vol. 33, pp. 2134-2144, 2008.
[10] J. Wrona and M. Prymon, "Mathematical modeling of the stirling engine," 2016. [11] M. Mahmoodi and M. Ziabasharhagh,
"Numerical solution of beta-type Stirling engine by optimizing heat regenerator for increasing output power and efficiency," J Basic Appl Sci Res, vol. 2, pp. 1395-1406, 2012.
[12] W.-L. Chen, K.-L. Wong, and Y.-F. Chang, "A computational fluid dynamics study on the heat transfer characteristics of the working cycle of a low-temperature-differential γ-type Stirling engine," International Journal of Heat and Mass Transfer, vol. 75, pp. 145-155, 2014. [13] J. L. Salazar and W.-L. Chen, "A
computational fluid dynamics study on the heat transfer characteristics of the working cycle of a β-type Stirling engine," Energy Conversion and Management, vol. 88, pp. 177-188, 2014.
[14] H. Saberinejad and A. Keshavarz,
"Reciprocating turbulent flow heat transfer enhancement within a porous medium embedded in a circular tube," Applied Thermal Engineering, vol. 102, pp. 1355-1365, 2016.
[15] S. Alfarawi, R. AL-Dadah, S. Mahmoud, Influence of phase angle and dead volume on gamma-type Stirling engine power using CFD simulation. Energy Conversion and Management 124 (2016) 130-140.
[16] W. R. Martini, Stirling engine design manual, Washington Univ., Richland (USA). Joint Center for Graduate Study, pp. 1978 . [17] I. Urieli, C. J. Rallis, D. M. Berchowitz,
Computer simulation of Stirling cycle machines, in Proceeding of, 1512-1521 . [18] Y. Timoumi, I. Tlili, S. B. Nasrallah, Design
and performance optimization of GPU-3 Stirling engines, Energy, Vol. 33, No. 7, pp. 1100-1114, 2008 .
[19] I. Urieli, C. J. Rallis, D. M. Berchowitz, Computer simulation of Stirling cycle machines, in Proceeding of, 1512-1521 .