Automatic Detection of Spring Faults During Assembly of
Reciprocating Compressors
Primož Potonik1,* - Dejan Sokli1 - Peter Muži1 - Matija Absec2 - Tomaž Strmec2 - Edvard Govekar1
1
University of Ljubljana, Faculty of Mechanical Engineering, Slovenia
2
Danfoss Compressors, d.o.o., Slovenia
Automatic condition monitoring application for the detection of spring faults during assembling of reciprocating compressors is presented in this paper. Spring faults are characterized by incorrect positioning of compressor body on the supporting springs. Consequently, compressors with such faults should be detected and eliminated from the production. The paper describes development and application of a condition monitoring (CM) system for the production line. The CM system is composed of a mechanical pneumatic system and a software for the analysis and detection of failures. The mechanical system is designed to push toward the body of the compressor and simultaneously measure the pressing force. Spring faults are characterized by an increased force, therefore force signals are used to extract features, appropriate for an automatic condition monitoring. The system was tested during regular production in the company, with additional sets of compressors with built-in spring faults. The main contribution of this paper is the development and testing of various decision strategies for the recognition of faulty compressors. Standard 3-sigma decision strategy is compared to optimized stationary decision strategy and two adaptive strategies: adaptive strategy with constant deviation and adaptive strategy with adaptive deviation. Results show that adaptive decision strategy with adaptive deviation yields the best fault recognition rate and is, therefore recommended for the application on the industrial production line. © 2009 Journal of Mechanical Engineering. All rights reserved.
Keywords: compressors, assembly, springs, automated systems, error detection
0 INTRODUCTION
Increasingly demanding and competitive market enforces constant improvement of production quality of reciprocating compressors for domestic appliances. Therefore appropriate condition monitoring (CM) is becoming more and more important [1] and [2]. During the production process, various mechanical faults can occur due to production and assembly intolerances, or due to material defects. It is very important for the company to timely catch such faults in order to prevent end users receiving such products. The need to increase machine reliability and decrease production loss due to faulty products in highly automated production lines requires accurate and reliable CM techniques [3]. Various condition monitoring approaches have been described in the recent years [4] to [8]. The key to successful CM applications is in the selection of proper signal processing techniques and robust operation [9]. Industrial CM applications are subject to time variations,
drift, and numerous noise and other influential sources. Therefore, suitable normalizations and/or adaptive tunings should be applied for successful implementation [10].
Fig. 1. Typical reciprocating compressor
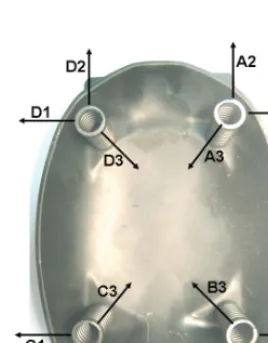
Fig. 2. Locations of supporting springs (A,B,C,D) and directions of possible dislocations (1,2,3)
Fig. 3. Correct spring positioning
Fig. 4. Spring positioning fault C2
The paper describes a method for automatic detection of spring faults. An experimental condition monitoring system was developed and applied to the production line of the company. Our objective was to investigate the possibilities of automatic detection of spring faults based on measured force signals during vertical pressing of the compressor body from the top. It was discovered that spring faults cause increased force signals during the pressing operation. Force signals were used to extract features, appropriate for automatic detection of spring faults during assembling of compressors. Various decision strategies, presented in section 1, were designed and their efficiency was evaluated by an appropriate objective function. The experimental setup is described in section 2 and the results of applying various decision strategies are presented in section 3. Discussion of results and recommendations for the industrial application are summarized in section 4 and finally, some conclusions are drawn in section 5.
1 THEORY
carry out certain function [12]. In both cases, the decision threshold can be overdrawn. By using adaptive thresholds, the decision strategy can be more tightly adjusted to the current production population [13] and [14].
In this paper, various decision thresholds are compared to the objective of automatic detection of spring faults on compressors. As a basis, a 3-sigma strategy is applied. Then, this basic approach is improved by optimizing the single stretching parameter. Besides the constant decision thresholds, two adaptive strategies are proposed. The adaptive approaches are based on exponential smoothing methods [15] that emphasize the importance of new data and attenuate the contribution of old data. In order to compare decision strategies, an evaluation method is proposed in the next section.
1.1 Evaluation of Decision Thresholds
When applying decision strategy in a company with the objective to recognize defected compressors, two types of false recognitions are possible:
A) defected compressor was recognized as OK, B) normal compressor was recognized as
NOT_OK.
The importance of each false recognition depends on company’s business priorities. Therefore, the proper weighting for each false recognition must be addressed according to these priorities. We propose the following criterion function J that addresses the problem of weighted false recognitions: K H N N N
J f n (1)
The criterion function J is composed of weighted number of type (A) false recognitions Nf, number of type (B) false recognitions Nn,
number of total monitored compressors N, weighting factor , and parameter for adjustment of the criterion function range. For the case study presented in this paper, the weighting factor = 10 was selected. This corresponds to company’s policy striving to minimize defects at the end user level. Parameter = 1000 was arbitrarily chosen to shift criterion values into the appropriate range. Smaller criterion function
value corresponds to better decision strategy. The criterion function was applied to evaluate the following decision strategies, presented in subsequent sections:
1. constant decision threshold,
2. optimized constant decision threshold, 3. adaptive decision threshold with
constant deviation,
4. adaptive decision threshold with adaptive deviation.
1.2 Constant Decision Threshold
As the first decision strategy, the standard 3-sigma method was applied. This method requires computation of mean m and standard deviation , as shown in Eqs. (2) and (3). Only normal compressors were used to compute m and . The scalar samples, measured or extracted from a population of N compressors, are denoted as zi,
i = 1...N.
¦
N i iz
N
m
11
(2)¦
N i im
z
N
1 2)
(
1
V
.
(3)The computed mean and standard deviation are then combined to yield decision thresholds according to Eqs. (4) and (5) where high decision threshold Th and low decision threshold Tl are calculated: .
V
V
k m T k m T l h (4) (5)Both thresholds are obtained by properly selecting the stretching parameter k. According to the 3-sigma strategy, the parameter k = 3 is selected.
1.4 Adaptive Decision Threshold with Constant Deviation
Another improvement can be achieved by substituting stationary decision thresholds (4) and (5) with adaptive decision thresholds. In the first approximation, population mean m is substituted by time-dependent mean m(t) that follows the exponential smoothing based adaptive low:
) ( ) 1 ( ) ( ) 1
(t z t m t
m
D
D
.
(6)Parameter D[0,1] controls adaptive behaviour. Deviation is left stationary as in constant decision strategies. The decision thresholds can be expressed as:
. ) ( ) ( ) ( ) (
V
V
k t m t T k t m t T l h (7) (8)Adaptive decision threshold with constant deviation requires selection of the following parameters that can be calculated by numerical optimization: , k.
1.5 Adaptive Decision Threshold with Adaptive Deviation
Adaptive decision threshold with constant deviation can be further improved by adding adaptive deviation s(t). In this case, both mean m(t) and deviation s(t) become time dependent. Adaptive mean is expressed by Eq. (6) and adaptive deviation is expressed as follows:
) ( ) 1 ( ) ( ) ( ) 1
(t z t mt s t
s E E (9)
Parameter E[0,1] regulates adaptive behaviour of deviation, similarly as for adaptive mean. Adaptive decision thresholds with adaptive deviation can be expressed as:
). ( ) ( ) ( ) ( ) ( ) ( t s k t m t T t s k t m t T l h (10) (11)
This strategy requires optimization of three parameters: , , k.
2 EXPERIMENTS
2.1 Experimental System
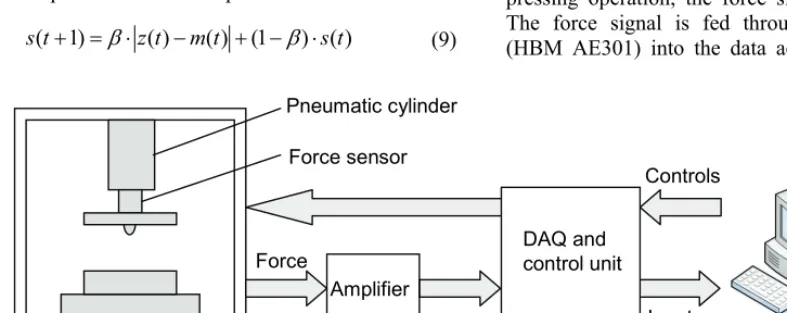
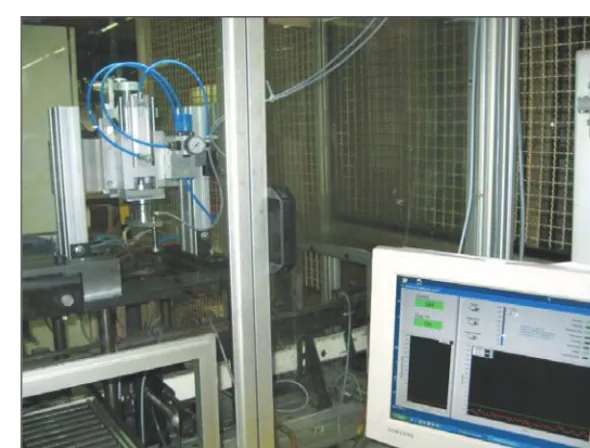
Experimental CM system is schematically shown in Fig. 5 and a picture of an installed system on the production line is shown in Fig. 6. The CM system consists of a mechanical pneumatic subsystem and a computer based subsystem. The mechanical system is designed to push toward the body of the compressor and simultaneously measure the pressing force. The computer based subsystem is responsible for data acquisition (DAQ), data analysis and control of the pneumatic subsystem. The mechanical subsystem consists of a mechanical frame which supports the pneumatic cylinder (FESTO DNC-32-60-PPV-A). The pneumatic cylinder is equipped with force sensor (HBM U3/5kN) and a specially designed pressing tip that corresponds to the shape of the compressor body. During the pressing operation, the force signal is acquired. The force signal is fed through the amplifier (HBM AE301) into the data acquisition (DAQ)
Amplifier Force sensor Pneumatic cylinder Compressor Controls Force
Mechanical pneumatic system
DAQ and control unit
Inputs
Fig. 6. Installed experimental system
card (National Instruments NI PCI-6232) and analysed on the computer. The software for analysis and user interface was developed on the platform National Instruments LabView 8.2 in the Laboratory of Synergetics, Faculty of Mechanical Engineering.
2.2 Feature Extraction
Examples of force measurements during the pressing operation for normal compressor and compressor with spring fault are shown in Fig. 7.
0 0.2 0.4 0.6 0.8 1
0 20 40 60 80 100 120 140 160 180 200
Time [s]
Force [N]
spring fault normal
Fig. 7. Time series of force signals for normal and faulty spring position
Increased force level in the stationary part (0.2 to 1.0 s) can be noticed. In order to reduce the dimensionality of the acquired time series, the scalar feature is extracted from force signals for a simplified comparison of measurements. Only the stationary part of the force curve is relevant for the recognition of spring faults, therefore the feature is extracted as an average of the stationary force signal:
¦
2
1
1 2
1
NN i
i
F
N
N
z
.
(12)Indexes N1 and N2 indicate the appropriate time
window (0.2 to 1.0 s). By using the extracted features for each measurement, only scalar values must be evaluated and this significantly simplifies the condition monitoring analysis.
2.3 Measurements
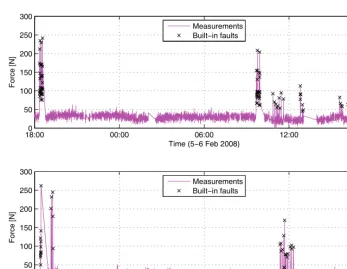
monitored and 115 of them included built-in spring faults. The overview of measurements is shown in Fig. 8 where the time series of extracted features for each measurement is presented. The presentation is split into two subsequent plots due to high density of presented data. Compressors
with built-in spring faults are marked with x. It can be observed that features for faulty compressors generally exceed the feature values of normal compressors. The exact analysis is presented in the next section.
18:000 00:00 06:00 12:00 18:00 50
100 150 200 250 300
Time (56 Feb 2008)
Force [N]
Measurements Builtin faults
18:000 00:00 06:00 12:00 18:00 50
100 150 200 250 300
Time (67 Feb 2008)
Force [N]
Measurements Builtin faults
Fig. 8. Extracted features measured with the experimental CM system during testing on the production line
3 RESULTS
Measurements presented in the previous section (10400 compressors) were used to test the selected condition monitoring strategies. Four different CM strategies discussed in section 1 were applied. Each CM strategy is defined by the decision threshold that differentiates between OK and NOT_OK samples. The success of the decision threshold is evaluated by the criterion function J (Eq. 1). Our goal was to find the optimal decision threshold that yields minimum value of the criterion function J.
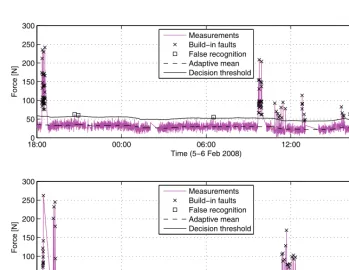
3.1 Constant Decision Threshold
As the first strategy candidate, the standard 3-sigma approach was applied. Mean m
and standard deviation were calculated according to Eq. (2-3) where only normal compressors were taken into consideration. Mean and standard deviation were applied with stretching parameter k = 3 to calculate the decision threshold Th according to Eq. (4). The
18:000 00:00 06:00 12:00 18:00 50
100 150 200 250 300
Time (56 Feb 2008)
Force [N]
Measurements Buildin faults False recognition Decision threshold
18:000 00:00 06:00 12:00 18:00 50
100 150 200 250 300
Time (67 Feb 2008)
Force [N]
Measurements Buildin faults False recognition Decision threshold
Fig. 9. Condition monitoring with constant 3-sigma decision threshold
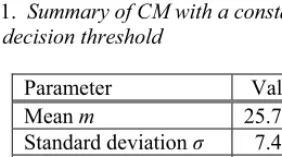
Table 1. Summary of CM with a constant 3-sigma decision threshold
Parameter Value
Mean m 25.7 N
Standard deviation 7.4 N Stretching parameter k 3 Decision threshold Th 47.8 N
Criterion function J 5.49
3.2 Optimized Constant Decision Threshold
Due to non-normal distribution of a complete data set and custom criterion function J, some improvement in decision accuracy can be expected by optimizing the stretching parameter k. In optimized constant decision threshold strategy, parameter k is numerically optimized to yield the minimum value of the criterion function J. In this case, the optimal value k = 3.1 is obtained, which results in a slightly improved criterion function J = 4.72. The result for optimized constant decision threshold strategy is summarized in Table 2.
Table 2. Summary of CM with optimized constant decision threshold (k = 3.1)
Parameter Value
Mean m 25.7 N
Standard deviation 7.4 N Stretching parameter k 3.1 Decision threshold Th 48.5 N
Criterion function J 4.72
3.3 Adaptive Decision Threshold with Constant Deviation
strategies but the stretching parameter k is optimized to yield the optimal result J. The time dependant mean is calculated according to Eq. (6) and the decision threshold Th according to Eq. (7).
The parameters and k are optimized numerically with the objective to find the minimum value of the criterion function J. This strategy yields considerable improvement in the final result with criterion function value J = 2.51. The result is shown in Fig. 10 and expressed in Table 3.
Table 3. Summary of CM with adaptive decision threshold with constant deviation
Parameter Value
Mean m adaptive
Standard deviation 7.4 N Stretching parameter k 3.1 Adaptive parameter 0.01 Decision threshold Th adaptive
Criterion function J 2.51
18:000 00:00 06:00 12:00 18:00 50
100 150 200 250 300
Time (56 Feb 2008)
Force [N]
Measurements Buildin faults False recognition Adaptive mean Decision threshold
18:000 00:00 06:00 12:00 18:00 50
100 150 200 250 300
Time (67 Feb 2008)
Force [N]
Measurements Buildin faults False recognition Adaptive mean Decision threshold
Fig. 10. Condition monitoring with adaptive decision threshold with constant deviation. Parameters are set as k = 3.1 and = 0.01
3.4 Adaptive Decision Threshold with Adaptive Deviation
As the last strategy, adaptive decision threshold with adaptive deviation is applied. Compared to the adaptive decision threshold with constant deviation, this strategy contributes to the condition monitoring accuracy with additional adaptiveness in the calculation of deviation. Besides the time dependent mean m(t) according to Eq. (6), also deviation is now calculated according to Eq. (9) in time dependent fashion as
18:000 00:00 06:00 12:00 18:00 50
100 150 200 250 300
Time (56 Feb 2008)
Force [N]
Measurements Buildin faults False recognition Adaptive mean Decision threshold
18:000 00:00 06:00 12:00 18:00 50
100 150 200 250 300
Time (67 Feb 2008)
Force [N]
Measurements Buildin faults False recognition Adaptive mean Decision threshold
Fig. 11. Condition monitoring with adaptive decision threshold with adaptive deviation. Parameters are set as k = 4.3, = 0.008, = 0.008
Table 4. Summary of CM with adaptive decision threshold with adaptive deviation
Parameter Value
Mean m adaptive
Deviation s adaptive
Stretching parameter k 4.3 Adaptive parameter 0.008 Adaptive parameter 0.008 Decision threshold Th adaptive
Criterion function J 0.96
4 DISCUSSION
Comparison of results with various condition monitoring strategies is summarized in Table 5. An improvement in criterion function value J obviously grows proportionally with the effort and sophistication of the CM strategy applied. The most sophisticated method, adaptive decision threshold with adaptive deviation, yields the most promising result. The method requires a
numerical optimization of three free parameters, namely k, and , which is quite feasible for an industrial application without creating extra complications. Consequently, this method is suggested as a preferable implementation for the industrial CM system.
The results in Table 5 also comprise the numbers of misclassified compressors for each method. The following false classifications are presented:
Ne–overall number of false classifications,
Nn–number of false classifications of normal compressors,
Nf–number of false classifications of de-fected compressors.
Table 5. Summary of results with various condition monitoring strategies
Strategy Ne Nn Nf k & J
1. Constant decision threshold 30 27 3 3 / 5.49
2. Optimized constant decision threshold 22 19 3 3.1 / 4.72
3. Adaptive decision threshold with constant deviation 8 6 2 3.1 0,001 2.51
4. Adaptive decision threshold with adaptive deviation 10 10 0 4.3 0,008 0.96
5 CONCLUSIONS
A strategy for automatic condition monitoring of spring faults during the assembly are evaluated:
1. constant decision threshold,
2. optimized constant decision threshold, 3. adaptive decision threshold with
constant deviation, and
4. adaptive decision threshold with adaptive deviation.
The approaches increase in complexity and also in the adaptive ability to follow the non-stationary production processes. Industrial experiments show that the most complex approach, namely adaptive decision threshold with adaptive deviation yields best fault recognition results. The implementation cost of this approach is very affordable, therefore this strategy is recommended for industrial implementation. The strategy was applied in the company to solve the problem of detection of spring faults. Nevertheless, the proposed method is very general and can be recommended for the implementation in broad range of production industries.
6 REFERENCES
[1] Potonik P., Govekar E., Grabec I., Strmec A. (2002) Neural network based characterization of compressors. European symposium on intelligent techniques, hybrid systems and their implementation of smart adaptive systems EUNITE 2002, Albufeira, September 19-21, p. 641-645, ISBN 3-89653-919-1.
[2] Potonik P., Govekar E., Grabec I., Muži P. (2005) Psychoacoustic approach to machine fault diagnosis. International journal of acoustics and vibration, vol. 10, p. 131-136. [3] Yang B.-S., Hwang W.-W., Kim D.-J., Tan
A. C. (2005) Condition classification of
small reciprocating compressor for refrigerators using artificial neural networks and support vector machines. Mechanical Systems and Signal Processing, vol. 19, no. 2, p. 371-390.
[4] Švai S., Boras I., Andrassy M. (2007) A Numerical Approach to Hidden Defects in Thermal Non-Destructive Testing. Strojniški vestnik - Journal of Mechanical Engineering, vol .53, no. 3, p. 165-172.
[5] Kahaei M.H., Torbatian M., Poshtan J. (2007) Bearing-Fault Detection Using the
Meyer-Wavelet-Packets Algorithm. Strojniški vestnik - Journal of Mechanical
Engineering, vol. 53, no. 3, p. 186-192. [6] Bulatovi M., Šuši J. (2007) Condition
Maintenance - Applying an Endoscopic Method. Strojniški vestnik - Journal of Mechanical Engineering, vol. 53, no. 5, p. 329-347.
[7] Virti M.P., Aberšek B., Župerl U. (2008) Using of Acoustic Models in Mechanical Diagnostics. Strojniški vestnik - Journal of Mechanical Engineering, vol. 54, no. 12, p. 874-882.
[8] Belšak A., Flašker J., Vibration Analysis to Determine the Condition of Gear Units. Strojniški vestnik - Journal of Mechanical Engineering, vol. 54, no. 1, p. 11-24.
[9] Potonik P., Govekar E., Grabec I. (2007) Acoustic and Acoustic Emission Based Condition Monitoring of Production Processes. Proceedings of the Second World Congress on Asset Management and the Fourth International Conference on Condition Monitoring, Harrogate, June 11-14, 2007, p. 1614-1624, ISBN 1-901892-22-0. [10] Potonik P., Govekar E., Grabec I., Gradišek
[11] Tinta D., Petrovi J., Benko U., Jurii D., Rakar A., Žele M., Tavar J., Rejec J., Stefanovska A. (2005) Fault diagnosis of vacuum cleaner motors. Control Engineering Practice, vol. 13, no. 2, p. 177-187.
[12] Breitgand D., Henis E., Shehory O. (2005) Automated and Adaptive Threshold Setting: Enabling Technology for Autonomy and Self-Management. Proceedings of the Second International Conference on Autonomic Computing ICAC’05, Haifa, June 13-16, 2005, p. 204-215.
[13] Huang K.L. Z., Moon C.W. (1997) Adaptive Thresholding – A Robust Fault Detection Approach. Proceedings of the 36th Conference on Decision & Control, San
Diego, December 10-12, 1997, p. 4490-4495.
[14] Shi Z., Gu F., Lennox B., Ball A.D. (2005) The development of an adaptive threshold for model-based fault detection of a nonlinear electro-hydraulic system. Control Engineering Practice, vol. 13, p. 1357-1367. [15] Makridakis S., Whellwright S. C., Hyndman
R. J. (1998) Forecasting methods and applications, 3rd ed., New York, John Wiley & Sons, p. 135-184.