Print ISSN: 2383-451X Online ISSN: 2383-4501 Web Page: https://jpoll.ut.ac.ir, Email: [email protected]
Introduction and Application of New GIS_AQI Model: Integrated
Pollution Control in Tehran
Pardakhti, A.* and Ebrahimi Qadi, M.
School of Environmental Engineering, College of Engineering, University of Tehran, P.O.Box 14155-6135,Tehran, Iran
Received: 30.12.2018 Accepted: 02.06.2019
ABSTRACT: The city of Tehran undergoes an increasing growth in population as well
as industrial activities, both of which increase the concentration of air pollutants. The current research tries to turn a limited and focused system of air contamination measurement and control to an unlimited and extensive one that examines the concentration of each of the contaminants in any area of Tehran. Accordingly, information from twenty air-pollution measurement stations at certain points of the city helps measuring the concentrations of contaminants like SO2, NO2, CO, O3, PM2.5, and PM10 throughout a year on a daily basis. The index of AQI has also been used as the air quality index to determine the level of pollution in the city. Using ARC-GIS software, the AQI or the air quality index has been zoned and a comprehensive map, designed. Moreover, in order to illustrate this map, a map of the zoning has been drawn up for this purpose on December, 26, 2016, considered an unhealthy day in Tehran, the results of which show that only 27.8% of the city is unhealthy and the rest of the city does not fall in unhealthy area. However, due to the lack of a comprehensive map for determining the AQI in different parts of the city, the whole city closes down, leading in an economic loss of about $ 1 million a day for the city.
Keywords:Air pollution modeling, Monitoring system, Air pollution management.
INTRODUCTION
Currently, air quality has emerged as one of the most influential parameters of human life, especially in densely-populated and industrialized areas. In order to prevent pollution in the long run, pollution control is essential. In this way, by training people or restricting the traffic and industries, preventive measures should be made to assist the community health, reduce the need for hospital treatment, and even prevent early death, thus avoiding adverse socio-economic impacts on community (Huang et al., 2015; Li et al., 2018; Hosseini and Shahbazi, 2016). The information from
*Corresponding Author, Eamil: [email protected]
AQI. It has been employed as the main indicator of air pollution since 1999 by supplementing the particle size to above 2.5 microns while fine-tuning its previous range of indices such as PSI which classifies air into five main categories, namely good, moderate, unhealthy, very unhealthy, and hazardous. AQI, however, adds a new category called unhealthy for sensitive groups and gains a remarkable advantage over its past indexes (García et al., 2009). There have been numerous studies in recent years on the benefits of AQI index (e.g. Lanzafame et al., 2015; Pant et al., 2016; Ruggieri and Plaia, 2012; Kumar and Goyal, 2011; Trippetta et al., 2013; Zhang et al., 2016). In this regard, the GIS system is considered a powerful tool for designing and creating air pollution database (Greene et al., 2011). A computer system, comprised of software, hardware, and manpower, this system's task is to process, manage, and analyze spatial information, while it is able to store, collect, and display geographic information (Ansari et al., 2015). By collecting and integrating common database data, this technology provides illustrations and geographic information analyses for drawing maps, used to make the results clearer and more predictable (Al-hanbali et al., 2011; Sumiani et al., 2009; wingle et al., 1999; Ghanghermeh et al., 2017). The history of GIS system dates back to mid-1960s in the United States which in the 1970s, with the advancement of technology and availability of computer technology, it also gained the power of analyzing large volumes of geographic data (Babanezhad et al., 2018). Previous studies that predicted air pollution situation via GIS are as follows:
In 2006, an air quality database was developed in India, based on which AQMS air quality management was designed. The study also examined the role of GIS in continuation of air quality improvement, showing that this technique was very suitable for air quality management in case of the five inputs (Ebrahimi ghadi et al., 2019).
In 2007, other studies in the United States were conducted to develop a technique based on the initial tools for assessment of air quality via GIS system. (Mauroulidou et al., 2007)
Another study in Thailand in 2006 addressed a combination of air pollutant measurement sensors, explained the data analysis method by GIS software, and dealt with the status of Bangkok's air pollution as well as the implementation of GIS plans for prediction and management of air pollution in the city (Pummakarnchona et al., 2005).
On the whole, GIS technique is used to manage urban crises, risk management, and urban planning. Researches on natural disasters like floods and earthquakes are samples of this kind. (Ebrahimian-Ghajari et al., 2016; Fernandez et al., 2016; Hashemi and Alesheikh, 2011). The purpose of this study is to investigate the effect of each of SO2, NO2, CO, O3, PM2.5, and PM10 contaminants on air quality in different regions of Tehran. It also aims at analyzing the concentration of the six contaminants, using the GIS technique, monitored at 20 stations in Tehran on a daily basis in 2016, to ultimately design a comprehensive map of the concentration of various contaminants in Tehran, so that each of the arbitrary points within the map will display the concentration of the six contaminants and evaluate their AQI.
MATERIALS AND METHODS
application tools for statistical analysis and evaluation in order to provide a robust management system for pollution reduction and control. The pollutants mentioned are essential. Figure 1 illustrates the location of Tehran on the map.
Tehran has 20 air pollution monitoring station in which either all or some of SO2, NO2, CO, O3, PM2.5, and PM10
pollutants are constantly measured. The results are transmitted daily to Tehran Air Pollution Control Center. Since 2010, due to the presence of particles in this city, the status of suspended particles smaller than 2.5 microns has been also examined. The results are announced on the basis of AQI. Table 1 shows the average concentration of each pollutant in each station.
Fig. 1. Location of Tehran and its 22 areas
Table 1. Air pollution monitoring stations
PM2.5(µg/m3)
PM10(µg/m3)
Table 2. Different levels of AQI index
Air Quality Index (AQI) Values Levels of Health Concern Colors
0 to 50 Good Green
51 to 100 Moderate Yellow
101 to 150 Unhealthy for Sensitive Groups Orange
151 to 200 Unhealthy Red
201 to 300 Very Unhealthy Purple
301 to 500 Hazardous Maroon
Air Quality Index is an indicator of air pollution quality on a daily basis, which informs people about the air quality. This indicator uses concentration of air pollutants such as SO2, NO2, CO, O3, PM2.5, and PM10, as well as suspended particles, which has a different limit compared to the various units, turning them into a unitless number, displaying the state of air quality in six qualitative modes of good, moderate, unhealthy for sensitive groups, unhealthy, very unhealthy, and hazardous. Table 2 shows the different levels of AQI index for various contaminants. It should be noted that for easy use of the various strata of the community, each of the 6 AQI levels are reported to the general public with a certain color.
The formula for air quality index calculation depends on air pollution data along with the pollutant type. The AQI can be calculated from Formula 1, below, based on the pollution data:
high low
low low
high low
I I
AQI C C I
C C
(1)
where,
AQI: Air Quality Index, C: The amount of air pollutant
Clow: Lower limit of the pollutants in the C domain
Chigh: Lower limit of the pollutants in the C domain
I low: Lower limit of AQI corresponding to C low
C high: Higher limit of AQI corresponding to C high
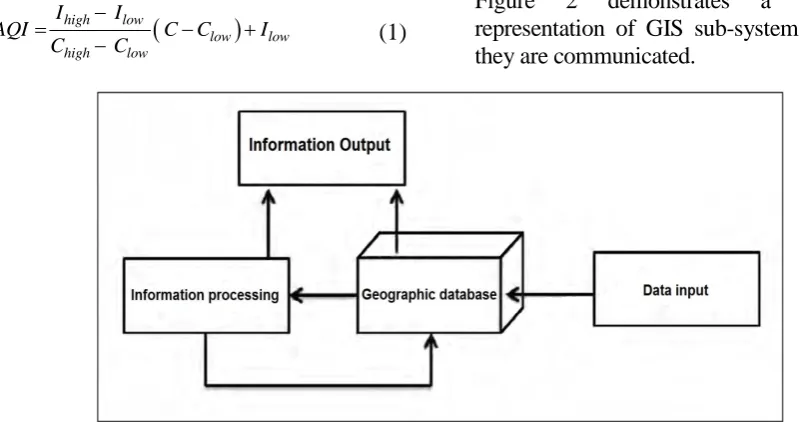
GIS was first introduced and expanded in Canada in early 1960s. A collecting, storing, controlling, retrieving, updating, integrating, processing, analyzing, and modeling tool, which represents various geographic data, the system is consisted of five components of hardware, software, geospatial data, manpower, and information processing models. It also includes four data sub-categories, including data input, data storage and retrieval, data processing, and data analysis, providing output information. Figure 2 demonstrates a schematic representation of GIS sub-system and how they are communicated.
Fig. 3. Location of air pollution measurement stations
What distinguishes GIS from mapping is its analytic capability, which allows geospatial and descriptive data to be combined and tailored for specific purposes. The tools of this system can be computer programs that extract descriptive data in databases, mapping them to graphical effects on a map. Topological modeling, neighborhood, topography, continuity, network proximity, and overlapping are the most important analytical functions of GIS. Based on the abovementioned capabilities, it can be used to solve problems such as resource allocation, display and understanding of spatial and temporal distribution of phenomena, analysis of the relationship between the variables and phenomena, and classification and distinction of places, not to mention planning and management of natural and socioeconomic resources. GIS is the basic computer system for spatial data; therefore, it plays an outstanding role in research on this subject, since air pollution occurs at a location.
The present study investigated six hazardous pollutants such as SO2, NO2, CO, O3, PM2.5, and PM10 in Tehran. The pollutants were collected on a daily basis from one of the twenty pollutant
monitoring stations in Tehran each year. After analyzing the statistical data in Excel, the geographic location of the stations was determined in accordance with UTM system, being pictured in Tehran map based on Figure 3 which Figure represents the highest density of stations in the center of Tehran as the most polluted section of the city.
RESULTS AND DISCUSSIONS
weight not only to the distance between the points but also to the correlation between the measured ones (Shad et al., 2009; Diodato and Ceccarelli, 2004). Considering that the Kriging method is a geo-statistical estimation one, based on the weighted moving average, it can be regarded as the best linear unbiased estimator (Qaderi et al., 2018; Peng et al., 2014; Liu et al., 2015). This kind of Kriging is called linear Kriging because it is the linear combination of n data, and the condition for using this estimator is the normal distribution of contaminants' concentration. Otherwise, either nonlinear Kriging should be used or the distribution of the variables should be converted to normal. The present research used the linear method.
For this purpose, the study collected qualitative information on six pollutants and considered the output of the Excel file as input data for Arc GIS 10.3 software. Each of the air pollution monitoring stations had a geographic coordinate based on UTM as well as daily concentration of each of the six air pollution parameters. With the institutionalization of the stations' coordinates, the study area was enclosed within an area of 730 square kilometers. Then, for each of the air pollution parameters, separate shape files were created, each to get converted to a TIN file so as to provide the data transfer conditions to the RASTER mode, being a continuous form. Finally, by use of the VECTOR files and joining them, all parameters of air pollution at any point in Tehran got determined in a way that by selecting any point in the study area, the air pollution quality of that point determined each of the six parameters of air pollution.
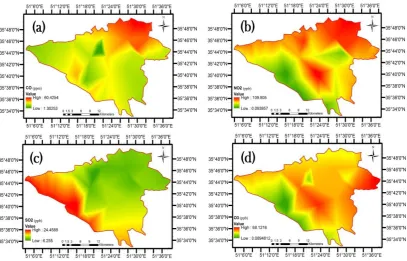
The research measured the average of SO2, NO2, CO, O3, PM2.5, and PM10 along with their AQI index over a year period. The measurements were then calculated and recalled by Arc GIS software. Figure 4 gives the results of the
dispersion state of each of these pollutants. Figure 4.A represents the dispersion map of CO in Tehran. In the North and Northeast of Tehran, CO concentrations were higher. Since Tehran is surrounded by north and east by the Central Alborz mountain range of Iran, most of the wind enters the city from the south, or the central plains of Iran, moving northwards. On the other hand, the factor that leads to CO production is fuel consumption from transportation and traffic, with the latter often taking place in the center of Tehran. As a result, the CO, produced in the city center, moves northward with the wind, there to be prevented by the mountains from getting dispersed, thus observing the accumulation of this pollutant north of the city.
Figure 4b shows the distribution of NO2 in the city. This map often indicates the concentration of this pollutant in the center and north of this city due to heavy traffic load in the former and transference of the pollutant to the latter where it is accumulated due to the Northern mountains.
Figure 4c shows the dispersion of SO2 in Tehran, indicating that the majority of pollutant concentrations belong to the southern and southwestern part of the city. Most industries and factories in the city are located south thanks to the low economic value of the land, there. The main factors that produce SO2 include factories, industries, and diesel consumption by heavy vehicles.
Fig. 4. Dispersion of concentrations of (a) Co, (b) NO2, (C) SO2, and (d) O3
Fig. 5. Dispersion of (a) PM10, and (b) PM2.5 concentrations
Figure 5 shows the distribution map of PM10 and PM2.5 contaminants, which having particles below 2.5 microns and 10 microns, are the result of processes wherein fossil fuels such as oil, gas, and coal are burned. Dispersal of these pollutants in Tehran occurs in densely-populated areas with high urban density, and the concentration of this pollutant increases. Moreover, in the southern and southeastern parts of the country, close to central plains of Iran, the concentration of
these pollutants increases as a result of significant number of industries and factories, the desert dust, and burning fossil fuels, not to mention agricultural fields.
Fig. 6. Distribution of AQI in Tehran
Fig. 7. Comprehensive map of pollutants' dispersion
Investigation of air quality in Tehran due to the lack of a comprehensive and continuous map, covering the whole city with proper distribution, has always been a problem for researchers and managers of air pollution control in the city. However, the air pollution crisis, especially in recent years has intensified the necessity of studies in this regard, making the present study to design a comprehensive map to control Tehran's air
pollution. Figure 7 represents a comprehensive map of Tehran, wherein each point indicates the concentrations of SO2, NO2, CO, O3, PM2.5, and PM10 contaminants. It evaluates them in terms of AQI, determining which point in the city has a critical condition for the community due to air pollution.
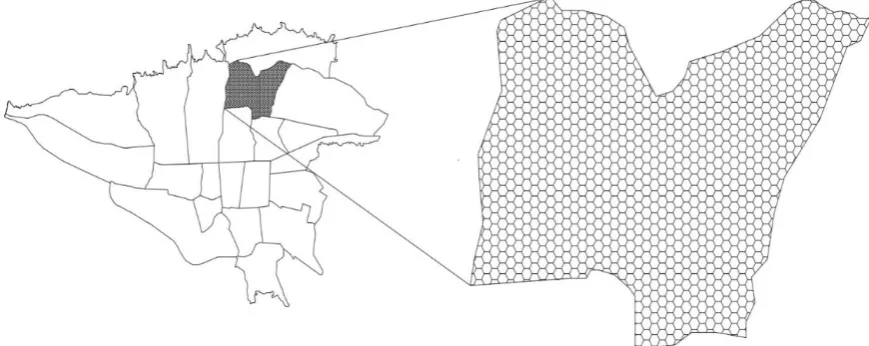
the total area of Tehran is estimated to be about 730 square kilometers, with only twenty pollution measurement stations operating in the city, it can be said that on average, the output information from each station covers an area of 37 square kilometers. In other words, for every 37 square kilometers, there is a set of data for air quality measurement. Considering that Tehran is divided into 22 separate regions, and assuming that each of these areas can be assigned to a measuring station, the hypothetical range can be displayed as the
map in Figure 8. However, by means of the new GIS method in this research, the number of quality measurement stations increased from 20 stations to 18153 stations. In this case, the average covered area for each station reduced to about 40,000 square meters (0.04 square kilometers), i.e., about 1000 times more accurate than the previous one. For a better understanding of this point, Figure 8 magnifies only one region, considered as a unit in the whole region, itself split through implementation of GIS method into smaller ranges.
Fig. 8. Change in the control area in the city of Tehran
Determining the actual concentration of pollutants and describing the air quality status in comparison with the standard situations as well as providing a simple, fast, and accurate body of information to people significantly affects them take precautionary and preventive measures for cases where air pollution exceeds the standard amount. Therefore, in order to manage the quality of Tehran's air pollution, the lack of a comprehensive map which enables checking every single point in Tehran causes the majority of the air pollution stations to announce the whole city as unhealthy and in need of closing down. However, as explained in Table 3, the present study used a comprehensive map for a sample unhealthy day in this city. It evaluated the AIQ index on
Fig. 9. Pollution zoning on 26.12.2016
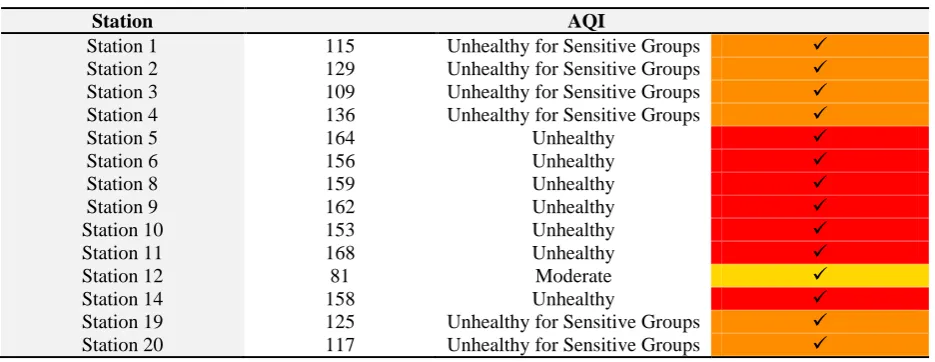
Table 3. Pollution situation at different stations in Tehran on 26.12.2016
Station AQI
Station 1 115 Unhealthy for Sensitive Groups
Station 2 129 Unhealthy for Sensitive Groups
Station 3 109 Unhealthy for Sensitive Groups
Station 4 136 Unhealthy for Sensitive Groups
Station 5 164 Unhealthy
Station 6 156 Unhealthy
Station 8 159 Unhealthy
Station 9 162 Unhealthy
Station 10 153 Unhealthy
Station 11 168 Unhealthy
Station 12 81 Moderate
Station 14 158 Unhealthy
Station 19 125 Unhealthy for Sensitive Groups
Station 20 117 Unhealthy for Sensitive Groups
From an economic point of view, according to the rules of labor of Iran, the minimum wage per person is about USD 167.00 per month. Taking the population of 500,000 workers in government sectors and sensitive industrial centers of Tehran into account, a one-day closure at all levels will cause an economic loss of USD 8 million for the city. Nonetheless, designing a comprehensive map by means of the new GIS method with the power of pixelation and point to point calculation of pollution in the city showed that about 139,000 people faced unhealthy air quality, about 349,000 people were affected by unhealthy for sensitive groups air quality, and about 12,000 people in the region were only exposed to moderate air quality. Thus,
139,000 people needed to stop working that day, while the rest of the population could have continued working. Using this method, therefore, could reduce the daily loss from USD 8 million to about USD 2 million. This map is an example of applying this research in air pollution management of Tehran.
40,000-square-meter pixels in the city. The map pixelation made a significant contribution to calculation of the AQI anywhere in the city, according to which a part of the city that did not show any non-standard AQI ought not to get closed down. This is so, while in the past, due to the absence of a pixelation map in the city, AQI was calculated for the entire city and management was done on that basis. As AQI was calculated in terms of the highest concentrations of the six air pollutants, the total AQI of the city got measured in terms of the pollutant with the highest concentration and the management only decided on pollutants with the highest concentration. The innovation in this research, however, led to the identification of the highest concentrations of each pollutant in each of the pixel locations of the city. For example, a point of the city had the highest concentration of NO2, while another had the highest concentration of CO. Using this map, it is possible to calculate the concentration of the most significant pollutant for every single point in Tehran, and take controlling measures to reduce them, hence having a more effective management. On the other hand, this comprehensive map shows its effectiveness in time of crisis, so that areas with higher pollutant concentrations are detected and control measures are taken from these areas. Yet, in the past, due to the absence of an integrated map for the entire city and the use of an integrated AQI for the entire city of Tehran, the concentration of any pollutant for every single point of the city could not be calculated. Hence, it was impossible to declare a crisis in the more polluted areas. Another benefit of this comprehensive map is the possibility of its instantaneous updates, making it designed instantly at each time interval by giving an Excel input containing concentrations of pollutants by the air pollution monitoring stations in Tehran, available for air quality control managers of Tehran municipality.
CONCLUSION
a result, this comprehensive map has been designed for the first time in urban management and crisis declaration for Tehran's air, which can contribute to the economy and management of the air pollution crisis in Tehran and other metropolises around the globe.
References
Abbaspour, M., Monavari, M., Karbasi, A. and Kargari, N. (2011). Nuclear power and its role in CO2 emissions from the electricity generation sector in Iran. Energy Sources Part A-Recovery Utilization And Environmental Effects., 34 (1); 43-52.
Al-Hanbali, A., Alsaaideh, B. and Kondoh, A. (2011). Using GIS-Based Weighted Linear Combination Analysis and Remote Sensing Techniques to Select Optimum Solid Waste Disposal Sites within Mafraq City, Jordan. Journal of Geographic Information System., 3(4); 267–278. https://doi.org/10.4236/jgis.2011.34023.
Ansari, M., Pakrou, S., Abdoli, M. and Karbasi, A. (2015). Optimization of MSW Collection Routes Using GIS (Case Study: Tabriz City). Current World Environment, 10(Special-Issue1)., 43; 882–890. https://doi.org/10.12944/cwe.10.special-issue1.107. Babanezhad, E., Qaderi, F. and Salehi Ziri, M. (2018). Spatial modeling of groundwater quality based on using Schoeller diagram in GIS base: a case study of Khorramabad, Iran. Environmental Earth Sciences., 77(9); 32-40. https://doi.org/10.1007/s12665-018-7541-0.
Diodato, N. and Ceccarelli, M. (2004). Multivariate indicator Kriging approach using a GIS to classify soil degradation for Mediterranean agricultural lands. Ecological Indicators., 4(3); 177–187. https://doi.org/10.1016/j.ecolind.2004.03.002. Ebrahimi Ghadi, M., Qaderi, F. and Babanezhad, E. (2019). Prediction of mortality resulted from NO2 concentration in Tehran by Air Q+ software and artificial neural network. International Journal of Environmental Science and Technology., 16(3); 1351– 1368. https://doi.org/10.1007/s13762-018-1818-4. Ebrahimian-Ghajari, Y., AleSheikh, A. A., Modiri, M., Hosnavi, R. and Nekouei, M. A. (2016). Modeling of seismic vulnerability of urban buildings in geographic information system environment (case study: Babol city). Quarterly Scientific Journal of Rescue and Relief., 7(4); 18–29.
Fernandez, P., Mourato, S. and Moreira, M. (2016). Social vulnerability assessment of flood risk using GIS-based multicriteria decision analysis. A case study of Vila Nova de Gaia. Geomatics, Natural
Hazards and Risk., 7(4); 1367–1389. https://doi.org/10.1080/19475705.2015.1052021. García, P., Zapico, E. and Colubi, A. (2009). An angiosperm quality index (AQI) for Cantabrian estuaries. Ecological Indicators., 9(5); 856–865. https://doi.org/10.1016/j.ecolind.2008.10.002. Ghanghermeh, A. A., Roshan, Gh.R. and Nasrabadi, T. (2017). Synoptic approach to forecasting and statistical downscaling of climate parameters (Case study : Golestan Province). Pollution., 3(3); 487–504. https://doi.org/10.7508/pj.2017.03.013.
Greene, R., Devillers, R., Luther, J. E. and Eddy, B. G. (2011). GIS-Based Multiple-Criteria Decision Analysis. Geography Compass., 6; 412–432. https://doi.org/10.1111/j.1749-8198.2011.00431.x. Hashemi, M. and Alesheikh, A. A. (2011). A GIS-based earthquake damage assessment and settlement methodology. Soil Dynamics and Earthquake Engineering., 31(11); 1607–1617. https://doi.org/10.1016/j.soildyn.2011.07.003. Hosseini, V. and Shahbazi, H. (2016). Urban Air Pollution in Iran. Iranian Studies., 49(6); 1029–1046. https://doi.org/10.1080/00210862.2016.1241587. Huang, R. J., Zhang, Y., Bozzetti, C., Ho, K. F., Cao, J. J., Han, Y. and Prévôt, A. S. H. (2015). High secondary aerosol contribution to particulate pollution during haze events in China. Nature., 514(7521); 218– 222. https://doi.org/10.1038/nature13774.
Kumar, A. and Goyal, P. (2011). Forecasting of air quality in Delhi using principal component regression technique. Atmospheric Pollution Research., 2(4); 436–444. https://doi.org/10.5094/APR.2011.050. Lanzafame, R., Monforte, P., Patanè, G. and Strano, S. (2015). Trend analysis of Air Quality Index in Catania from 2010 to 2014. Energy Procedia., 82; 708–715. https://doi.org/10.1016/j.egypro.2015.11.796.
Li, Y., Chiu, Y. ho. and Lu, L. C. (2018). Energy and AQI performance of 31 cities in China. Energy
Policy., 122; 194–202.
https://doi.org/10.1016/j.enpol.2018.07.037. Liu, K. F.-R., Hung, M.-J., Kuo, J.-Y. and Liang, H.-H. (2015). Using GIS and Kriging to Analyze the Spatial Distributions of the Health Risk of Indoor Air Pollution. Journal of Geoscience and Environment Protection., 03(06); 20–25. https://doi.org/10.4236/gep.2015.36004.
Pollution is licensed under a "Creative Commons Attribution 4.0 International (CC-BY 4.0)" Exposure to particulate matter in India: A synthesis
of findings and future directions. Environmental
Research., 147; 480–496.
https://doi.org/10.1016/j.envres.2016.03.011. Pendlebury, D., Gravel, S., Moran, M. D. and Lupu, A. (2018). Impact of chemical lateral boundary conditions in a regional air quality forecast model on surface ozone predictions during stratospheric intrusions. Atmospheric Environment., 174; 148–170. https://doi.org/10.1016/j.atmosenv.2017.10.052. Peng, X., Wang, K. and Li, Q. (2014). A new power mapping method based on ordinary kriging and determination of optimal detector location strategy. Annals of Nuclear Energy., 68; 118–123. https://doi.org/10.1016/j.anucene.2014.01.002. Pummakarnchana, O., Tripathi, N. and Dutta, J. (2005). Air pollution monitoring and GIS modeling: A new use of nanotechnology based solid state gas sensors. Science and Technology of Advanced Materials., 6(3); 251–255. https://doi.org/10.1016/j.stam.2005.02.003. Qaderi, F., Sayahzadeh, A. H. and Azizi, M. (2018). Efficiency optimization of petroleum wastewater treatment by using of serial moving bed biofilm reactors. Journal of Cleaner Production., 192; 665– 677. https://doi.org/10.1016/j.jclepro.2018.04.257. Ruggieri, M. and Plaia, A. (2012). An aggregate AQI: Comparing different standardizations and introducing a variability index. Science of The
Total Environment., 420; 263–272. https://doi.org/10.1016/j.scitotenv.2011.09.019. Shad, R., Mesgari, M. S., abkar, A. and Shad, A. (2009). Predicting air pollution using fuzzy genetic linear membership kriging in GIS. Computers, Environment and Urban Systems., 33(6); 472–481. https://doi.org/10.1016/j.compenvurbsys.2009.10.004. Sumiani, Y., Onn, C. C., Mohd Din, M. A. and Wan Jaafar, W. Z. (2009). Environmental planning strategies for optimum solid waste landfill siting. Sains Malaysiana., 38(4); 457–462.