in the population sciences published by the Max Planck Institute for Demographic Research Konrad-Zuse Str. 1, D-18057 Rostock · GERMANY www.demographic-research.org
DEMOGRAPHIC RESEARCH
VOLUME 17 ARTICLE 5, PAGES 109-134
PUBLISHED 24 AUGUST 2007
http://www.demographic-research.org/Volumes/Vol17/5/ DOI: 10.4054/DemRes.2007.17.5
Descriptive Finding
Characteristics of urban regions and
all-cause mortality in working-age population:
Effects of social environment and
interactions with individual unemployment
Jenni Blomgren
Tapani Valkonen
© 2007 Blomgren & Valkonen
1 Introduction 110
2 Data and methods 112
2.1 Structure of the data 112
2.2 Individual-level variables 114
2.3 Region-level variables 117
2.4 Methods 119
3 Results 121
3.1 Effects of individual-level variables 121
3.2 Effects of the population composition and characteristics of regions
121
3.3 Cross-level interactions between long-term unemployment and regional social characteristics
125
4 Conclusion 129
5 Acknowledgements 131
Characteristics of urban regions and all-cause mortality
in working-age population:
Effects of social environment and interactions
with individual unemployment
Jenni Blomgren 1
Tapani Valkonen 2
Abstract
Using Finnish register data on individuals linked to information on urban regions, this study aimed to estimate the effects of some regional characteristics on all-cause mortality among working-age population in 1995-2001, and to find out whether these effects are different among those long-term unemployed than among others. Multilevel Poisson regression models were used. The characteristics of regions included unemployment rate, level of urbanisation, voting turnout, a summary measure of family cohesion, and the geographic location of the region. Our study showed that effects of most area characteristics on mortality were clear among those who suffered from long-term unemployment in the baseline but not among others, adjusting for basic socio-demographic characteristics of the individuals. The results thus suggest that the weaker in the society are more vulnerable to the effects of social environment than those better off.
1
National Public Health Institute Department of Health and Functional Capacity Mannerheimintie 166 00300 Helsinki Finland Tel.: +358-9-47448633. E-mail: [email protected]
1. Introduction
Many multilevel studies have found effects of characteristics of areas on health and mortality after controlling for socioeconomic and other characteristics of individuals (e.g., Anderson et al. 1997, Blomgren et al. 2004, Davey Smith et al. 1998, Haan, Kaplan, and Camacho 1987, Martikainen, Mäki, and Blomgren 2004, Sloggett and Joshi 1998, Yen and Kaplan, 1999). Studies have been conducted on different area levels, with different area characteristics and adjusting for different individual variables, which complicates the comparability of the results. However, a consensus seems to prevail about the importance of community and area characteristics affecting health and mortality, but the effects are generally admitted to be modest compared to the effects of individual-level socioeconomic effects (see review of Pickett and Pearl 2001).
Most above-mentioned multilevel studies have focused on the effects of socioeconomic structure, unemployment rate or deprivation of areas and have generally reached the conclusion that poor socioeconomic circumstances induce adverse effects on mortality. Areas have also been characterised by their level of social capital or social cohesion. Social capital has been measured in a variety of ways, often based on Putnam’s definition of the density of memberships in associations, levels of interpersonal trust and strengths of mutual aid and reciprocity (Kawachi and Berkman 2000, Putnam 1993). Defined in the Putnam way, social capital has been found to be associated with health and mortality in many studies both at the state level in the US (Kawachi, Kennedy, and Glass 1999, Kawachi et al. 1997) as well as at the neighbourhood level (Lochner et al. 2003). Other studies have used voting turnout and strength of traditional family norms as measures of social capital or social cohesion and have found that low levels of social cohesion are associated with increased alcohol-related and suicide mortality (Blomgren et al. 2004, Martikainen et al. 2004).
exceptionally deep economic recession in the beginning of the 1990’s offers a special circumstance for investigating the effects of individual unemployment on mortality. During the deepest recession in 1993 and 1994, unemployment rates reached nearly 20%. In this context with high unemployment risks irrespective of health status, the selection effect to unemployment can be assumed to be smaller than in more favourable economic circumstances (Martikainen and Valkonen 1996).
Even though effects of individual characteristics and increasingly also area characteristics on mortality are well researched, less is known about their interaction effects. The question is whether the effects of area characteristics vary according to individual characteristics or, correspondingly, whether the effects of the individual characteristics depend on the value of the area variables, for example whether the level of deprivation of an area modifies the effects of individual socioeconomic status on health (Blakely and Woodward 2000). One hypothesis on cross-level interactions postulates that disadvantage of the area may be more fatal to disadvantaged individuals and that advantaged individuals may be less vulnerable since their personal resources protect them from the stressors in deprived areas. Similarly, advantaged areas may have a protective effect on disadvantaged individuals because of the better collective and social resources of these areas (Martikainen et al. 2004, Stafford and Marmot 2003). According to a contrary hypothesis, living in socially advantaged areas may increase the mortality risk of disadvantaged individuals because of the observed discrepancy between individual status and the general social environment (Stafford and Marmot 2003). For example, high general unemployment rates may be associated with less psychosocial stress and thus imply smaller repercussions compared to low unemployment rates for those suffering from unemployment (Cohn 1978, Platt and Kreitman 1985).
Supporting the second hypothesis, some studies on health and mortality have found larger socioeconomic differences in mortality in the most advantaged areas compared to the most disadvantaged areas (Ecob and Jones 1998, Yen and Kaplan 1999), suggesting differential access to resources in the advantaged areas or alternatively giving evidence to the relative deprivation hypothesis. On the other hand, some studies have found evidence for the first hypothesis and observed larger differences according to individuals’ socioeconomic status in more deprived areas (Jones, Gould, and Duncan 2000) and stronger effects of individual unemployment in high unemployment areas (Turner 1995). Some studies have found no consistent interactions between area and individual socioeconomic status (Martikainen, Kauppinen, and Valkonen 2003, Martikainen et al. 2004) or between area and individual unemployment (Béland, Birch, and Stoddart 2002).
socioeconomic variables at individual and area levels. More research is needed on whether the effects of social cohesion, for example, are different for the advantaged and disadvantaged in the society.
The main aims of this study are to estimate the effects of different aspects of regional social environment on all-cause mortality adjusting for individual-level covariates and to find out whether the effects of these regional characteristics on mortality vary according to individual’s unemployment status. We are not aware of previous studies on mortality aiming to assess interactions between the unemployment of individuals and a set of regional variables characterising the social environment.
2. Data and methods
2.1 Structure of the data
Map 1: Urban regions of Finland
25 Loimaa region 41 Rauma region 43 Pori region
The individual-level data are register data from Statistics Finland (permission TK53-736-04). The data set was based on the longitudinal individual-level data file of employment statistics for the years 1989-2001. The file is updated annually and contains detailed information on the labour market position and several socio-demographic characteristics on all persons living in Finland. The records of this file were linked to longitudinal census records and to the death register. Based on information from 1993, those who were 30-54 years old, lived in urban regions, were Finnish- or Swedish-speaking and wage earners or unemployed were included in the data set. Those with missing information for 1994 were excluded because data on unemployment was measured on a two-year period 1993-1994. For those who were unemployed or whose occupation was unknown, occupational class was retrieved retrospectively from a previous year for which it was available. Students, entrepreneurs, farmers, pensioners and those whose socioeconomic status remained unknown were excluded.
The study cohort includes 638 294 women (who lived about 4.4 million person years during the follow-up 1995-2001) and 610 157 men (about 4.2 million person years). Altogether women in this cohort experienced 7219 deaths and men 17062 deaths in years 1995-2001.
2.2 Individual-level variables
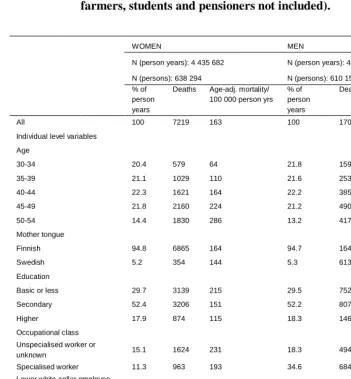
Table 1: Distribution of the individual- and region-level independent
variables and age-adjusted mortality per 100 000 person years in 1995-2001 according to each variable. Women and men
aged 30-54 in Finnish urban regions in 1993 (entrepreneurs, farmers, students and pensioners not included).
WOMEN MEN
N (person years): 4 435 682 N (person years): 4 206 394
N (persons): 638 294 N (persons): 610 157
% of person years
Deaths Age-adj. mortality/ 100 000 person yrs
% of person years
Deaths Age-adj. mortality/ 100 000 person yrs
All 100 7219 163 100 17062 406
Individual level variables
Age
30-34 20.4 579 64 21.8 1597 174
35-39 21.1 1029 110 21.6 2535 280
40-44 22.3 1621 164 22.2 3851 412
45-49 21.8 2160 224 21.2 4900 548
50-54 14.4 1830 286 13.2 4179 751
Mother tongue
Finnish 94.8 6865 164 94.7 16449 414
Swedish 5.2 354 144 5.3 613 254
Education
Basic or less 29.7 3139 215 29.5 7524 551
Secondary 52.4 3206 151 52.2 8076 398
Higher 17.9 874 115 18.3 1462 189
Occupational class
Unspecialised worker or
unknown 15.1 1624 231 18.3 4948 650
Specialised worker 11.3 963 193 34.6 6840 473
Lower white-collar employee,
not independent 28.8 1854 148 5.1 731 361
Lower white-collar employee,
independent work 26.1 1772 151 17.9 2380 309
Upper white-collar employee 18.6 1006 126 24 2163 210
Family type
Couple with child(ren) 57.1 2882 122 57.7 5836 244
Couple, no child(ren) 17.5 1817 216 17.1 3116 401
Single parent with child(ren) 10.8 817 174 1.8 355 420
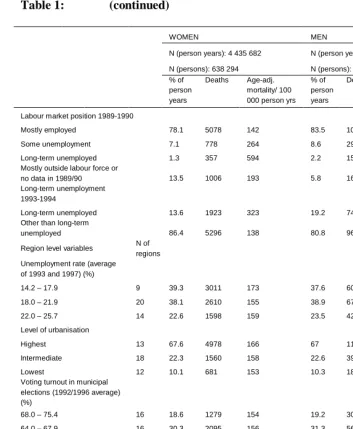
Table 1: (continued)
WOMEN MEN
N (person years): 4 435 682 N (person years): 4 206 394
N (persons): 638 294 N (persons): 610 157
% of person years
Deaths Age-adj. mortality/ 100 000 person yrs
% of person years
Deaths Age-adj. mortality/ 100 000 person yrs
Labour market position 1989-1990
Mostly employed 78.1 5078 142 83.5 10872 306
Some unemployment 7.1 778 264 8.6 2935 876
Long-term unemployed 1.3 357 594 2.2 1587 1681
Mostly outside labour force or
no data in 1989/90 13.5 1006 193 5.8 1668 727
Long-term unemployment 1993-1994
Long-term unemployed 13.6 1923 323 19.2 7454 930
Other than long-term
unemployed 86.4 5296 138 80.8 9608 282
Region level variables N of regions Unemployment rate (average
of 1993 and 1997) (%)
14.2 – 17.9 9 39.3 3011 173 37.6 6016 380
18.0 – 21.9 20 38.1 2610 155 38.9 6777 414
22.0 – 25.7 14 22.6 1598 159 23.5 4269 432
Level of urbanisation
Highest 13 67.6 4978 166 67 11232 403
Intermediate 18 22.3 1560 158 22.6 3985 408
Lowest 12 10.1 681 153 10.3 1845 416
Voting turnout in municipal elections (1992/1996 average)
(%)
68.0 – 75.4 16 18.6 1279 154 19.2 3067 375
64.0 – 67.9 16 30.3 2095 156 31.3 5631 426
60.0 – 63.9 11 51.1 3845 170 49.5 8364 405
Level of family cohesion
Highest 13 13.3 866 147 13.9 2145 364
Intermediate 13 19 1332 159 19.7 3510 424
Lowest 17 67.7 5021 167 66.4 11407 409
Geographic location
South / West 23 69.8 5107 164 68.5 11254 389
The contents of the categories of individual-level variables are largely self-explanatory with the exception of the two variables of labour market position. These are formed based on information on yearly months of employment and unemployment derived from the registers of the employment administration. Labour market status in 1989-1990 was included in order to adjust for a possible longer-term exclusion from the labour market that was not initiated by the recession of the early 1990’s. Those who were employed at least 12 months during the two-year period and did not experience unemployment (but could be outside the labour force for some time) were classified as mostly employed. Those who suffered from 1 to 11 months of unemployment were classified as having some unemployment experiences. Those suffering from 12 to 24 months of unemployment were classified as long-term unemployed. Those being mostly outside the labour force and those for whom this two-year variable could not be formed due to missing data in either year formed the last category. Labour market position in 1993-1994 was included as a dichotomous variable, only separating the long-term unemployed from others to ease the treatment of interactions. Long-term unemployment in 1993-1994 was defined as described above.
Due to limitations of register-based data, we had no information on previous health status of the individuals and therefore cannot totally control for the possible selection effects of those in poorer health having both higher risks of unemployment, higher risks of mortality and possibly different propensity to move into certain types of areas compared to others. However, by adjusting for pre-recession labour market status and for other individual socio-demographic covariates related to health status we aim to account for at least part of the possible selection effect. For example, we assume that those who were unemployed and especially long-term unemployed already during the pre-recession economic boom were generally in poorer health compared to those employed. Over and above these controls, we may assume that the possible effects of selective migration in this relatively large area scale are of lesser importance than in studies comparing smaller units such as neighbourhoods or municipalities, for example (Blalock 1984).
2.3 Region-level variables
Region-level variables are the following:
• Unemployment rate, average of years 1993 and 1997 (%). (StatFin database.)
• Level of urbanisation, a sum variable of two standardized variables:
o The proportion of persons working in other industries than agriculture, forestry and fishing industry in 1993 of all employed persons aged 15-64 (%). (Aggregated from individual-level data.)
o The proportion of persons living in a densely populated area in 1990 of men aged 25-64 (%) (a densely populated area is defined as a group of buildings of at least 200 inhabitants where the distance between buildings is normally not more than 200 metres). (Aggregated from individual-level data.)
• Voting turnout in municipal elections, average of years 1992 and 1996 (%). (StatFin database.)
• Family cohesion, a sum variable of three standardized variables:
o The proportion of one-person households of all households in 1995 (%). (Published statistics in Kuntakirja 1995.)
o The proportion of single parent families of all families with children in 1995 (%). (Published statistics in Kuntakirja 1995.)
o The proportion of divorced (by 1997) of those aged 30-54 who were married in 1993 (%). (Aggregated from individual-level data.)
• Geographic location (classified according to old province frontiers).
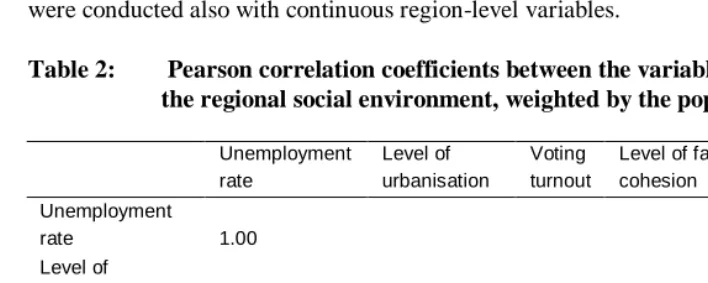
characterised by low levels of family cohesion. Also the two dimensions of social cohesion showed a moderate correlation, r=0.57.
In addition to the social characteristics of the regions, geographic location was included to adjust for the known mortality difference between Western/Southern and Eastern/Northern Finland which has still partly remained unexplained and may be due to, e.g., genetic differences of the populations which cannot be taken directly into account in this study (Koskinen 1995, Valkonen 2001).
The variables were each categorised into three classes except for geographic location. Unemployment rate and voting turnout were classified into approximately even intervals according to the rate. The classes of the level of urbanisation and family cohesion were formed by dividing the values of the sum variables into three using -1 and +1 as the cutting points. The classes and distributions of the variables with deaths and age-adjusted death rates in each class are shown in Table 1. Confirmatory analyses were conducted also with continuous region-level variables.
Table 2: Pearson correlation coefficients between the variables describing the regional social environment, weighted by the population. a, b
Unemployment rate
Level of urbanisation
Voting turnout
Level of family cohesion
Geographic location Unemployment
rate 1.00
Level of
urbanisation -0.41 1.00
Voting turnout -0.08 -0.49 1.00
Level of family
cohesion 0.49 -0.64 0.57 1.00
Geographic
location 0.62 -0.32 -0.28 0.39 1.00
a
All correlations are statistically significant (p<0.01).
b All variables as continuous expect for geographic location (South / West vs. North / East).
2.4 Methods
the number of deaths and the number of person years lived during the seven-year follow-up period 1995-2001. The total number of non-empty cells was 129 543. The values of the region-level variables were linked to the cells of the tabulated data by means of the regional identification code.
First, we calculated age-adjusted death rates according to classes of the individual- and region-level variables. To assess the extent of regional variation, we calculated these death rates also for each urban region, women and men separately. Second, regional variation and effects of individual- and region-level variables on mortality were assessed with multilevel Poisson regression models (Langford and Day 2001, Snijders and Bosker 1999). The models were fitted with SAS 8 Glimmix macro (Littell et al. 1996). In the models we used the number of deaths in the cells as the dependent variable, a Poisson distribution assumption, a log link, and the logarithm of person years as an offset. The results are presented as mortality rate ratios with the mortality in the reference group of each variable set at 1.00. The models are random intercepts models in which the regression coefficients of the independent variables are assumed to be the same for all areas (so called fixed effects), but the intercepts are allowed to vary across areas (random effects) (Snijders and Bosker 1999).
The method allows estimating posterior values for regional mortality rate ratios in each model, which indicate how much the mortality rate in each region deviates relatively from the average when a set of variables has been adjusted for. These estimated deviations are somewhat smoothed towards the average since multilevel analysis, using Bayesian estimation methods, diminishes variation in the data by using information on all higher level units when calculating the estimates (Snijders and Bosker 1999). Based on these regional deviations, regional average relative deviation was calculated from each model in order to assess the contribution of individual- and region-level variables in explaining regional differences in mortality. The formula is presented in Table 3.
3. Results
3.1 Effects of individual-level variables
The age-adjusted mortality rate was 163 per 100 000 person years among women and 406 among men (Table 1). The proportion of deceased in 1995-2001 of the 1993 baseline study cohort was 1.1% of women and 2.8% of men. Age-adjusted death rates according to the individual-level variables are listed in Table 1. The effects of individual-level socio-demographic characteristics in multilevel models will not be reported in detail since they are not of primary interest in this study (results available from the first author). The effects of these characteristics followed expected patterns, and after mutual adjustment they were all statistically significantly associated with mortality except for mother tongue among women.
When all other individual-level characteristics and previous labour market position had been adjusted for, the long-term unemployed of the period 1993-1994 had a 1.7-fold mortality among women and 1.8-1.7-fold among men compared to those who were mainly working at the time.
3.2 Effects of the population composition and characteristics of regions
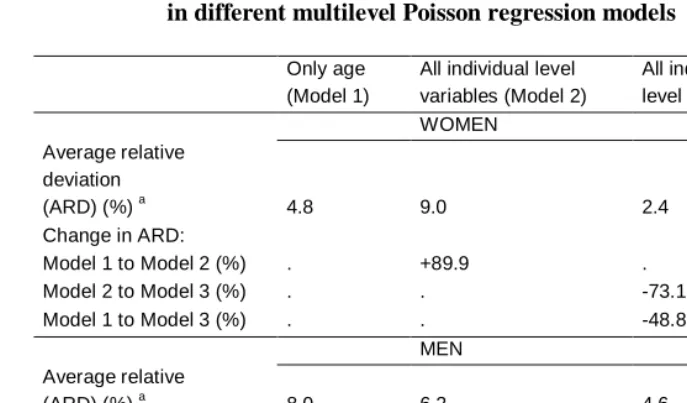
Table 3: Average relative deviations of the regional mortality rate ratios in different multilevel Poisson regression models
Only age (Model 1)
All individual level variables (Model 2)
All individual and region level variables (Model 3) WOMEN
Average relative deviation
(ARD) (%) a 4.8 9.0 2.4
Change in ARD:
Model 1 to Model 2 (%) . +89.9 .
Model 2 to Model 3 (%) . . -73.1
Model 1 to Model 3 (%) . . -48.8
MEN Average relative
(ARD) (%) a 8.0 6.2 4.6
Change in ARD:
Model 1 to Model 2 (%) . -22.6 .
Model 2 to Model 3 (%) . . -25.6
Model 1 to Model 3 (%) . . -42.4
a Average relative deviation was calculated as
where RRi=estimated mortality rate ratio of the region compared to the average, RR=average mortality among women or men, popi=person years share of the region, and n=number of regions (=43).
Because regional variation in mortality was not explained by differences in the regional population compositions, we continued the analysis by adding regional characteristics to the model. Results from three types of models are shown in Table 4: 1) each regional variable and age in the model, 2) each regional variable and all individual-level variables in the model and 3) all individual and regional variables in the model. Results from the first type of models show whether each regional variable was associated with mortality when only age was adjusted for. These associations can, however, be explained by differences in individuals’ characteristics. Thus, results from the second type of models indicate whether there are ‘true’ area effects. In the third type of models all regional variables are taken into account. These show the net effects of each variable when adjusting for each other and for the individual-level variables.
) * (
* 100
1
i n
i
i pop
RR RR RR
ARD
∑
=
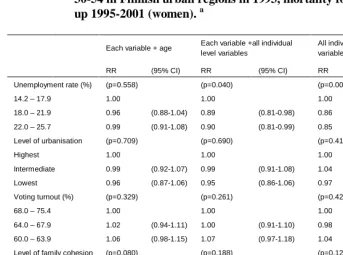
Table 4: Mortality rate ratios (RR) according to the region-level variables from multilevel Poisson regression models. Women and men aged 30-54 in Finnish urban regions in 1993, mortality follow-
up 1995-2001 (women). a
Each variable + age Each variable +all individual level variables
All individual and region level variables
RR (95% CI) RR (95% CI) RR (95% CI)
Unemployment rate (%) (p=0.558) (p=0.040) (p=0.005)
14.2 – 17.9 1.00 1.00 1.00
18.0 – 21.9 0.96 (0.88-1.04) 0.89 (0.81-0.98) 0.86 (0.78-0.95)
22.0 – 25.7 0.99 (0.91-1.08) 0.90 (0.81-0.99) 0.85 (0.76-0.94)
Level of urbanisation (p=0.709) (p=0.690) (p=0.415)
Highest 1.00 1.00 1.00
Intermediate 0.99 (0.92-1.07) 0.99 (0.91-1.08) 1.04 (0.96-1.13)
Lowest 0.96 (0.87-1.06) 0.95 (0.86-1.06) 0.97 (0.88-1.08)
Voting turnout (%) (p=0.329) (p=0.261) (p=0.424)
68.0 – 75.4 1.00 1.00 1.00
64.0 – 67.9 1.02 (0.94-1.11) 1.00 (0.91-1.10) 0.98 (0.89-1.08)
60.0 – 63.9 1.06 (0.98-1.15) 1.07 (0.97-1.18) 1.04 (0.92-1.16)
Level of family cohesion (p=0.080) (p=0.188) (p=0.120)
Highest 1.00 1.00 1.00
Intermediate 1.08 (0.98-1.19) 1.06 (0.95-1.18) 1.07 (0.97-1.18)
Lowest 1.10 (1.01-1.20) 1.10 (0.99-1.21) 1.11 (1.01-1.23)
Geographic location (p=0.685) (p=0.824) (p=0.414)
South / West 1.00 1.00 1.00
North / East 1.01 (0.95-1.08) 0.99 (0.92-1.07) 1.04 (0.95-1.14)
a
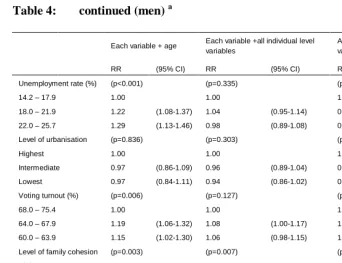
Table 4: continued (men) a
Each variable + age Each variable +all individual level variables
All individual and region level variables
RR (95% CI) RR (95% CI) RR (95% CI)
Unemployment rate (%) (p<0.001) (p=0.335) (p=0.166)
14.2 – 17.9 1.00 1.00 1.00
18.0 – 21.9 1.22 (1.08-1.37) 1.04 (0.95-1.14) 0.99 (0.90-1.09)
22.0 – 25.7 1.29 (1.13-1.46) 0.98 (0.89-1.08) 0.92 (0.83-1.03)
Level of urbanisation (p=0.836) (p=0.303) (p=0.780)
Highest 1.00 1.00 1.00
Intermediate 0.97 (0.86-1.09) 0.96 (0.89-1.04) 0.99 (0.92-1.07)
Lowest 0.97 (0.84-1.11) 0.94 (0.86-1.02) 0.97 (0.89-1.06)
Voting turnout (%) (p=0.006) (p=0.127) (p=0.504)
68.0 – 75.4 1.00 1.00 1.00
64.0 – 67.9 1.19 (1.06-1.32) 1.08 (1.00-1.17) 1.05 (0.96-1.15)
60.0 – 63.9 1.15 (1.02-1.30) 1.06 (0.98-1.15) 1.02 (0.92-1.14)
Level of family cohesion (p=0.003) (p=0.007) (p=0.021)
Highest 1.00 1.00 1.00
Intermediate 1.21 (1.07-1.37) 1.11 (1.02-1.21) 1.12 (1.03-1.22)
Lowest 1.18 (1.05-1.33) 1.13 (1.04-1.22) 1.12 (1.02-1.22)
Geographic location (p<0.001) (p=0.459) (p=0.410)
South / West 1.00 1.00 1.00
North / East 1.17 (1.07-1.29) 1.03 (0.96-1.10) 1.04 (0.95-1.14)
a
P-values in parentheses show the significance of each single variable in the respective model.
Regional unemployment rate was not associated with mortality among women in the first type of model, but when the individual-level variables were entered, an effect of unemployment rate was revealed: living in the regions with higher unemployment rate meant an about 10% lower mortality risk than living in the regions with the lowest unemployment rate. Among men, on the other hand, living in high unemployment regions was associated with higher mortality, but the effect disappeared when individual variables were adjusted for. Since the correlations between area variables were low or moderate, these associations were not much affected by adding other area variables in the model.
19% higher mortality risk compared to the most active regions. However, when individual-level variables were added, most of this effect disappeared.
The level of family cohesion had the most consistent effects on mortality of the regional variables included in the analyses. Among women, living in regions with the lowest family cohesion meant an about 10% elevated mortality risk compared to regions with highest family cohesion. This result was not altered with inclusion of other variables. The middle category showed an estimate in between the others but did not differ statistically significantly from the reference category. Among men, the results were broadly similar: the regions characterised by lowest or intermediate level of family cohesion had an about 11-13% higher mortality risk than regions with highest cohesion when adjusted for the population structure. The intermediate and low cohesion regions thus formed one group compared to the high cohesion regions.
Geographic location had no effect on mortality among women. Among men, northern and eastern regions had higher mortality than southern or western regions. However, this difference was explained by differences in the population composition of these geographical areas.
The results concerning area effects remained broadly the same when the same analyses were performed by replacing the categorical region-level variables by continuous variables.
In Table 3, the last columns for women and men show the average relative deviations from the models that adjust for all variables. Among women, ARD from the individual effects model was decreased by 73% and among men by 26%. In total, the individual and regional variables in the model explained about 49% of the total regional age-adjusted mortality variation among women and 42% among men, respectively. There was thus remaining regional variation related to other variables than those taken into account in these analyses.
3.3 Cross-level interactions between long-term unemployment and regional social characteristics
category of the area-level variable. 95% confidence intervals were calculated relative to the reference category of the area variable separately among the long-term unemployed and among the others.
All interactions were statistically significant except for the level of urbanisation among men. In most cases, effects of regional social environment were observed among the long-term unemployed but not among others. The effect of the regional unemployment rate on mortality among women (Figure 1a) observed in Table 4 was produced by this effect among the long-term unemployed only, and there was no effect among the others. Figure 1a shows that living in lowest unemployment regions compared to highest unemployment regions produced a clearly increased mortality risk among the unemployed but there was no effect among the others. Among men (Figure 1b) the results were roughly similar but not as clear.
Figure 1: Effect of the regional unemployment rate on mortality 1995-2001 by individual long-term unemployment in 1993-1994, adjusted for all individual-level variables. Mortality rate ratios + 95% CI.
a. Women (p<0.001).
2.01
1.50 1.53
1.00 0.95 0.95
0.00 0.50 1.00 1.50 2.00 2.50
14.1-17.9% 18.0-21.9% 22.0-25.7%
Unemployment rate
RR
Long-term unemployed Others
b. Men (p<0.001).
1.96 1.92
1.76
1.00 1.08 1.05
0.00 0.50 1.00 1.50 2.00 2.50
14.1-17.9% 18.0-21.9% 22.0-25.7%
Unemployment rate
RR
Figure 2: Effect of the regional level of urbanisation on mortality 1995-2001 by individual long-term unemployment in 1993-1994, adjusted for all individual-level variables. Mortality rate ratios + 95% CI.
a. Women (p<0.001).
1.62 1.55
1.86
0.99 1.06 1.00
0.00 0.50 1.00 1.50 2.00 2.50
Lowest Intermediate Highest Level of urbanisation
RR
Long-term unemployed Others
b. Men (p=0.340).
1.67 1.74 1.85
0.96 0.98 1.00
0.00 0.50 1.00 1.50 2.00 2.50
Lowest Intermediate Highest Level of urbanisation
RR
Long-term unemployed Others
Figure 3: Effect of the regional voting turnout on mortality 1995-2001 by individual long-term unemployment in 1993-1994, adjusted for all individual-level variables. Mortality rate ratios + 95% CI
a. Women (p=0.005).
1.91
1.60 1.54
1.01 0.99 1.00
0.00 0.50 1.00 1.50 2.00 2.50
60.0-63.9% 64.0-67.9% 68.0-75.4% Voting turnout
RR
Long-term unemployed Others
b. Men (p=0.006).
1.93 1.87
1.71
1.01 1.07 1.00
0.00 0.50 1.00 1.50 2.00 2.50
60.0-63.9% 64.0-67.9% 68.0-75.4% Voting turnout
RR
Figure 4: Effect of the regional level of family cohesion on
mortality 1995-2001 by individual long-term unemployment in 1993-1994, adjusted for all individual-level variables. Mortality rate ratios + 95% CI.
a. Women (p<0.001).
1.85
1.63
1.33 1.00 1.00 1.00
0.00 0.50 1.00 1.50 2.00 2.50
Lowest Intermediate Highest Level of family cohesion
RR
Long-term unemployed Others
b. Men (p<0.001).
2.00
1.81
1.60 1.05 1.10 1.00
0.00 0.50 1.00 1.50 2.00 2.50
Lowest Intermediate Highest Level of family cohesion
RR
Long-term unemployed Others
The interactions of long-term unemployment and the regional level of urbanisation (Figure 2a and 2b) were less consistent. Among women, there was some indication that living in the most urbanised regions was associated with higher mortality among the long-term unemployed but not among others. Among men no interaction effect was observed.
4. Conclusion
Area effects on mortality indicate unequal chances of health and well-being between different areas. The area effect approach has gained growing importance in research into mortality during the past decade since it has been suggested that characteristics of areas may have an effect on the health of individuals over and above their personal characteristics, and that interventions to promote health should be targeted on socially disadvantaged areas rather than focused on certain population groups (Diez-Roux 2001, Robert 1999).
This study aimed to assess the effects of regional social environment on all-cause mortality among working-aged women and men in Finland with a special focus on cross-level interactions between individual unemployment status and regional characteristics. Our main results indicate area effects related to two dimensions of regional differentiation: that of depression or economic well-being, measured with regional unemployment rates, and that of the strength of social relationships, measured with family cohesion and voting activity. The regional differentiation in Finland according to these two dimensions may be roughly characterized as follows. Unemployment rates are lowest in the traditionally most industrialized regions in the South and West and rise towards the more distant regions of East and North. Social cohesion, on the other hand, is strongest in the regions on the West Coast and in some regions in Central Finland and lowest in the South and East. The patterns of cohesion observed today still seem to reflect the historical patrimony of village-based habitation in the West as opposed to more scattered settlement in the East (Riihinen 1965), and they also reflect differences in levels of urbanisation, as observed in the moderate correlation between family cohesion and level of urbanisation. Combined, these dimensions reveal a pattern of low unemployment rates and low strength of social ties in the urbanised South, low unemployment rates but high levels of cohesion in the West Coast, and higher unemployment rates with various levels of cohesion in the more rural Eastern, Central and Northern regions of the country.
worse-off areas (Stafford & Marmot 2003). Supporting the first interaction hypothesis, we found that living in regions characterised by lowest unemployment rates meant a clearly higher mortality risk for the long-term unemployed individuals compared to those living in areas of highest unemployment rates when individual level covariates were adjusted for. The finding may reflect relative deprivation and a labelling effect: the unemployed in low-unemployment areas may perceive a disparity between their own position and the position of those living in the same region and they may thus experience higher levels of psychosocial stress. They may also be treated as a deviant group in the society, which can lead to a twist of social exclusion (Cohn 1978, Gallie and Russell 1998, Platt and Kreitman 1985, Stafford and Marmot 2003). Mechanisms of social comparison may thus increase mortality in the unemployed group in regions where unemployment is rare.
However, since we could not control for previous health status, we cannot rule out the possibility that selection may at least partly explain the finding of the long-term unemployed being in highest mortality risks in areas with lowest unemployment rates. To minimize the possibility of selection, we adjusted for several individual level socio-demographic characteristics as well as pre-recession labour market status as a proxy for health status. Net of these adjustments, the long-term unemployed living in low-unemployment regions may still have been in generally poorer health status and have other more unfavourable characteristics compared to the perhaps more heterogeneous group of those unemployed living in high-unemployment areas.
Furthermore, our results showed that living in regions of low family cohesion and low voting turnout meant an increased mortality risk for the long-term unemployed but not for others. Correspondingly, own unemployment was more fatal to those living in low cohesion regions compared to those living in high cohesion regions. Strong social cohesion had a protective effect on disadvantaged individuals, helping to overcome the problems that may arise from individual’s unemployment experiences. These effects may be related to the strength of social support, to psychosocial mechanisms and to lack of participation in low cohesion areas. This finding seems to support the second type of interaction hypothesis of those less well-off coping better in better-off areas. However, the above mentioned interaction theories have been formed in relation to area deprivation only (Stafford & Marmot 2003) and may thus not be generalized to other types of area measures. More research and theory formulation is needed on interactions according to various dimensions of area differentiation.
in the society are more vulnerable to the characteristics of the social environment than those better off, and, correspondingly, that the mortality differences between groups of individuals may vary according to area characteristics. The earlier results of relatively small area effects on mortality may have been a consequence of analysing the general population and not taking into account that area effects may concern only sub-populations such as the unemployed or other vulnerable groups. Studies on area effects on health and mortality would gain more depth by considering interactions between individual and area levels. Future studies should also focus on finding out through which mechanisms the area effects are demonstrated especially among those less well-off in the society.
5. Acknowledgements
References
Anderson, R. T., Sorlie, P., Backlund, E., Johnson, N., Kaplan, G. A. (1997). “Mortality Effects of Community Socioeconomic status.” Epidemiology, 8, 1: 42-47. Antikainen, J. (2001). “Functional Regions of the Future – the Finnish Urban Network
Study 2001.” Journal of Nordregio, 3/2001: 20-23.
Bartley, M. (1994). “Unemployment and ill health: Understanding the relationship.” Journal of Epidemiology and Community Health, 48, 4: 333-337.
Bartley, M., Ferrie, J. (2001). “Glossary: unemployment, job insecurity, and health.” Journal of Epidemiology and Community Health, 55, 11: 776-778.
Baum, F. (1999). “Social capital. Is it good for your health? Issues for a public health agenda.” Journal of Epidemiology and Community Health, 53, 4: 195-196. Béland, F., Birch, S., Stoddart, G. (2002). “Unemployment and health: contextual-level
influences on the production of health in populations.” Social Science & Medicine, 55, 11: 2033-2052.
Blakely, T. A., Woodward, A. J. (2000). “Ecological effects in multi-level studies.” Journal of Epidemiology and Community Health, 54, 5: 367-374.
Blalock, H. M. (1984). Contextual-effects models: theoretical and methodological issues. Annual Review of Sociology, 10: 353-372.
Blomgren, J., Martikainen, P., Mäkelä, P., Valkonen, T. (2004). ”The effects of regional characteristics on alcohol-related mortality – a register-based multilevel analysis of 1.1 million men.” Social Science & Medicine, 58, 12: 2523-2535.
Cohn, R. M. (1978). “The Effect of Employment Status Change on Self-Attitudes.” Social Psychology, 41, 2: 81-93.
Davey Smith, G., Hart, C., Watt, G., Hole, D., Hawthorne, V. (1998). “Individual social class, area based deprivation, cardiovascular risk factors, and mortality: the Renfrew and Paisley study.” Journal of Epidemiology and Community Health, 52, 6: 399-405.
Diez-Roux, A. V. (2001). “Investigating Neighborhood and Area Effects on Health.” American Journal of Public Health, 91, 11: 1783-1789.
Duncan C., Jones, K., Moon, G. (1998). “Context, composition and heterogeneity: using multilevel models in health research.” Social Science & Medicine, 46, 1: 97-117.
Gallie, D., Russell, H. (1998). “Unemployment and life satisfaction: A cross-cultural comparison.” European Journal of Sociology, 39, 2: 248-280.
Haan, M., Kaplan, G. A., Camacho, T. (1987). “Poverty and health. Prospective evidence from the Alameda County Study.” American Journal of Epidemiology, 125, 6: 989-998.
Jones, K., Gould, M. I., Duncan, C. (2000). “Death and deprivation: an exploratory analysis of deaths in the Health and Lifestyle survey.” Social Science & Medicine, 50, 7-8: 1059-1079.
Kawachi, I., Berkman, L. (2000). Social Cohesion, Social Capital, and Health. In: L. Berkman, I. Kawachi (Eds.), Social Epidemiology. Oxford: Oxford University Press: 174-190.
Kawachi, I., Kennedy, B. P., Lochner, K., Prothrow-Stith, D. (1997). “Social Capital, Income Inequality, and Mortality.” American Journal of Public Health, 87, 9: 1491-1498.
Kawachi, I., Kennedy, B. P., Glass, R. (1999). “Social Capital and Self-Rated Health: A Contextual Analysis.” American Journal of Public Health, 89, 8: 1187-1193. Koskinen, S. (1995). Regional Differences in Mortality from Ischaemic Heart Disease
in Finland. In: A. D. Lopez, G. Caselli, T. Valkonen (Eds.), Adult Mortality in Developed Countries: From Description to Explanation. Oxford: Clarendon Press: 261-285.
Kuntakirja 1995. SVT Väestölaskenta 1995 Osa 2. Helsinki: Statistics Finland, 1998. Littell, R. C., Milliken, G. A., Stroup, W. W., Wolfinger, R. D. (1996). SAS System for
Mixed Models. Gary, NC: SAS Institute Inc.
Langford, I. H., Day, R. J. (2001). Poisson Regression. In: A. H. Leyland, H. Goldstein (Eds.), Multilevel Modelling of Health Statistics. Chichester: John Wiley & Sons LTD: 45-57.
Lochner, K. A., Kawachi, I., Brennan, R. T., Buka, S. L. (2003). “Social capital and neighborhood mortality rates in Chicago.” Social Science & Medicine, 56, 8: 1797-1805.
Martikainen, P., Valkonen, T. (1996). “Excess mortality of unemployed men and women during a period of rapidly increasing unemployment.” The Lancet, 348, 9032: 909-912.
Martikainen, P., Mäki, N., Blomgren, J. (2004). “The Effects of Area and Individual Social Characteristics on Suicide Risk: A Multilevel Study of Relative Contribution and Effect Modification.” European Journal of Population, 20, 4: 323-350.
Pickett, K.E., Pearl, M. (2001). “Multilevel analyses of neighbourhood socioeconomic context and health outcomes: a critical review.” Journal of Epidemiology and Community Health, 55, 11: 111-122.
Platt, S., Kreitman, N. (1985). “Parasuicide and Unemployment among Men in Edinburgh 1968-1982.” Psychological Medicine, 15: 113-123.
Putnam, R. D. (1993). Making Democracy Work: Civic Traditions in Modern Italy. Princeton, NJ: Princeton University Press.
Riihinen, O. (1965): Teollistuvan yhteiskunnan alueellinen erilaistuneisuus. [Regional differentiation of an industrializing society.] Kuopio: WSOY.
Robert, S. A. (1999). “Socioeconomic Position and Health: The Independent Contribution of Community Socioeconomic Context.” Annual Review of Sociology, 25: 489-516.
Sloggett, A., Joshi, H. (1998). “Deprivation indicators as predictors of life events 1981-1992 based on the UK ONS longitudinal study.” Journal of Epidemiology and Community Health, 52, 4: 228-233.
Snijders, T., Bosker, R. (1999). Multilevel Analysis. An Introduction to Basic and Advanced Multilevel Modelling. London: SAGE Publications.
Stafford, M., Marmot, M. (2003). “Neighbourhood deprivation and health: does it affect us all equally?” International Journal of Epidemiology, 32, 3: 357-366.
Turner, J. B. (1995). “Economic Context and the Health Effects of Unemployment.” Journal of Health and Social Behavior, 36, 3: 213-229.
Valkonen, T. (2001). Trends in differential mortality in European countries. In: J. Vallin, F. Meslé, T. Valkonen, Trends in mortality and differential mortality. Population studies no. 36. Strasbourg: Council of Europe Publishing: 185-321. Valkonen, T., Martikainen, P. (1995): The Association between Unemployment and
Mortality: Causation or Selection? In: A. D. Lopez, G. Caselli, T. Valkonen (Eds.), Adult Mortality in Developed Countries: From Description to Explanation. Oxford: Clarendon Press: 201-222.