0 INTRODUCTION
Sheet metal forming processes like draw bending or deep drawing lead to a large plastic deformation of the material. During stamping process of drawpieces the material is drawn over a radius experiencing bending and back bending. This results in large plastic strains that lead to flow anisotropy. The induced anisotropic behavior manifests itself in the case of a strain change by different stress-strain responses depending on the type of the strain path change. While many metals exhibit a drop of the yield stress after a load reversal, some metals show an increase of the yield stress after orthogonal strain path change. The reason for this induced flow anisotropy is the development of persistent dislocation structures during large deformations.
Friction behavior in sheet metal forming process depends on several parameters such as contact pressure, sliding velocity, sheet metal surface roughness, tool surface roughness, tool material and lubricant conditions [1] and [2]. Moreover, frictional resistance depends on physical and chemical factors acting on the contact surface, dynamics of the loads and temperature [1]. Studies also show that friction and material characteristics have a direct influence on the process and are sensitive to each other [3]. Furthermore, recent studies such as [4] and [5] show that the topography of a surface influences the frictional behavior of a contact surface and hence its wear. Hence, there is a need to better understand the role of friction and to find reliable methods to quantitatively determine the friction coefficient values in metal forming. In parallel, there is a growing trend to use computer simulation based research tools [6]
and other advanced modeling techniques [7] of sheet metal forming operations.
Furthermore, understanding the precise coefficient of friction and the surface qualities requires sufficient knowledge of the tribological behavior at the interface between tool and workpiece. Two contact conditions are observed at this interface: (1) the sliding condition under compression and (2) the sliding condition under tension bending. To describe the friction in sheet metal forming by simulations, a model that quantifies friction coefficients is needed. This is complicated by the fact that any of a variety of lubrications regimes may co-exist in the sheet-tooling interface. The realistic friction models must also treat the influence of roughness and surface topography on the lubricant flow and on the asperity contact [8].
Friction coefficient is normally obtained by experiment under certain assumptions and must be obtained in a single experiment. Nowadays, there are many kinds of friction tests that are modified and developed by several researchers. The tensile strip test developed by Duncan et al. [9] is widely used. In this test a strip specimen of sheet metal was pulled over the cylindrical surfaces of pins to simulate stretching and drawing processes. The pulling force on one side of the pin was measured along with the strain in a section of the test specimen on the other side. The strip force on the second side of the pin was calculated from the measured strain using the stress–strain characteristics of the test material.
In subsequent studies, Wang et al. [10] showed that the coefficient of friction increased with strip sliding distance and that increasing the pin radius resulted in a small increase in measured coefficient of friction. Weinmann et al. [11] measured the coefficient of friction in the sliding condition under
Numerical and Experimental Study of Frictional Behavior
in Bending Under Tension Test
Lemu, H.G. – Trzepieciński, T.
Hirpa G. Lemu1,* – Tomasz Trzepieciński2
1 University of Stavanger, Department of Mechanical and Structural Engineering and Materials Technology, Norway 2 Rzeszow University of Technology, Department of Materials Forming and Processing, Poland
This paper presents the results of frictional resistance research for three different types of sheet metals, namely from steel, brass and aluminum alloy. The research on friction behavior of these alloys was carried out by using bending under tension test. The influence of the amount of plastic deformation on friction coefficient value was investigated in dry and lubrication conditions. The material data of the sheet metals were determined from the tensile tests. Numerical simulations using the finite element method in MSC.Marc 2007r1 computer program are conducted by taking into account the strain hardening phenomenon of the sheet metals. The results show that there are minor differences between the experimental and numerical results. These may be due to the simplification where isotropic material properties are assumed and influences of structural defects are not accounted for in the numerical model.
tension bending developed by Littlowod and Wallace [12]. To account for severe deformation conditions, the researchers [11] suggested use of friction factor to describe tool–work friction. In the expression for the friction factor in terms of measured strain, the pin radius appears explicitly and experimental results show that friction factor decreases with increasing the pin radius. This work did not account for plastic deformation of specimen.
He et al. [13] developed a new bending under tension (BUT) test, but this method only focused on the state of friction in the sheet steel bend-forming process. Many BUT tests have contributed to the knowledge about sheet forming tribology [14] to [20]. The traditional way of performing these BUT tests is by differential measurements carrying out two tests after each other, one by drawing over a fixed circular cylindrical tool-pin, the other over a freely rotating pin, implying that no sliding takes place. The difference in front tension measured in two tests gives an estimate of the friction. A drawback of this method is stochastic variations, which may cause large scatter, and the fact that steady-state conditions must be present when measuring. Weinmann and Kernovsky’s [21] design allows accurate measurement of both front tension and back tension, though this still does not allow direct measurement due to the contributions from bending and unbending friction. The above review of recent literature clearly shows that there is little information available on the friction and lubrication of the drawing process of sheet metals, thus further research is important and necessary. The objective of the research reported in this article is to make a comparative study of the friction behavior in sheet metal forming of steel, brass and aluminum alloys using both experimental and numerical approaches.
1 MATERIALS AND EQUIPMENT
The introduced bending under tension test allows determining frictional resistances on the punch edge in
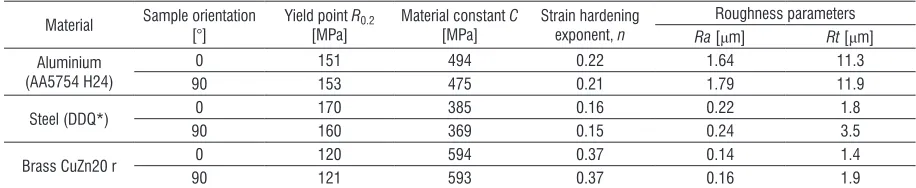
real stamping process. The tests were conducted using a modified measurement system specially designed for previous friction research [22]. The selected steel, brass and aluminum sheet metal in different temper states were tested. Tensile test was carried out in a universal testing machine to determine mechanical parameters of the samples including hardening properties (Table 1). The extensive specimens were cut under angle of 0 and 90º with respect to the rolling direction of the sheet metal. The thickness of the aluminum sheet is 0.8 mm while that of brass and steel is 1 mm. Surface roughness was measured using Taylor Hobson Subtronic 3+ instrument and the arithmetic average (Ra) of filtered roughness along both the rolling (Ra0) and transverse directions (Ra90) were registered.
2 EXPERIMENTAL PROCEDURES
The schematic view of the test device is shown in Fig 1. A test strip was held at one end in a grip supported by a load cell. The specimen (No. 3 in the Fig 1) is wrapped around a cylindrical fixed roll with diameter of 20 mm and loaded in a tensile testing machine ensuring contact over an angle of approximately 90°. The application of fixed pin allows setting up the rolls in four positions to utilize full circumference of the roll. The test was carried out using four rolls made of X165CrV12 tool steel with different average surface roughness qualities Ra = 2.5, 1.25, 0.63 and 0.32 µm measured parallel with the roll axis. The average roughness parameter Ra was selected in this research because it is widely known and universally used, though recent research [5] claims that Ra parameter lacks information on the wavelength and is not sensitive to small changes in profile compared with, for example, the root mean square deviation parameter (Rq).
The tensile forces F1 and F2 were measured simultaneously during the test. A major advantage of this test apparatus is that strain does not have to
Table 1. Selected mechanical properties and roughness parameters of tested sheet metals
Material Sample orientation [°] Yield point R0.2
[MPa] Material constant C [MPa] Strain hardening exponent, n
Roughness parameters Ra [μm] Rt [μm] Aluminium
(AA5754 H24)
0 151 494 0.22 1.64 11.3
90 153 475 0.21 1.79 11.9
Steel (DDQ*) 0 170 385 0.16 0.22 1.8
90 160 369 0.15 0.24 3.5
Brass CuZn20 r 0 120 594 0.37 0.14 1.4
90 121 593 0.37 0.16 1.9
be measured to determine coefficient of friction. For some tests the effect of strain on coefficient of friction may be of interest. In other cases the use of an extensometer may not be reasonable or warranted. It is expected in most cases that the uniform deformation region is of interest only when measurement of specimen elongation is needed to calculate specimen strain away from the grip and pin regions. Constant stretching speed, i.e. the speed of the test machine head, is equal to 0.3 mm/s.
While executing the BUT test, strain was measured and strain rate was calculated for the section of the test strip between the machine head and pin assuming that strain was uniform over this length of test material. With increasing upper grip displacement increases the sample deformation until fracture. Specimens were carefully prepared to assure constant width of 10 mm. To realize dry conditions both rolls and sheet specimens were degreased using acetone, and for lubricant conditions conventional machine oil was used. The friction coefficient value determined is averaged for the whole contact area.
The BUT test allows determining the friction coefficient and also its changes during stretching process of the sample. These changes may be related with changes of surface topography and strain hardening phenomenon of the sample material.
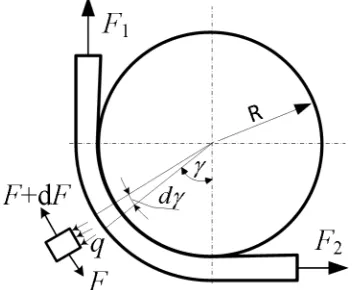
The occurrence of frictional resistance between the sheet metal and roll causes that F1 > F2. The deformation of the strip in the zone where the force F1 acts is not only due to the condition of sliding distance of the sheet metal around the pin, but also corresponds to limit deformation of the sheet metal [23]. Assuming that there is a constant friction coefficient µ in the contact region and the wrap angle γ (Fig. 2) is constant during the test according to the equilibrium of all forces acting on an elemental cut of the strip dγ, it can be shown that:
F q wRd+ µ γ−(F dF+ )=0, (1)
qwRdγ −Fsindγ −(F dF+ )sindγ = ,
2 2 0 (2)
where q is unit normal contact pressure and w is the width of the strip.
For a very small dγ one can assume that sin dγ dγ
2 ≈ 2 and dF << F. Thus, combining Eq. (1)
and Eq. (2) gives:
µ γd dF F
= . (3)
Fig. 1. Schematic view of testing device; 1 – machine base, 2 – device frame, 3 – specimen, 4 and 5 – tension members, 6 –
working roll, 7 - fixing pin, 8 and 9 – extensometer
Fig. 2. Forces acting on an elemental cut of the strip
Integrating Eq. (3) and taking into account
γ π= 2 the coefficient of friction is determined to be:
µ π
=
2 1
2 ln F .
F (4)
The average contact stress, the unit contact pressure q in this case, is determined from the following equation:
q F F wR
= 1+ 2
2 . (5)
acts is an important parameter because it not only determines the amount of sliding of the sheet over the pins but it also represents the deformation limit of a specimen.
3 NUMERICAL MODELLING
The simulation of the BUT test was conducted using MSC.Marc + MENTAT 2007r1 program. Both dry friction and oil lubrication were considered in the numerical simulation of friction test for sheet metal made of aluminum AA5754 H24. The roll was modeled as perfectly rigid and suitable boundary conditions that allow measuring the tensile forces were applied to both ends of the sample. The geometric model of the blank consists of 5472 isoparametric brick elements that are recommended by the program [25] to analyze contact conditions. The assumed strain formulation was applied to improve the bending characteristics of the elements. This can substantially improve the accuracy of the solution though the computational costs of assembling the stiffness matrix increase. An elasto-plastic material model approach was implemented. The plastic behavior of the metal was described by the von Mises yield criterion with isotropic work hardening. To describe contact conditions the Coulomb friction law was assumed as in Eq. (6):
f f v
RVCNST T
t = n r
µ π
2arctan , (6)
where ft is tangential (friction) force, µ friction
coefficient, fn normal force, ||νr|| relative sliding
velocity, RVCNST value of the relative velocity below which sticking occurs and T tangential vector in the direction of the relative velocity.
The value of RVCNST determines how closely the mathematical friction model represents the step function given as:
ft =µf sign vn
( )
r . (7)A very large value of RVCNST results in a reduced value of the effective friction. On the other hand, a very small value may result in poor convergence of contact algorithm. It is thus recommended that the value be 1 to 10% of a typical relative sliding velocity.
The value of friction coefficient changes in accordance with the displacement of the upper grip of tensile machine. Simulations of friction tests were performed for roll with surface roughness value of Ra = 0.32 µm. Knowledge of the grip velocity allows
finding dependence of changes of friction coefficient versus time (t) in dry friction µd(t) and oil lubrication
µo(t) given by:
for t≤0 69. :µd
( )
t =0 042. ln( )
t +0 005. ,for t t
t t t t
d
>
( )
=− ⋅ − + ⋅ − − ⋅ − + +
0 69
3 1012 4 4 109 3 2 106 2 0 0001 0 132
.
. .
:µ
,,
for t≤2 07. :µo
( )
t =0 031. ln( )
t −0 011. ,for t>2 07. :µo
( )
t = ⋅2 10−7 2t −0 0001 0 129. t+ . .To model the process of sample rupture the Cockroft-Latham damage criterion that was implemented into MSC.Marc [25] was used. In agreement with this criterion the moment of the fracture depends on energy accumulated by tensile stress only. The Cockroft-Latham indicator, Eq. (8), is a postprocessing value to indicate a possible damage area.
σ
σmax ε ,
∫
dt C≥ (8)where σ is the effective von Mises stress, σmaxis the
maximum principal stress, ε is the effective plastic
strain rate and C is material constant threshold for damage.
The critical value C has been defined as a workpiece material constant that does not depend on the working operation. The critical value is evaluated by a tensile test. If the critical value of the indicator was reached elements were deleted by the algorithm implemented in MSC.Marc.
4 RESULTS AND DISCUSSIONS
4.1 Influence of Surface Roughness of Rolls
contact area becomes also less than nominal area and depends on, for instance, roughness parameters of the sheet metal and the tools, inclination to strain hardening of roughness picks and the geometry of contact surface. This makes it difficult to generalize and interpret the obtained results of friction coefficient variation. Results from other researches [26] indicate that aluminum sheet metal made of AA1100 H14 with high tendency to seizing reveals a reduction of frictional resistance with the sheet metal deformation, while AA3104 sheet metal with low tendency to seizing shows increasing friction coefficient value under the influence of deformation. The reduction of friction with the strain in contact is apparently due to a decrease in contact area associated with roughening of the strip by plastic deformation. The results also indicate that theoretical predictions of the variation of the real area of contact with strain show excellent agreement with experiments using model asperities in rolling.
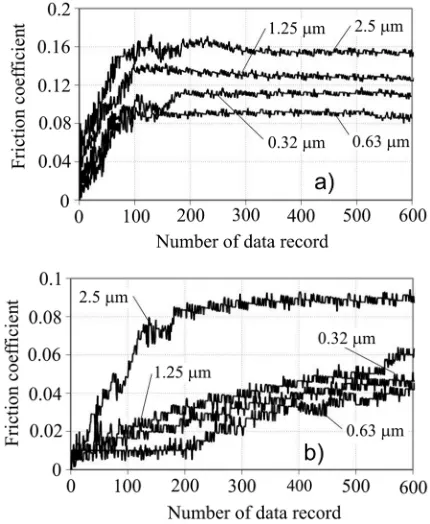
Fig. 3. Variation of friction coefficient of AA5754 H24 aluminum sheet as a function of roll surface roughness for; a) dry friction,
and b) lubricated conditions
As the plot in Fig. 3a shows the result from roll with surface roughness value (Ra) of 0.32 µm, after some initial instability, is almost constant. For the rolls with surface roughness value of 0.63 and 1.25 µm in both friction conditions (Figs. 3a and b), the change of
friction coefficient is stable during the friction test, i.e. it indicates a somewhat similar variation pattern. The lowest values of the friction coefficient of aluminum (Fig. 3) and brass (Fig. 4) sheet metal for roll characterized by surface roughness of 0.63 µm may be explained by surface topography. This is because sheet metals with high surface roughness create large amounts of oil pockets at mixed lubrication condition.
The mixed lubrication regime is the intermediate zone between the boundary lubrication regime and the elasto-hydrodynamic lubrication regime, where the applied load is partly carried by the interacting asperities and the remaining part by the fluid film. In these conditions the suitable lubricant viscosity plays a key role [27]. Accordingly, the surface roughness of rolls applied in oil lubrication regime reduces the value of friction coefficient approximately by 25 to 40%.
Fig. 4. Variation of friction coefficient of CuZn20r brass sheet as a function of roll surface roughness for; a) dray friction, and
b) lubricated conditions
character of frictional resistance variation during the test. Even identical influence of surface roughness of the rolls on the friction coefficient value is observed.
The lowest value of friction coefficient is observed for roll with surface roughness value (Ra) of 0.63 and the friction coefficient value increases for rolls with roughness value 0.32, 0.63 and 1.25 µm in sequence. This phenomenon is observed in both friction conditions – dry and lubricated. The degree of reduction measured at the necking stage varies from 40% for rolls with roughness value of 2.5 µm to above 50% for rolls with roughness value of 0.32 µm.
The variation trend of the test results for steel DDQ sheet metal is similar to those received for the above discussed materials. The values of the friction coefficient increased in sequence for rolls Ra = 0.63, 0.32, 1.25 and 2.5 µm.
4.2 Contact Pressure at Necking
The level of the average contact pressure at necking has been studied for both dry and lubricated contact (Fig. 5). The plots do not show a typical trend or variation as a function of surface quality and friction condition. A general observation is, however, that the contact pressure tends to drop with increasing roughness value.
Furthermore, using oil lubrication tends to raise the contact pressure for steel sheet at roughness value of Ra = 0.32 µm and 0.63 µm. This does not have to mean a proportional increase of frictional resistances because in the lubrication regime there occurs a higher sample elongation in F1 force acting zone and the width of contact area of roll and the sheet metal is reduced. Among the tested materials, the lowest contact pressure is registered for AA5754 H24 sheet metal and the DDQ (Deep Drawing Quality) steel sheet has the strongest hardening capacity.
As depicted in Fig. 6, the value of the tensile forces in dry friction increases after sample yielding and then remains at a stable level. Furthermore, the relation between forces and the friction condition does not change. For materials with little hardening capacity follow fast increase of friction coefficient at relatively small pressure [1]. No significant increase in real contact area occurs with increasing normal contact pressure. In addition, the shear stress on contact surface does not increase and thus friction force remains constant. The application of a lubricant makes material flow easy from the bottom of the drawpiece to the wall. This leads to the fact that the forces increase uniformly during the whole friction contact process until the sample fractures.
Fig. 5. Maximum contact pressure as necking occurs recorded for rolls with different roughness
Fig. 6. Values of forces during friction tests of AA5754 H24 sheet metal determined experimentally (heavy lines) and numerically
(fine lines) in dry and lubricated friction conditions
4.3 Equivalent Total Plastic Strain
Figs. 7 and 8 depict distribution of equivalent total plastic strain on samples of the same material for lubricated and dry friction conditions respectively. The equivalent strains are plotted as a function of different values of a total length strain (ε1) of the samples calculated for a 10 mm wide sample using Eq. (9).
εl l
l dl
l
=
∫
0
, (9)
where l0 = length of sample before deformation, and
l = length of sample after deformation.
From a technological point of view this phenomenon is advantageous because it increases the drawpiece ripping force. Comparing the lubricated and dry friction condition in Figs. 7a and 8a, there essentially exist differences in distribution of strains but very low. The small differences in equivalent plastic strain distribution result from small differences between the values of friction coefficients in dry and lubrication conditions.
Lubricated surface contact results in more uniform strain distribution on the contact surface, but only in the range of small total strains. In case of large contact pressure, for instance, as in the case of Figs. 7c and 8c, the influence of strain distribution in contact zone is mainly dominated by geometry, and minor influence of lubrication conditions is observed. The most loaded section is the place where strip loaded by the F1 force leaves contact with the roll. Total strain of the simulated sample at the instant when fracture takes place is about 8% less than the value determined by experiment.
Fig. 7. Equivalent plastic strain distribution in lubrication conditions and under total length strain of; a) εl = 0.024,
b) εl = 0.048, c) εl = 0.072 and d) after fracture
Fig. 8. Equivalent plastic strain distribution in dry friction conditions and under total length strain equals;
a) εl = 0.024, b) εl = 0.048 and c) εl = 0.072
This difference is visible as decreasing simulated forces (Fig. 8) that produced strain localization leads to fracture of the sheet metal. The difference between experimental and numerical results may be due to the simplification as a result of the assumption that the material has isotropic mechanical properties.
Moreover, in the numerical models, parameters result from real polycrystal structure, for instance impurity and structure defects could not directly be taken into account.
4.4 Distribution of Contact Friction and Effective Strain
As depicted in Fig. 9, the distribution of contact friction stress on the sheet-roll contact surface is not uniform along the contact surface.
Fig. 9. Distribution of contact friction stress for different total length strain of the samples for; a) dry contact and, b) lubricated
contact condition
strains of sample equal to 0.044 and 0.066. This may be explained by different material flow characteristic at higher total strains of the sample.
Analogous to the distribution of contact friction stress in the middle part of the sample section, the distribution of effective strain is not uniform along the contact surface. The highest gradient of effective strains exists near the entrance and exit of sheet from sheet-roll contact (Fig. 10). For the same value of total strain of the sample, increasing friction coefficient value causes the effective strain of the sample to increase. Furthermore, the existence of friction on one side of the sheet in BUT test causes local flexure of the sheet. The higher value of friction coefficient in case of dry friction conditions corresponds to an increase of flexure in the sample (Fig. 10b). This flexure influences the characteristic of the contact along the sheet-roll contact surface and is visible as a local decrease of contact normal stress before reaching the maximum value.
Fig. 10. Distribution of effective strain for sample total length strain equal to 0.066 for; a) lubrication and, b) dry friction
conditions
5 CONCLUSIONS
A study of friction behavior of sheet metal forming in bending under tension test is presented in this paper. The study focused on the influence of lubrication condition and the variations of friction behavior with surface roughness. It has been observed that the application of lubricant during tests of all of the sheet metal samples causes reduction of friction coefficient value. Furthermore, the results of this study indicate that lubricated contact condition reduces the friction
coefficient value to higher degree for higher roughness values.
Use of tools with low surface roughness value to reduce the frictional resistance is unfounded because the increased real contact area increases the interatomic interaction of surfaces. This phenomenon increases frictional resistance. The characteristics of the changes depend on friction conditions, i.e., dry friction and lubricated. Application of the finite element method in this research allows a simulation of the material flow of the sheet metal by taking the complex friction phenomenon into account. It further allows a better understanding of the contact conditions that occur at the punch radii of sheet metal stamping processes. Moreover, on the basis of numerical results we can forecast the value and distribution of local deformations in real sheet metal forming operations. The results will assist future research into developing friction tests and the possibility of determining the friction coefficient values.
6 ACKNOWLEDGEMENT
This research was realized with financial support provided by Island, Liechtenstein and Norway and was co-financed by European Economic Area and Norwegian Financial Mechanism under the Scholarship and Training Fund. The authors would like to appreciate this financial support.
7 REFERENCES
[1] Gierzyńska, M. (1983). Friction and lubrication in
plastic forming of metalsi. WNT, Warszawa. (in Polish) [2] Matuszak, A. (2000). Factors influencing friction
in steel sheet forming. Journal of Material Process Technology, vol. 106, p. 250-253, DOI:10.1016/S0924-0136(00)00625-7.
[3] Volk, M., Nardin, B., Dolšak, B. (2011). Application of numerical simulations in deep-drawing process and holding system with segments’ inserts. Strojniški vestnik - Journal of Mechanical Engineering, vol. 57, no. 9, p. 697-703, DOI:10.5545/sv-jme.2010.258.
[4] Sedlaček, M., Vilhena, L.M.S, Vižintin, J. (2011).
Surface topography modeling for reduced friction. Strojniški vestnik - Journal of Mechanical Engineering, vol. 57, no. 9, p. 674-680, DOI:10.5545/sv-jme.2010.140.
[5] Sedlaček, M., Podgornik, B., Vižintin, J. (2009).
Influence of surface preparation on roughness parameters, friction and wear. Wear, vol. 266, p. 482-487, DOI:10.1016/j.wear.2008.04.017.
vestnik - Journal of Mechanical Engineering, vol. 58, no. 2, p. 73-80, DOI:10.5545/sv-jme.2011.194.
[7] Hol, J., Cid Alfaro, M.V., de Rooij, M.B., Meinders,
T. (2011). Advanced friction modeling for sheet metal forming. Wear, vol. 286-287, p. 66-78, DOI:10.1016/j. wear.2011.04.004.
[8] Zdravecka, E., Suchanek, J., Lubiščak, J. Greškovič,
F., Spišak, E. (2002). Examination of surface characteristics in tribological system by AFM. Tribologia, vol. 33, p. 1713-1722.
[9] Duncan, J.L., Shabel, B.S., Filho, J.G. (1978). A tensile
strip test for evaluating friction in sheet metal forming. SAE Technical Paper, no. 780391, doi: 10.4271/ 780391.
[10] Wang, X.J., Duncan, J.L., Devenpeck, M.L. (1983).
Punch friction tests for sheet metal forming. Journal of Applied Metalworking, vol. 3, p. 3-11, DOI:10.1007/ BF02833871.
[11] Weinmann, K.J., Bhonsle, S.R., Gersten-berger, J.
(1990). On the determination of the coefficient of friction and the friction factor by the strip–tension friction test. CIRP Annals, vol. 30, p. 263-266, DOI:10.1016/S0007-8506(07)61049-X.
[12] Littlewood, M., Wallace, J.F. (1964). The effect of
surface finish and lubrication on the friction variation involved in the sheet-metal-forming process. Sheet Metal Industries, vol. 41, p. 925-930.
[13] He, D.N., Yin, X.F. Tao, H.Z. (2000). Research on evaluation method of friction and lubrication in deep drawing, Acta Metallurgica Sinica, vol. 13, p. 439-445. [14] Wihlborg, A, Gunnarsson, L. (2000). A frictional study
of uncoated EBT steel sheets in a bending under tension friction test. Wear, vol. 237, p. 129-136, DOI:10.1016/ S0043-1648(99)00319-1.
[15] Alinger, M.J., Van Tyne, C.J. (2001). Evolution of
the tribological characteristics of several forming die materials. Journal Material Processing Technology, vol. 111, p. 20-24, DOI:10.1016/S0924-0136(01)00512-X. [16] Kim, H.Y., Hwang, B.C., Bae, W.B. (2002). An
experimental study on forming characteristics of pre-coated sheet metals. Journal Material Processing Technology, vol. 120, p. 290-295, DOI:10.1016/S0924-0136(01)01088-3.
[17] Garza, L.G., Van Tyne, C.J. (2007). Friction and
formability of galvannealed interstitial free sheet steel.
Journal Material Processing Technology, vol. 187-188, p. 164-168, DOI:10.1016/j.jmatprotec.2006.11.062. [18] Moona, Y.H., Kima, D.W., Van Tyneb, C.J. (2008).
Analytical model for prediction of sidewall curl during stretch-bend sheet metal forming. International Journal of Mechanical Sciences, vol. 50, p. 666-675, DOI:10.1016/j.ijmecsci.2008.01.003.
[19] Hilditch, T.B., Matlock, D.K., Levy, B.S., Siekirk, J.F.
(2005). Experimental evaluation of curl and tensile properties of advanced high strength sheet steels. SAE Transactions, Journal Materials and. Manufacturing, vol. 5, p. 457-466.
[20] Hilditch, T.B., Speer, J.G., Matlock, D.K. (2007).
Influence of low-strain deformation characteristics of high strength sheet steel on curl and springback in bend-under-tension tests. Journal Material Processing Technology, vol. 182, p. 84-94, DOI:10.1016/j. jmatprotec.2006.06.020.
[21] Weinmann, K.J, Kernovsky, S.K. (1996). Friction
studies in sheet metal forming based on a unique die shoulder force transducer for sheet metal forming research. CIRP Annals, vol. 15, p. 269-272, DOI:10.1016/S0007-8506(07)63061-3.
[22] Stachowicz, F., Trzepieciński, T. (2004). ANN
application for determination of frictional characteristics of brass sheet metal. Journal of Artificial Intelligence, vol. 1, p. 81-90.
[23] Lovell, M.R., Deng, Z. (2002). Characterization of interfacial friction in coated sheet steels: influence of stamping process parameters and wear mechanisms. Tribology International, vol. 35, p. 85-95, DOI:10.1016/ S0301-679X(01)00097-4.
[24] Han, S.S. (1997). The influence of tool geometry and friction behavior in sheet metal forming. Journal Material Processing Technology, vol. 63, p. 129-133, DOI:10.1016/S0924-0136(96)02612-X.
[25] MSC.Marc Volume B: Element Library, MSC.Software Corporation 2007.
[26] Saha, P.K., Wilson, W.R.D. (1994). Influence of plastic strain on friction in sheet metal forming. Wear, vol. 172, p. 167-173, DOI:10.1016/0043-1648(94)90284-4. [27] Lowell, M.R., Khonsari, M.M., Marangoni R.D.