224
ISSN: 2250 – 2688CODEN: CRPSBZ (USA)
Received: 06/04/2018 Revised: 21/04/2018 Accepted: 24/04/2018 Published: 08/07/2018
Prashant B Patil, Vivekanand K Chatap, Mahesh P More and Zamir G Khan
Department of Pharmacy, H. R. Patel Institute of Pharmaceutical Education & Research, Shirpur, Dist: Dhule (MS) 425 405 India
Correspondence Zamir G Khan
Department of Pharmaceutical Chemistry, H. R. Patel Institute of Pharmaceutical Education & Research, Shirpur, Dist: Dhule (MS) 425 405 India
Email: [email protected]
DOI: 10.24092/CRPS.2018.080201
Website: www.crpsonline.com
Quick Response Code:
Prospective Process Validation Study of Glibenclamide 2.5 mg
Tablets
Prashant B Patil, Vivekanand K Chatap, Mahesh P More and Zamir G
Khan
ABSTRACT
The present study provides a high degree of assurance that a specific process for manufacturing of Glibenclamide Tablets will consistently produce a product meeting its predetermined quality attributes and specifications. It mainly comprises the stages to be followed to evaluate and qualify the acceptability of manufacturing process of Glibenclamide 2.5 mg tablets. The process is limited to the three batches manufactured of specific batch size with specified equipments and control parameters for tablets. It involves All parameters related to the each step were evaluated by respective standard test involved in the manufacturing. Sampling, testing plan and acceptance criteria for each step were monitored. The analytical results of all stages were found to be within the acceptable limit. Other tests related to compression such as hardness, thickness, disintegration and dissolution for all three batches were found within the acceptable limit.
Key words: Glibenclamide, Blend Uniformity, Assay of Glibenclamide, Process validation of
Glibenclamide, Glibenclamide tablets.
1. INTRODUCTION
Validation is defined as process of founding through a documented database programme, which provides a high degree of assurance that a specific process will constantly produce, a product meeting its pre-determined specifications and critical quality attributes. The word validation simply means, ‘assessment of validity’ or ‘action of proving effectiveness’ a validated manufacturing process is one, which has been proved to do what it purports to or is represented to do. Validation essentially contains process qualification (the qualification of materials, equipment, system, buildings and personnel i.e. Design Qualification, Installation Qualification, Operation Qualification, Performance Qualification).
Process Validation is defined as the collection and evolution of data from the process design stage throughout production, which establishes scientific evidence that a process is capable of consistently delivering quality products. It assures Quality, Safety, and efficacy. (According to 2011 United State of Food and Drug Administration (USFDA) guideline). The process validation is the analysis of data collected throughout the design and manufacturing of a product in order to endorse that the process gives consistent production of products with given standard. The main aim of process validation of Glibenclamide is to ensure various inputs lead to consistent and great quality productions and it continuing process that must be regularly improved as manufacturing feedback is gathered. Glibenclamide, also known as glyburide, is an anti-diabetic drug in the class of medications known as sulfonylurea and thoroughly related with sulfonamide antibiotics.
225
Glibenclamide is a sulfonylurea derivative and is recommended for the treatment of type II diabetes mellitus. In its oral administration, Glibenclamide go through the hepatic first pass effect; such that only 45% of the drug is absorbed and considering its short half-life, the persistent has to take the drug in several divided doses to maintain the desired therapeutic effect. Gastrointestinal adverse effects of Glibenclamide have been reported for the drug, which decreases the patients’ compliance. The Glibenclamide fall in class II of the biopharmaceutical classification system, which means the drug is poorly water soluble and soluble in ethanol (5 mg/mL), Dimethyl sulfoxide - DMSO (25 mg/mL), chloroform (1:36), methanol (1:250), while showing a good permeability in the gastrointestinal mucosa1-8.1.1 Stages of Process Validation
- Process Design Stage
- Process Qualification Stage
- Continued Process Verification Stage
1.2 Process Validation should be considered in following
situation
- When implementing new processes for manufacturing
- When new equipment’s installed in manufacturing plant
- Process and equipment which are having altered suit
changing the priority
- Processes were ended product test is poor
2. MATERIALS AND METHODS
Prospective process validation was performed on the three batches of Glibenclamide 2.5 mg Tablets. The three consecutive batches were labeled as (Batch X, Batch Y, and Batch Z) 3-9.
List of Equipment and Stages indicate list of equipment’s
which are used in manufacturing process of glibenclamide 2.5 mg tablets and give the involvement of equipment in which manufacturing stage with their make which are mentioned in table 1.
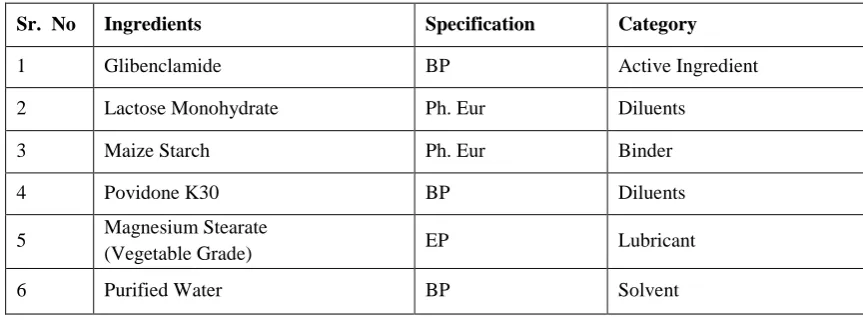
Details of Input Material indicates material or ingredients which are used in the manufacturing of glibenclamide 2.5 mg tablets with their category which shows in table 2.
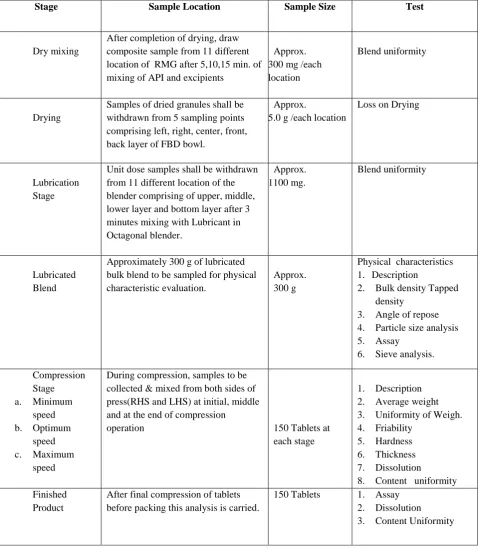
Sampling and Testing Plan indicates the planning for sampling and testing with their manufacturing stage, procedure, quantity to be sampled and acceptance criteria for sampling for the manufacturing of glibenclamide 2.5 mg tablets which describe in table 3.
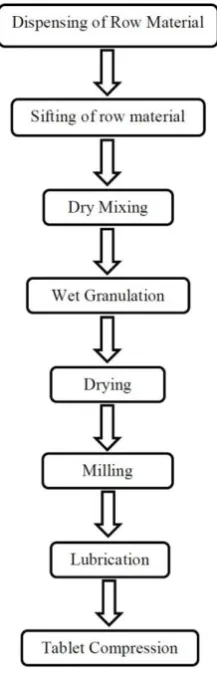
Manufacturing Process flow chart indicates the
manufacturing stages of manufacturing process of glibenclamide 2.5 mg tablets depicted in Figure 1.
3. RESULT AND DISCUSSION
This results and discussion is limited to evaluation of three consecutive batches of glibenclamide 2.5 mg tablets for prospective process validation. Three manufacturing batches are validated in prospective process validation the batches are labeled as Batch X, Batch Yand BatchZ at blend stage, compression stage and packing stage.
Product Details
Product Name: Glibenclamide Tablets 2.5 mg
Label Claim: Each tablet contains Glibenclamide BP 2.5 mg.
3.1 Dry Mixing
Dry mixing was carried out in Rapid Mixer Granulator for 10 minutes and samples were collected from eleven different six locations for Blend Uniformity. The blend uniformity test was performed and acceptance criteria for it is individual values should be between 90.0 % to 110.0 % of the labeled amount of Glibenclamide with RSD not more than 5 % the results are described in table 4.
% RSD of Glibenclamide Tablets for all three validation batches were within found within the specification. Based on % RSD data of Glibenclamide Tablets for three validation batches, it was evident that the dry mixing throughout the sampling locations and all results are found within acceptable limit.
3.2 Drying Analysis
The drying analysis carried for the % LOD of dried granules of Glibenclamide analysis. The samples were collected from the fluidized bed dryer bowl from top, middle bottom side the results are shown in table 5.
% loss of drying of dried granules of Glibenclamide was within the range 7.30 to 7.89 w/w at 120 0C for 20 minutes respectively for all three validation batches, which were within the acceptable limit.
3.3 Analytical Data for Lubricated Blend
226
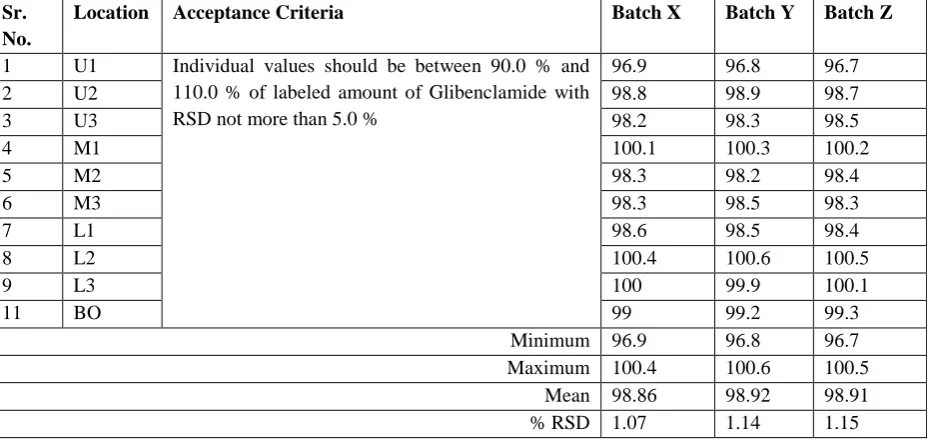
% RSD of Glibenclamide for all three validation batches were within the range 1.07 to 1.15, which were found within the acceptance criteria. % RSD of Glibenclamide for all three validation batches, it was evident that there was no segregation occurs in the blender and mixing is homogeneous throughout the sampling locations.3.4 Analysis of Lubricated Blend
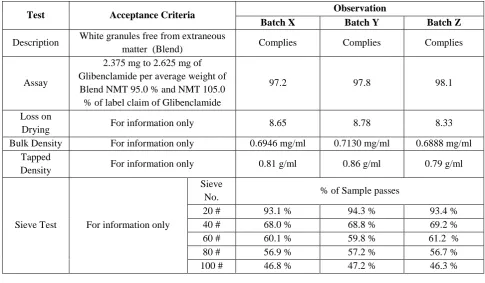
Lubricated blend analysis is done by description of blend, assay, loss on drying, bulk density, tapped density and sieve test parameters their results are described in table 7.
Description, Assay, loss on drying, bulked density, tapped density sieve test of lubricated blend of Glibenclamide for three validation batches was within the acceptable specification and criteria.
3.5 Physical Characteristics of Lubricated Blend
Physical characteristics of lubricated blend were done by description of lubricated blend, bulk density, tapped density, loss on drying, angle of repose and particle size distribution parameters and their results are shown in table 8.
The physical parameter of lubricated blend such as description, bulk density, tapped density, loss on drying and particle size distribution for three validation batches were satisfactory and found consistent within acceptable limit. No significant observation related to the flow of the blend was observed throughout the compression activity.
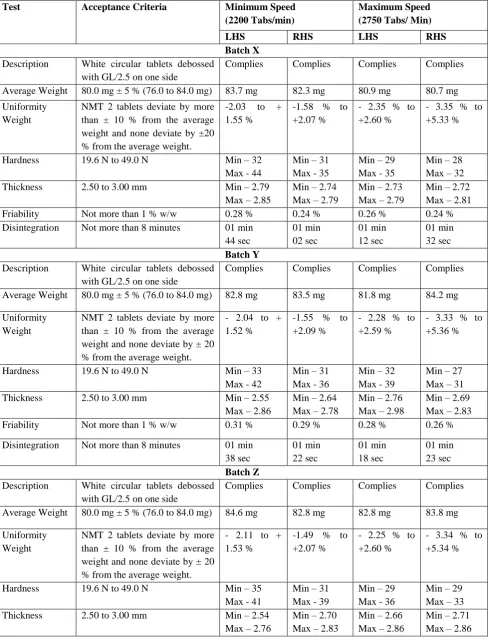
3.6 Compression stage physical parameters
During compression, samples from compression machine at minimum speed and maximum speed were collected of three consecutive batches for performing physical parameters. The physical parameters checks as description, average weight,
uniformity of weights, thickness, hardness, friability,
disintegration, assay, dissolution test performed. The results are as follows of table 9.
Physical parameter of Glibenclamide tablet at Minimum Speed (2200 Tabs/min) and Maximum Speed (2750 Tabs/ Min) of compression for three validation batches X, Y, Z were found in the range within the acceptance criteria and specification.
3.7 Compression stage analytical results
Compression stage analysis in their content uniformity, assay by HPLC and dissolution were checked at minimum speed and maximum speed as same as to physical parameters and results describe in table 10.
% dissolution of Glibenclamide at Optimum speed of compression for three validation batches X, Y, Z were found in the range which were within the acceptance criteria.
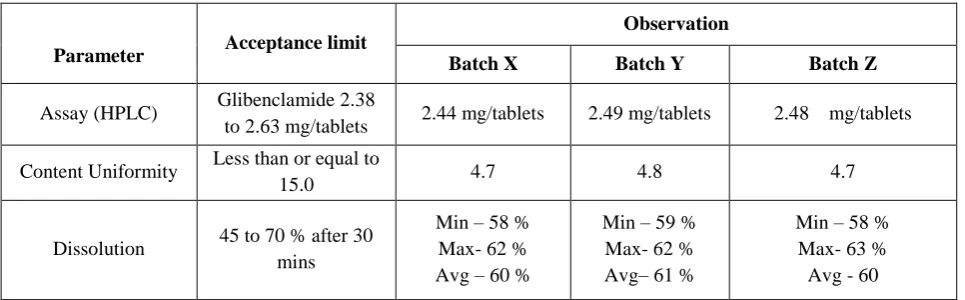
3.8 Analysis of Compressed Tablet
The analysis of compressed tables is done by assay, content uniformity and dissolution rate of Glibenclamide compressed tablets results are shown in table 11.
Assay, content uniformity and dissolution rate of Glibenclamide at initial, middle, end and composite stage of compression at optimum were found within the acceptable limit that is Glibenclamide2.38 to 2.63 mg/tablets.
4. CONCLUSION
The prospective process validation of Glibenclamide 2.5 mg tablet has been performed for three batches and all the parameters and results were found within the acceptance limit at all stages such as dry mixing, wet granulation, drying, milling, lubrication, and compression. Based on the results of the validation data for three batches, it was concluded that the manufacturing process used for formulation of Glibenclamide 2.5 mg tablet will consistently producing the stable product meeting its predetermined specifications and quality attributes. Hence, it can be concluded that the method employed in the manufacture of the given product is considered to be validated and can be routinely followed.
5. ACKNOWLEDGMENT
The authors are thankful to the Wockhardt Ltd., Aurangabad, and H. R. Patel Institute of Pharmaceutical Education & Research, Shirpur, Dist: Dhule for providing the necessary facilities.
CONFLICT OF INTEREST
227
Table 1.List of EquipmentsSr. No. Equipment Make Stages Involved In
1 Weighing balance Mettler Toledo All stages
2 Vibratory sifter (30inch) PHARMA FAB Sifting of raw materials
3 Rapid Mixer Granulator BOWMEN &
ARCHER Dry mixing and granulation
4 Fluid bed drier (250 kg) BOWMEN &
ARCHER Drying
5 Multi-mill(50 T0 250 Kg/Hrs) PHARMA FAB Sizing
6 Octagonal Blender (1200 Lit) BECTOCHEM Blending
7 Compression machine. CALMACH Compression
8 Friability test apparatus ELECTROLAB To check friability
9 Hardness tester ELECTROLAB To check hardness
10 Dissolution Apparatus Electrolab(USP) Dissolution Testing
11 Disintegration apparatus Electrolab (USP) To check disintegration time
12 Blister Packing Machine Elmach Pack For Packing of Tablets
13 Metal Detector Sivo System PVT
LTD
To Detect metal traces in tablets
14 UV Spectrophotometer Shimadzu For Analysis
15 HPLC Shimadzu For Analysis
Table 2.Detail input of material
Sr. No Ingredients Specification Category
1 Glibenclamide BP Active Ingredient
2 Lactose Monohydrate Ph. Eur Diluents
3 Maize Starch Ph. Eur Binder
4 Povidone K30 BP Diluents
5 Magnesium Stearate
(Vegetable Grade) EP Lubricant
228
Table 3.Sampling and testing plan
Stage Sample Location Sample Size Test
Dry mixing
After completion of drying, draw composite sample from 11 different location of RMG after 5,10,15 min. of mixing of API and excipients
Approx. 300 mg /each location
Blend uniformity
Drying
Samples of dried granules shall be withdrawn from 5 sampling points comprising left, right, center, front, back layer of FBD bowl.
Approx.
5.0 g /each location
Loss on Drying
Lubrication Stage
Unit dose samples shall be withdrawn from 11 different location of the blender comprising of upper, middle, lower layer and bottom layer after 3 minutes mixing with Lubricant in Octagonal blender.
Approx. 1100 mg.
Blend uniformity
Lubricated Blend
Approximately 300 g of lubricated bulk blend to be sampled for physical characteristic evaluation.
Approx. 300 g
Physical characteristics 1. Description
2. Bulk density Tapped
density
3. Angle of repose
4. Particle size analysis
5. Assay
6. Sieve analysis.
Compression Stage
a. Minimum
speed
b. Optimum
speed
c. Maximum
speed
During compression, samples to be collected & mixed from both sides of press(RHS and LHS) at initial, middle and at the end of compression
operation 150 Tablets at
each stage
1. Description
2. Average weight
3. Uniformity of Weigh.
4. Friability
5. Hardness
6. Thickness
7. Dissolution
8. Content uniformity
Finished Product
After final compression of tablets before packing this analysis is carried.
150 Tablets 1. Assay
2. Dissolution
229
Table 4. Dry mixing stage blend uniformity resultsSr. No. Location Acceptance Criteria Batch X Batch Y Batch Z
1 T1 Individual values should be between 90.0 % to
110.0 % of labeled amount of Glibenclamide
with RSD NMT 5 %.
101.5 101.5 101.5
2 T2 101.1 101.1 101.1
3 T3 100.8 100.8 100.8
4 B1 100.4 100.4 100.4
5 B2 100.9 100.9 100.9
6 B3 101.1 101.1 101.1
Minimum 100.4 100.5 100.4
Maximum 101.5 101.6 101.5
Mean 100.9 100.9 101
% RSD 0.3 0.3 0.4
T: Top, B: Bottom
Table 5.Results of Drying Homogeneity Analysis
Sr. No Limit 7.3 to 8.0 w/w at 120 0C for 20 minutes Batch X Batch Y Batch Z
1 Top 7.31 7.30 7.33
2 Middle 7.80 7.82 7.81
3 Bottom 7.87 7.86 7.89
Table 6.Result of Blend Uniformity of Lubricated Blend
Sr. No.
Location Acceptance Criteria Batch X Batch Y Batch Z
1 U1 Individual values should be between 90.0 % and
110.0 % of labeled amount of Glibenclamide with RSD not more than 5.0 %
96.9 96.8 96.7
2 U2 98.8 98.9 98.7
3 U3 98.2 98.3 98.5
4 M1 100.1 100.3 100.2
5 M2 98.3 98.2 98.4
6 M3 98.3 98.5 98.3
7 L1 98.6 98.5 98.4
8 L2 100.4 100.6 100.5
9 L3 100 99.9 100.1
11 BO 99 99.2 99.3
Minimum 96.9 96.8 96.7
Maximum 100.4 100.6 100.5
Mean 98.86 98.92 98.91
% RSD 1.07 1.14 1.15
230
Table 7.Results of Assay of Lubricated BlendTest Acceptance Criteria Observation
Batch X Batch Y Batch Z
Description White granules free from extraneous
matter (Blend) Complies Complies Complies
Assay
2.375 mg to 2.625 mg of Glibenclamide per average weight of
Blend NMT 95.0 % and NMT 105.0 % of label claim of Glibenclamide
97.2 97.8 98.1
Loss on
Drying For information only 8.65 8.78 8.33
Bulk Density For information only 0.6946 mg/ml 0.7130 mg/ml 0.6888 mg/ml
Tapped
Density For information only 0.81 g/ml 0.86 g/ml 0.79 g/ml
Sieve Test For information only
Sieve
No. % of Sample passes
20 # 93.1 % 94.3 % 93.4 %
40 # 68.0 % 68.8 % 69.2 %
60 # 60.1 % 59.8 % 61.2 %
80 # 56.9 % 57.2 % 56.7 %
100 # 46.8 % 47.2 % 46.3 %
Table 8.Physical Characteristic of Lubricated Blend
Sr.
No. Parameter Batch X Batch Y Batch Z
1 Description White Colored Powder
Blend
White Colored Powder Blend
White Colored Powder Blend
2 Bulk density gm/ml 0.65 0.62 0.65
3 Tapped density gm/ml (500taps) 0.68 0.68 0.69
4 Loss On Drying 1.98% 1.51% 1.55%
5 Angle of Repose 24.09 23.38 24.09
6
Particle Size Distribution Cumulative Retention
(%)
Cumulative Retention (%)
Cumulative Retention (%)
Above 20# 1.72 % 98.3 % 98.3 %
Above 60# 24.59 % 49.4 % 75.4 %
Above 80# 40.61 % 28.2 % 59.4 %
231
Table 9.Compression stage Physical parameters Bach X, Batch Y and Batch Z
Test Acceptance Criteria Minimum Speed
(2200 Tabs/min)
Maximum Speed (2750 Tabs/ Min)
LHS RHS LHS RHS
Batch X
Description White circular tablets debossed
with GL/2.5 on one side
Complies Complies Complies Complies
Average Weight 80.0 mg ± 5 % (76.0 to 84.0 mg) 83.7 mg 82.3 mg 80.9 mg 80.7 mg
Uniformity Weight
NMT 2 tablets deviate by more than ± 10 % from the average weight and none deviate by ±20 % from the average weight.
-2.03 to + 1.55 %
-1.58 % to +2.07 %
- 2.35 % to +2.60 %
- 3.35 % to +5.33 %
Hardness 19.6 N to 49.0 N Min – 32
Max - 44
Min – 31 Max - 35
Min – 29 Max - 35
Min – 28 Max – 32
Thickness 2.50 to 3.00 mm Min – 2.79
Max – 2.85
Min – 2.74 Max – 2.79
Min – 2.73 Max – 2.79
Min – 2.72 Max – 2.81
Friability Not more than 1 % w/w 0.28 % 0.24 % 0.26 % 0.24 %
Disintegration Not more than 8 minutes 01 min
44 sec 01 min 02 sec 01 min 12 sec 01 min 32 sec Batch Y
Description White circular tablets debossed
with GL/2.5 on one side
Complies Complies Complies Complies
Average Weight 80.0 mg ± 5 % (76.0 to 84.0 mg) 82.8 mg 83.5 mg 81.8 mg 84.2 mg
Uniformity Weight
NMT 2 tablets deviate by more than ± 10 % from the average weight and none deviate by ± 20 % from the average weight.
- 2.04 to + 1.52 %
-1.55 % to +2.09 %
- 2.28 % to +2.59 %
- 3.33 % to +5.36 %
Hardness 19.6 N to 49.0 N Min – 33
Max - 42
Min – 31 Max - 36
Min – 32 Max - 39
Min – 27 Max – 31
Thickness 2.50 to 3.00 mm Min – 2.55
Max – 2.86
Min – 2.64 Max – 2.78
Min – 2.76 Max – 2.98
Min – 2.69 Max – 2.83
Friability Not more than 1 % w/w 0.31 % 0.29 % 0.28 % 0.26 %
Disintegration Not more than 8 minutes 01 min
38 sec 01 min 22 sec 01 min 18 sec 01 min 23 sec Batch Z
Description White circular tablets debossed
with GL/2.5 on one side
Complies Complies Complies Complies
Average Weight 80.0 mg ± 5 % (76.0 to 84.0 mg) 84.6 mg 82.8 mg 82.8 mg 83.8 mg
Uniformity Weight
NMT 2 tablets deviate by more than ± 10 % from the average weight and none deviate by ± 20 % from the average weight.
- 2.11 to + 1.53 %
-1.49 % to +2.07 %
- 2.25 % to +2.60 %
- 3.34 % to +5.34 %
Hardness 19.6 N to 49.0 N Min – 35
Max - 41
Min – 31 Max - 39
Min – 29 Max - 36
Min – 29 Max – 33
Thickness 2.50 to 3.00 mm Min – 2.54
Max – 2.76
Min – 2.70 Max – 2.83
Min – 2.66 Max – 2.86
232
Friability Not more than 1 % w/w 0.33 % 0.27 % 0.29 % 0.25 %
Disintegration Not more than 8 minutes 01 min
33 sec
01 min 29 sec
01 min 21 sec
01 min 26 sec
Table 10.Compression stage analytical results
Test Acceptance Criteria Batch X Batch Y Batch Z
Min Speed
Max Speed
Min Speed
Max Speed
Min Speed
Max Speed
Uniformity of dosage (by content uniformity)
Less than or equal to 15.0 4.6 4.2 4.3 5.1 4.8 4.9
Assay (By HPLC) 95.0 % to 105.0 % of label
amount of glibenclamide
97.6 %
96.0 % 97.0 % 98.8 % 97.2 % 98.6 %
Dissolution Profile in % Limit
between 45 % to 70 % after 30 mins
Min 54 56 55 57 56 57
Max 58 60 59 61 57 59
Avg 56 58 57 59 57 58
Table 11.Results of analysis of compressed tablet
Parameter Acceptance limit
Observation
Batch X Batch Y Batch Z
Assay (HPLC) Glibenclamide 2.38
to 2.63 mg/tablets 2.44 mg/tablets 2.49 mg/tablets 2.48 mg/tablets
Content Uniformity Less than or equal to
15.0 4.7 4.8 4.7
Dissolution 45 to 70 % after 30
mins
Min – 58 % Max- 62 % Avg – 60 %
Min – 59 % Max- 62 % Avg– 61 %
Min – 58 % Max- 63 % Avg - 60
*Min: Minimum, Max: Maximum, Avg: Average
233
Fig 1.Manufacturing process flow chart of Glibenclamide 2.5 mg tablet
REFERENCES
1. Manohar A. Potdar, Pharmaceutical Quality Assurance, Nirali Prakashan, Second Edition, Dec. 2007: 8.1 - 8.6.
2. Food and Drug Administration’s Guidance for Industry Process Validation: General Principles and Practices, Revision I, January 2011: 8-14.
3. Prashant B P, Rupesh K, Zamir G K. Process Validation of Bethanechol Chloride Tablet 25 mg. International Journal of Pharmaceutical, Chemical & Biological Sciences. 2016 Apr 1; 6(2): 167-181.
4. Agalloco J. Validation: an unconventional review and reinvention. PDA journal of pharmaceutical science and technology. 1995 Jul 1; 49 (4):175-9.
5. Global Harmonization Task Force (GHTF), Quality Management System, Process Validation Guidance, Study Group – 3, January 2004: 6-7.
6. Vinod J. Process Validation of Atrovastatine Tablet 1 mg. Indo American Jour of Pharma Res. 2013; 3(12):1438-50.
7. "Guidance for Industry Process Validation: General Principles and Practices" (PDF). Food and Drug Administration. Retrieved 16 December 2014.
8. Bahri-Najafi R, Tavakoli N, Senemar M, Peikanpour M. Preparation and pharmaceutical evaluation of glibenclamide slow release mucoadhesive buccal film. Research in pharmaceutical sciences. 2014 May; 9(3):213. 9. Patil Prashant B, Nandwalkar Rahul K, Khan Zamir G. Prospective
Process Validation Study of Nifedipine Extended Release Tablets. Inventi Rapid: Pharm Analysis & Quality Assurance, 2016(3): 1-7. 10. Kour G. Process Validation of Metered Dose Inhaler, Inter. Jour of Res
Pharm. 2012; 3(3): 55 – 59.