Egypt. J. Soil Sci. Vol. 55, No. 2, pp.155-170 (2015)
10
S
Assessing Long Term Changes of Productivity in
Some Floodplain Soils, Egypt, Using Spatial
Analyses Techniques
A.A. El Baroudy
Soil and Water Department, Faculty of Agriculture, Tanta University, Egypt.
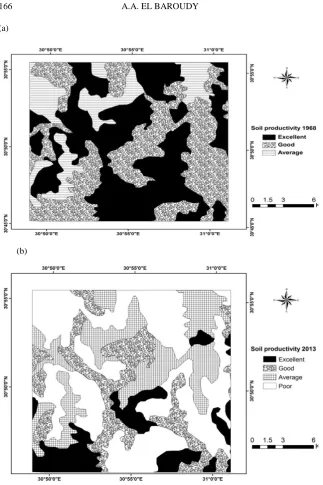
OIL productivity evaluation for a long term has been a major …..hotspot in soil science. The current study aims at monitoring soil productivity within the last four decades in the middle of the Nile Delta, Egypt. To fulfill this objective, eleven soil profiles were collected to represent the different mapping units. Landsat ETM+ image dated at 2013 and digital elevation model (SRTM) were processed using ENVI 4.7 software to identify the main physiographic units in the studied area. The results indicate that flood plain is the main landscape, while the main landforms of the area under consideration are grouped as basins, mantles and river terraces. Two soil orders could be identified; Entisols and Aridisols that include four great groups, i.e., Typic Torrifluvents, Vertic Torrifluvent, Vertic Natrargids and Typic Natrargids. The spatial analyst function in ArcGIS 9.3 was used to estimate the rating of moisture content, drainage condition, effective soil depth, texture/structure, soluble salt concentration, organic matter content, mineral exchange capacity/nature of clay and mineral reserve. According to soil productivity in 2013, results showed that 73.46% of the total area have decreased productivity compared with soil productivity in 1968 and this is due to many problems, and the most influencing factors are high soil salinity and high exchangeable sodium percentage and rising soil water table, while about 13.06% of these lands have increased their productivity and thus to improve the properties of these soils and increase the soil productivity, agricultural management must take care to reduce salinity, alkalinity, and improve the drainage system. Keywords: Soil productivity, Physiographic units, Floodplain, Spatial
analyses.
the same time a precise concept in terms of agricultural activities. It is defined as a measure of capability of land to perform specific functions (Devi and Kumar, 2008). The land productive capacity can be evaluated directly or indirectly. Direct evaluations are carried out in the field, greenhouses or laboratory by means of some experiments under given climatic and management conditions. Indirect evaluations consist basically in developing and applying models of varying complexity, thereby attempting to estimate land productivity (Delgado and Lopez, 1998 and Dengiz et al., 2010). Riquier et al. (1970) suggested five rating for evaluating soil productivity, i.e., extremely poor to nil V (0–7), poor IV (8–19), average III (20–34), good II (35–64) and excellent I (65– 100).
The different types and procedures in land evaluation are gradually being developed. Interpreting soil qualities and site information for the agricultural use and management practices is integrated using geographical information system (FAO, 1991 and 2007). Eswaran et al. (2003) made use of Geographic Information System to assess and monitor quality of land. They combined the soil and climate variables as these influence agricultural productivity.GIS and RS offer a great potential to capture data through a variety of observation platforms and integrate them through their common spatial network. This advanced approach justifies the involvement of object-oriented database structures in the decision-making process as this digital framework is an efficient system for marinating data records for easy access toward decision making (Adrian et al.,
2010). The spatial analysis was used in this study, it can be defined as the analytical techniques associated with the study of locations of geographic phenomena together with their spatial dimensions and their associated attributes (ESRI, 2009). Spatial analysis is useful for evaluating suitability, for estimating and predicting, and for interpreting and understanding the location and distribution of geographic features and phenomena. The use of spatial analyses techniques in evaluating the land capability allows producing multi-thematic maps and outlining the limiting factors, accordingly suitable suggestions could be attained to understand how to deal with these soils for sustainable agricultural use. Therefore, the aims of this study are to produce the physiographic map of the study area scale 1:50.000 reduced to the attached map, as well as to use spatial analyses techniques in monitoring the soil productivity in the flood plain soils of the middle Nile Delta in Egypt.
Material and Methods
Location of the study area
exceeds 26.4°C but the temperature average reaches its minimum in January, February and March recording 13.7°C in Tanta station. The amount of annual rainfall is very low and mostly falls in winter; reaching about 3.8 mm/year. The studied area belongs to the late Pleistocene which is represented by the deposits of the neonile and those deposits accumulated during the recessional phases of the river (Said, 1993). Most of the study area is flat to almost flat (slope < 2.0%). The study area has been under intensive agricultural activities, whereas, rice, wheat, maize, cucumber and tomato with flood irrigation have been produced in the study area.
Fig.1. Location of the study area.
Digital image processing and physiographic mapping
Digital image processing was executed for Landsat ETM+ 8 satellite image (path 176, row 39) with spatial resolutions of 30 meters acquired in April 2013 using ENVI 4.7 software (ITT 2009). Data were calibrated to radiance using the inputs of image type, acquisition date and time. Images were stretched using linear 2%, smoothly filtered and their histograms were matched according to Lillesand and Kiefer (2007). Image was atmospherically corrected using FLAASH module (ITT 2009).
Field studies and laboratory analyses
Eleven soil profiles were collected and were taken from two sample areas, typically covering about 10% of the investigated area. This sample areas crossed the different mapping unites (Hengl and Rossiter, 2003). The locations of the soil profiles were selected to be the same sites previously studied by the Research Institute of Soils and Water (RISW 1968). Representative disturbed 44 soil samples have been collected. The samples were air dried and the less than 2 mm particles were used for chemical analyses. Electrical conductivity (EC) was determined conduct-metrically in saturated soil paste extracted. Cation exchange capacity (CEC) and exchangeable sodium percentage (ESP) were determined by ammonium acetate (NH4OAC). Organic matter (OM) was determined by the modified Walkley and Black method. Total calcium carbonate was determined volumetrically using Collin's calcimeter method. Particle size distribution of the soil samples was determined according to the international pipette method. The laboratory analyses were carried out using the soil survey laboratory methods manual (USDA, 2004). The soils were classified to the sub great groups level based on the American Soil Taxonomy (USDA, 2010). Then the physiographic and taxonomic units were correlated in order to identify the major soil sets of the studied area (Elberson and Catalan, 1987).
Soil productivity assessment
The land productivity classes were defined to monitoring soil productivity in the studied area using the rating and procedure after Riquier et al. (1970) model modified by FAO (2007). The system suggests the calculation of a productivity index considering eight factors as determining land productivity; Moisture (H), Drainage (D), Soil depth (P), Texture/Structure (T), Soluble salt concentration (S), Organic matter (O), Mineral exchange capacity (A) and Mineral reserve (M). These characteristics concern are rated and used to calculate the productivity index (PI) according to the following equation:
PI= (H/100*D/100*P/100*T/100*S/100*O/100*A/100*M/100)*100
Each factor is rated on a scale from 0 to 100 and the resultant index of productivity, also lying between 0 and 100, is set against a scale placing the soil in one or other of five productivity classes. Each of land and soil and land characteristics with associated attribute data are digitally encoded in a GIS database to eventually generate eight thematic layers. Based on comparing between the data extracted from RISW report, (1968) and the data resulting from this study the previous and actual soil productivity maps were produced.
Results and Discussion
Physiography and soils
construction. They are developed from sediments of Ethiopian plateau transported by Nile River and subsequently deposited in both the valley and Delta. The flood plain in the study area has been divided into four landforms are namely decantation basins, overflow basins, river terraces and overflow mantles. The correlation between physiography and soils was carried out, the produced data reveal that the soils of the main physiographic units in the area could be arranged under the landform level in the following:
Fig.2. Physiography of the study area.
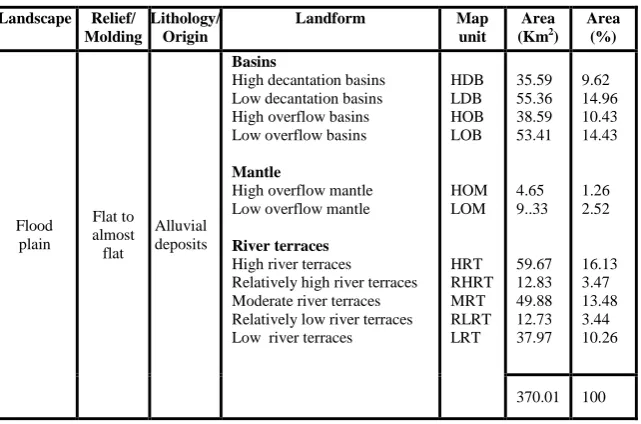
TABLE 1. Areas of the different physiographic units in the studied area.
Landscape Relief/
Molding
Lithology/ Origin
Landform Map
unit
Area
(Km2)
Area (%) Flood plain Flat to almost flat Alluvial deposits Basins
High decantation basins Low decantation basins High overflow basins Low overflow basins
Mantle
High overflow mantle Low overflow mantle
River terraces High river terraces Relatively high river terraces Moderate river terraces Relatively low river terraces Low river terraces
HDB LDB HOB LOB HOM LOM HRT RHRT MRT RLRT LRT 35.59 55.36 38.59 53.41 4.65 9..33 59.67 12.83 49.88 12.73 37.97 9.62 14.96 10.43 14.43 1.26 2.52 16.13 3.47 13.48 3.44 10.26
Soils of decantation basins
Decantation basins are a low-lying area which is wholly or largely surrounded by higher land. It receives its ground deposits from overflow basins as it is lower than it. This landform covers an area of 86.4 km2, including soils of high decantation basins and soils of low decantation basin. These are classified to the sub-great group level as Typic Natrargids and Typic Torrifluvents, respectively. The soils of these units have different patterns of texture classes, where the soils of this unit vary from loam, clay loam and silty clay loam in the different profiles layers. The calcium carbonate content ranges between 2.09 and 4.16%. The high values are due to the occurrence of shell fragments. The organic matter content ranges between 0.49 and 3.83% in the successive layers of the studied soil profiles. The high values of organic matter in the surface and subsurface layers are related to the continuous adding of the organic manure. The electrical conductivity (ECe) values range between 4.39 and 21.65 dS/m in the successive layers of soil profiles. The cation exchange capacity (CEC) value is a result of the clay and organic matter content. However, the clay mineral plays a significant role, the cation exchange capacity ranges between 42.73 and 52.67 cmol+/kg soils. The exchangable sodium percentage (ESP) values fluctuate between 19.36 and 37.68% in the different layers of the representative soil profiles.
Soils of overflow basins
Overflow basins are large, bowl-shaped depression in the surface of the land floor. It deposits its load of sedimentation carried by water into decantation basins. The total area of this landform is 83.64 km2, including high overflow basins and low overflow basin. These are classified to the sub-great group level as Vertic Torrifluvents and Typic Natrargids, respectively. The texture class is clay loam and loam in the different profile layers. The calcium carbonate content ranges between 1.5 and 4.2 %. The organic matter content ranges between 0.63 and 2.93% in the successive layers of the studied soil profiles. The EC values range between 4.62 and 22.45dS/m in the successive layers of soil profiles. The cation exchange capacity ranges between 42.73 and 46.32 cmol+/kg soils. The exchangable sodium percentage (ESP) values fluctuate between 22.34 and 29.81% in the different layers of the representative soil profiles.
Soils of river terraces
Soils of overflow mantles
Soils of overflow mantles cover an area of 13.98 km2, including high and low overflow mantles. These are classified to the sub-great group level as Vertic Natrargids and Typic Natrargids. The soils of this unit vary from silt loam and clay in the different profile layers. The calcium carbonate content is low ranging between 1.28 and 2.88 %. The organic matter content records a range of 0.67 and 1.34%. The EC values are moderate to high ranging between 8.71 and 18.40 dS/m. Cation exchange capacity is high where it ranges between 40.69 and 49.35 cmol+/kg soils. Exchangeable sodium percentage is very high where it ranges between 23.88 and 29.98%.
Monitoring of soil characteristics in the studied area
TABLE 2. Monitoring of the main land characteristics in the studied area. Pr o fi le N o . M a p p in g u n it Wa te r ta b le le v el ( cm)
EC dS/m ESP % OM %
C E C C mo l+ / k g s o il T ex tu re 1 9 6 8 2 0 1 3 1 9 6 8 2 0 1 3 1 9 6 8 2 0 1 3 1 9 6 8 2 0 1 3 1 9 6 8 2 0 1 3 1 9 6 8 2 0 1 3
1 HDB 100 95 4.32 5.94 8.64 12.63 1.65 3.65 47.68 49.25 Clay loam
2 LDB 90 70 7.84 14.15 14.74 20.47 0.98 2.47 40.35 42.62 Silt clay loam
3 HOB 150 120 7.4 14.5 14.83 20.47 0.68 2.31 42.35 44.25 Loam
4 LOB 110 100 8.32 16.32 16.84 26.7 0.91 1.45 43.19 43.67 Loam
5 HOM 150 110 6.73 12.44 16.24 27.43 0.96 1.36 56.89 58.36 Clay
6 LOM 150 120 7.65 13.91 17.57 26.75 0.94 2.21 41.25 42.45 Silt loam
7 HRT 130 110 3.57 9.11 24.26 26.65 1.83 2.16 43.26 44.68 Loam
8 RHRT 120 95 4.28 6.11 26.27 28.41 1.76 2.14 37.15 39.71 Silt loam
9 MRT 100 90 5.35 7.62 25.35 27.25 0.92 1.84 38.99 39.54 Silt clay
10 RLRT 110 95 5.74 6.58 10.58 20.43 0.99 2.26 43.52 45.32 Clay loam
11 LRT 100 90 7.42 9.35 12.65 20.43 0.89 0.93 28.74 29.54 Loam
Fig.4. Changes of OM in the different landforms between 1968 and 2013.
Fig.5. Changes of CEC in the different landforms between 1968 and 2013.
Fig.7. Changes of ESP in the different landforms between 1968 and 2013.
Monitoring of soil productivity in the studied area
A comparative study was carried out to monitor changes in soil productivity based on some selected soil properties defined by the productivity index as shown in Tables 3 and 4 and Fig. 8. Soil characteristics and productivity criteria are matched for getting soil productivity. Monitoring of soil productivity includes the following main landforms, i.e., decantation basins, overflow basins, river terraces and overflow mantle. Table 4 represents the changes in area by square kilometers for each soil productivity grad (G) and index (PI) in the study area. The sites selection depends mainly upon previous study carried out by RISW (1968) to make comparison as well as monitoring more realistic. The soil characteristics of previous and current studies were grouped and recalculated to meet the requirements of Riquier et al. (1970) modified by FAO (2007) as follows:
Soil productivity changes in the decantation basins
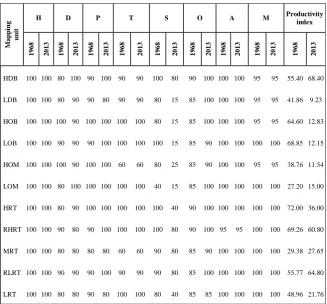
TABLE 3. Soil productivity index in the studied area during 1968 and 2013.
M
ap
p
in
g
u
n
it
H D P T S O A M Productivity
index
1968 2013 1968 2013 1968 2013 1968 2013 1968 2013 1968 2013 1968 2013 1968 2013 1968 2013
HDB 100 100 80 100 90 100 90 90 100 80 90 100 100 100 95 95 55.40 68.40
LDB 100 100 80 90 90 80 90 90 80 15 85 100 100 100 95 95 41.86 9.23
HOB 100 100 100 90 100 100 100 100 80 15 85 100 100 100 95 95 64.60 12.83
LOB 100 100 90 90 90 100 100 100 100 15 85 90 100 100 100 100 68.85 12.15
HOM 100 100 100 90 100 100 60 60 80 25 85 90 100 100 95 95 38.76 11.54
LOM 100 100 80 100 100 100 100 100 40 15 85 100 100 100 100 100 27.20 15.00
HRT 100 100 80 90 100 100 100 100 100 40 90 100 100 100 100 100 72.00 36.00
RHRT 100 100 90 80 90 100 100 100 100 80 90 100 95 95 100 100 69.26 60.80
MRT 100 100 80 80 80 80 60 60 90 80 85 90 100 100 100 100 29.38 27.65
RLRT 100 100 90 90 90 100 90 90 90 80 85 100 100 100 100 100 55.77 64.80
LRT 100 100 80 80 90 80 100 100 80 40 85 85 100 100 100 100 48.96 21.76
Moisture (H), Drainage (D), Soil depth (P), Texture/Structure (T), Soluble salt concentration (S), Organic matter (O), Mineral exchange capacity (A) and Mineral reserve (M).
TABLE 4. Areas of soil productivity grades in 1968 and 2013.
PI Grade 1968 2013
Area (km2) % Area (km2)
% 0-7 Nil to extremely poor
(V)
- - - -
8-19 Poor (IV) - - 161.34 43.61
20-34 Average (III) 59.21 16.00 87.85 23.74
35-64 Good (II) 146.30 39.54 72.50 19.59
(a)
(b)
Fig. 8. Productivity index of the studied area, (a) 1968 and (b) 2013.
Soil productivity changes in the overflow basins
poor grade (IV) in 2013. The reduction of soil productivity in these units is related to increase soil salinity (from moderate salinity to very high salinity), increase water table level and increase soil alkalinity (from moderate alkalinity to high alkalinity) and degraded drainage condition
Soil productivity changes in the river terraces
These soils are formed of terraces at various heights above the valley floor. These land forms including high river terraces (HRT), relatively high river terraces (RHRT), moderate river terraces (MRT), relatively low river terraces (RLRT) and low river terraces (LRT). Values of soil productivity index in the HRT and RHRT landforms were decreased from excellent grade (I) in 1968 to good grade (II) in 2013, where PI in the HRT and RHRT decreased from 72.0 and 69.26 to 36.0 and 60.8, respectively during 1968 and 2013 period. Soil productivity index in the LRT decreased from good grade (48.96) to average grade (21.76) during 1968 and 2013 period. Moderate river terraces were classified as average grade (III) in the two studied periods. The productivity index (PI) of the relatively low river terraces (RLRT) changed positively from good grade (55.77) to excellent grade (64.8), the improvement of soil productivity in this landform due to the good quality of land management practice.
Soil productivity changes in the overflow mantles
Soils of overflow mantles divided to high overflow mantles (HOM) and low overflow mantles (LOM). The productivity index (PI) of the high overflow basins (HOB) changed negatively from good grade (38.76) to poor grade (11.54) during the studied period. The calculated values of PI for the low overflow basins (LOB) unit were shifted from average grade (27.2) in 1968 to poor grade (15.0) in 2013. The main factors reduced the productivity index in HOB & LOB are soluble salts concentration and the effective soil depth, where the soil salinity increased from 6.73-12.44 and 7.65 - 13.91 dS/m in HOB and LOB, respectively.
Conclusion
References
Adrian, B., Manuela D., Alin, M. and Mirela, M. (2010) Sustainable development by GIS. Research Journal of Agricultural Sciences, 42(1), 48–60.
Agber, P.I. and Ali, A. (2012) Evaluation of the productivity of soils in Makurdi, Southern Guinea Savanna, Nigeria, using riquier index. Journal of Environmental Science and Water Resources, 1(5), 100 – 104.
Ali, R.R. (2012) The impact of land degradation on soil productivity in irrigated agriculture: A case study from El Sharkia Governorate, Egypt. AustralianJournal of Basic and Applied Sciences, 6(12), 453-463.
Climatologically Normal for Egypt (2011) The normal for Gharbia governorate station (1960–2011). Ministry of Civil Aviation: Meteorological Authority, Cairo, Egypt. Delgado, F. and Lopez, R. (1998) Evaluation of soil development impact on the
productivity of venezuelan soils. Adv. GeoEcol. 31, 133-142.
Dengiz O., Ozcan, H., Köksal, E.S., Baskan, O. and Kosker, Y. (2010) Sustainable natural resource management and environmental assessment in the salt lake (Tuz Golu) specially protected area. Journal of Environmental Monitoring and Assessment 161, 327-342.
Devi, G.M.G. and Kumar, K.S.A. (2008) Remote sensing and GIS application for land quality assessment for coffee growing areas of Karnataka. Journal of the Indian Society of Remote Sensing, 36, 89-97.
Elberson, G. and Catalon, R. (1987) Portable Computers in Physiographic Soil Survey. In: Proceedings of the International Soil Science Congress, Homburg.
El Baroudy, A.A. (2010) Geomatics based soil mapping and degradation risk assessment of some soils east Nile Delta, Egypt. Polish Journal of Environmental Studies, 19 (6), 1123-1131.
El Baroudy, A.A. (2011) Monitoring land degradation using remote sensing and GIS techniques in an area of the middle Nile Delta. Egypt. Catena, 87(2), 201-208. ESRI (2009) Arc map version 9.3.1. User Manual, ESRI: ESRI product, California,
92373-8100, USA.
Eswaran, H., Bienforth, F.H. and Reich, P. (2003) A Global Assessment of Land Quality. In: Wiebe (Ed.) Land Quality,Agricultural Productivity and Food Security: Biophysical Processes and Economic Choices at Local, Regional and Global Levels. Publ. Edward Elgar Northampton, MA. USA, pp 112-132.
Gab-Allah, M.S. (2013) Evaluation of some soils adjacent to the northern lakes of the Nile delta by using remote sensing and GIS techniques. M.Sc. Thesis, Tanta. University, Egypt.
Hengl, T. and Rossiter, D. (2003) Supervised landform classification to enhance and replace photo-interpretation in semi-detailed soil survey. Soil Science Society of America Journal, 67, 1810–1822.
ITT (2009) ITT Corporation ENVI 4.7 software, 1133 Westchester Avenue, White Plains, NY 10604, USA.
Lillesand, T.M. and Kiefer, R.W. (2007) Remote Sensing and Image Interpretation, fifth ed. John Wiley, New York.
RISW (1968) Soil survey of El-Gharbia Governorate. Report No. 226.
Riquier, J., Bramao, D.L. and Cornet, J.P. (1970) A new system of appraisal in terms of actual and potential productivity. FAO Soil Resources, Development and Conservation Services, Land and Water Development Division, FAO, Rome, p 38. Said, R. (1993) The River Nile Geology and Hydrology and Utilization. Britain Pergmon
Press, Oxford, 320 pages.
USDA (2004) Soil Survey Laboratory Methods Manual, Soil Survey Investigation (2004) Report No. 42 Version 4.0.
USDA (2010) Keys to Soil Taxonomy, 11th ed. United States Department of Agriculture, Natural Resources Conservation Service (NRCS).
ىدملا ىلعرصم ىف ةيضيفلا ىضارلاا ضعب ةيجاتنا تاريغت مييقت
يناكملا ليلحتلا تاينقت مادختساب ليوطلا
ىدورابلا حاتفلا دبع دمحأ هايملاو ىضارلاا مسق – ةعارزلا ةيلك – اطنط ةعماج – رصم .
ملا يف ةيسيئرلاو ةماهلا طاقنلا نم ليوطلا ىدملا ىلع ةبرتلا ةيجاتنإ مييقت ربتعي لاج
ىعارزلا . ةعبرلأا دوقعلا للاخ ةبرتلا ةيجاتنإ دصر ىلإ ةيلاحلا ةساردلا فدهتو
رصم ،لينلا اتلد طسو يف ةيضاملا .
ذخا مت فدهلا اذه قيقحتلو 11
ايضرا اعاطق
ةيضرلاا تادحولا ليثمتل ةساردلا ةقطنم نم .
ىعانصلا رمقلا ةروص تمدختساو
Landsat ETM+ ماعل
3112 يب ةجلاعم متو ىفارغوبطلا ىرادارلا حساملا تانا
( SRTM ) داعبلاا ىثلاث جذومنلا ىلع لوصحلل (DEM)
جمانرب مادختساب
ENVI ةساردلا ةقطنمل ةيفارجويسفلا ةطيرخلا جاتنلإ كلذو .
ةيرهنلا تافرشلاو لتناملاو ضاوحلأا نأ اهيلع لصحتملا جئاتنلا تحضوأو دوجوملا ةيسيئرلا ةيسيراضتلا تادحولا ىه متو ةسوردملا ةيضيفلا ىضارلأا ىف ة
ةبتر امه نيتيساسا نيتبتر ىلا اهميسقت Entisols
ةبترو Aridisols ىتلاو
ىه ىمظع تاعومجم عبرا امهلثمي Typic Torrifluvents
، Vertic Torrifluvent ، Vertic Natrargids و Typic Natrargids .
نم ةيفارغجلا تامولعملا مظن تاودا دحأك ةيناكملا تلايلحتلا تمدختسا دقو جمانرب للاخ Arc-GIS 9.3
ةلاحو ، ىبوطرلا ىوتحملا نم لاك تلاماعم باسحل
ماوقلا و ، ىضرلأا ءاملا قمعو ، فرصلا /
، ةبئاذلا حلاملاا زيكرتو ، ءانبلا
دابتلا ةعسلاو ةيوضعلا ةداملا نم ضرلأا ىوتحمو ةيجاتنا مييقتل كلذو ةيندعملا ةيل
ةساردلا ةقطنم ىف ةبرتلا .
ةنراقم دنعو جئاتن
ماع ةبرتلا ةيجاتنا 3112
ماع ةبرتلا ةيجاتنا عم 1691
نأ جئاتنلا تحضوأ 62.39
% تضفخنا دق ةسوردملا ةيلكلا ىضارلأا ةحاسم نم
ت لماوعلا هذه رثكاو ، ةديدع لكاشم ىلا عجار اذهو اهتيجاتنإ عافترا ىه اريثأ
، ىضرلاا ءاملا بوسنم عافتراو لدابتملا مويدوصلا ةبسن عافتراو ةبرتلا ةحولم ىلاوح امنيب 12.19
% نيسحتل ىلاتلابو اهتيجاتنإ تداز دق ىضارلأا هذه نم
ليلقتل ةيعارزلا ةرادلااب ةيانعلا بجي اهتيجاتنا ةدايزو ىضارلأا هذه صاوخ ن نيسحتو ، ةيولقلا ، ةحولملا فرصلا ماظ