Novel Method of Price Determination based on Reference Price
David Schuller, Jan Pekarek, Vit Chlebovsky, Iveta Simberova
Brno University of Technology
Kolejni 4, 612 00 Brno, Czech Republic
E-mail. [email protected], [email protected], [email protected], [email protected]
http://dx.doi.org/10.5755/j01.ee.29.1.18281
This paper deals with the issue of optimal price determination. Price determination is a matter of high importance in both the academic community and managerial practices. The aim of the paper is to present a novel method of price determination based on reference price. The method presented is inspired by a fuzzy sets graphical interpretation and provides an alternative approach to the standard product price determination problem. It uses the satisfaction of customers as well as product sellers to find the optimal price for particular market. The method is based on two fundamental steps. First the method of product perception for a single customer is developed and then the method for the whole market is derived. The individual changing trend of customers` willingness to pay at each price level constitutes the essence of the method presented. The application of the suggested method is presented via empirical data obtained from the snowboard market. The results have a direct impact on managerial decision-making of the seller in terms of pricing. The resultant price given by the analysis conducted through the suggested method allows sellers to maximize the revenues related to a particular product. Moreover if the seller’s goal is not to maximize revenues, but to achieve maximal market share, the price should be the same as the optimal willingness to pay price. These conclusions are explicitly mentioned in order to demonstrate that the suggested approach allows the definition of custom objectives by the seller.
Keywords: Price Determination; Reference Price; Customer Perception; Willingness to Pay; Utility Function.
Introduction
The aim of the study is to present a novel method of price determination based on reference price. Emphasis is placed on the presentation of the concept that allows companies to maximize their turnover as well as customers to maximize their satisfaction with reference price on the selected market. In terms of the introduction to this issue, the theoretical background is provided.
Price is the main driver of customer behaviour and the main component of brand management. Price can either make a brand profitable or damage it (Salamandic et al., 2014) The level of price primarily gives information about the product quality and incorrect price-setting can cause a producer significant losses. Objectively, the evaluation of a product's quality depends on the market environment, taking into account certain demand factors like physical, aesthetic quality and price (Stunguriene, 2010).
From the customer point of view, the price reflects their expectations of product performance (Mattila et al., 2003). Customers see the price level as a cue in evaluating their experience with a product and the price influences their attitude to a supplier (Varki et al., 2001).
The seller may affect consumer perceptions about the price of a product and change consumer behaviour through its marketing decisions (Banyte et al., 2016). However, customers in their assessment compare if the price they should pay for a product is reasonable and acceptable in connection with the costs that sellers or producers have to pay to make a product (Bolton et al., 2003). If customers think that producers or sellers increase the price of a product to just make a higher profit and no additional costs where needed, they will consider the new, higher price as unfair (Frey et al., 1993).
Customers which perceive a brand they are unaware of as being too expensive end up never buying it, while if the price is too low it raises suspicion about the product quality (Salamandic et al., 2014). In addition, consumers react differently to price changes. Some of them are more price sensitive than others.
Reference Price
Price can be defined as the certain quantity of money given by a customer to a supplier in return for a provided product (Schindler, 2012). The price can be distinguished as an objective price and a subjective price. The objective price is the actual price for the product sold while the subjective price reflecting the customer’s perception of the adequate price level formed by all their information about and experience relevant to the product. Perception is the process by which people select, organise, and interpret information to form a meaningful picture of the world (Munnukka, 2008). Customers encode the price in ways that are meaningful to them (Zeithaml, 1983).
The subjective price correspondents with the term reference price and can be understood as the norm that serves as a neutral point for comparison, such that prices below it are evaluated as low, e.g. relatively inexpensive, and prices above it are evaluated as high, e.g. relatively expensive (Kalyanaram et al., 1995; Monroe, 2002). A correct setting of the price level is very important because customer price perception has a direct effect on overall customer satisfaction and intention to return (Rosenbloom, 2005).
Frequently reference prices are seen as a predictive price expectation which is created by customers’ prior experience and current purchase environment (Briesch et al., 1997). The reference price is based on consumers’ memory or contextual information. A similar term for reference prices in the relevant literature are, for instance, “perceived price” or “evoked price” (Rao, 1984). It is generally accepted that consumers compare a market price to an internal reference price when judging the attractiveness of the market price (Janiszewski et al., 1999).
In marketing, the perceived price or reference price is accepted as an empirical generalization (Kalyanaram et al., 1995). There is evidence from a marketing and economic perspective that, from the customer point of view, price is a complex construct which is multidimensional in nature and not composed of only one factor. Perceived prices are dynamic and fluctuate over time (Winer, 1986).
In theory, the reference price point is also seen as normative. A normative reference price is perceived by the customer as fair (Bolton et al., 1999).The fairness is defined not only by competitive prices but also by consumers’ assessment of the company's’ costs and what is regarded to be a normal profit (Bolton et al., 2003).
The other conceptualization focuses on an aspirational standard where the aspiration-based reference price is determined by the amount of money which others in a social group pay for the same or similar product. (Mezias et al., 2002).
The perception of price is important as it represents an extrinsic cue and provides one of the most significant kinds of information available to consumers within a shopping decision-making process (Wangenheim et al., 2007); (Ralston, 2003). The purchase motivation is connected with intrinsic, extrinsic or vs altruistic context. Consumers use more intrinsic motivation in private sphere. On the other hand, extrinsic and altruistic in public sphere (Roy et al., 2016). The reference price point is closely connected with the product quality and value for a customer (Hardie et al.,1993). Value in this context can be defined as a consumer's perception of value in the acquisition and use of products and services in all industrial branches. A perceived value is a cognitive calculation that examines the quality of an organisation's products and services in terms of a competitive context and puts this quality in relation to the price that a consumer has to pay to gain this quality (Reidenbach et al., 2006). Additional research by Monroe (2002) provides one of the most frequent definitions for the reference price in connection with the quality. It is the ratio between quality and price, hence representing a value for money conceptualization.
Methods using Reference Prices
Reference price has been repeatedly identified as the key driver for successful management (Ingenbleek, 2007; Hinterhuber, 2008). One of the most crucial elements in reference price theory is the proper measurement of customers’ willingness to pay (WTP). WTP is influenced by customer satisfaction - the maximum price level which customers are willing to pay before switching to a competitor’s product (Anderson, 1994). The strong correlation between customer satisfaction and WTP is
important as the price is the key element in the profit equation (Homburg et al., 2005).
The precise measurement of the customers’ willingness to pay is the cue factor in value pricing theory. In this context, conjoint analysis achieved its place in research papers (Volckner, et al., 2008; Iyengar et al., 2008; Sichtmann et al., 2015). Conjoint techniques allow customer preference structures to be measured through variations of product attributes as an experiment. A customer is presented with a number of product profiles which consists of depictions of the product’s attributes and arranges them on the basis of their preference. For instance, it is possible to indicate a rank order according to the level of preference. Combination of reference price and friend`s references help consumers to develop positive deal evaluation and influences their preferences. (Lo et al., 2017).
Auctions have also received a great deal of attention in academic research (Sattler et al., 2003; Noussair et al., 2004). Auctions can be carried out as a laboratory or field experiment. A special application of experiments are auctions which can be carried out as laboratory or field. An auction can help to sell the product at a fair price level if a seller is uncertain about customers’ perceived value of the product.
Dynamic pricing modelling is very strong tool in modern methods. In this modelling the demand at each period depends on past prices via reference prices with the current price (Chen et al., 2016).
However, in practice, the Price Sensitivity Meter from Van Westendorp (1976) is a very popular approach to setting a fair price. Van Westendorp worked out the price sensitive measurement (PSM) method, which has been widely used to this day in various industries and sectors, in 1976. For example, the PSM method was used in the food industry to estimate how customers perceive the price of Cheddar cheese (Kupiec et al., 2001). It is significant to use appropriate strategy connected with reference price. It is worth avoiding under-pricing new products and services (Crompton, 2015). The price sensitive measurement method was also proved to be accurate and effective in the hospitality industry as well (Carola et al., 2009) or, for instance, in the information and communication technology industry where affordable and efficient ways of evaluating customer expectations have to be applied (Harmon et al., 2003). Comparison of the PSM effectiveness for new versus established brands revealed that PSM is more effective in the early stage of a brand’s life-cycle (Salamandic et at., 2015).
The Price Sensitivity Meter contains four questions for potential customers to find out their willingness to pay. The advantage of these questions is their clear and logical formulation and it is easy to use these questions with those questions found in Weiner (2001) and Muller, (2009). The formulations of the questions according to Westendorp (1976) are:
● At what price would you consider the product to be so expensive that you would not consider buying it? (Too expensive);
● At what price would you consider the product to be priced so low that you would feel the quality couldn’t be very good? (Too cheap);
to get expensive, so that it is not out of the question, but you would have to give some thought to buying it? (Expensive);
● At what price would you consider the product to be a bargain - a great buy for the money? (Cheap/Good Value).
On the basis of the questions raised, two declining and two increasing distribution functions are used. The relative cumulative frequencies create the price curves based on the customers` responses and the curves indicate which price level customers perceive as cheap, expensive, too cheap and too expensive. This method has a lot of advantages, such as its ease of use or its low cost (Hofmann et al., 2006; Wildner, 2003). Moreover, the analysis can be carried out with standard computer software and the interpretation of results is very easy and straightforward. However, the weak point of this method is the lack of mathematical and theoretical background (Muller, 2009). The interpretation of the PSM method is defined by the intersections of different cumulative frequency curves, but it is not really clear why those intersections explain and set the proper price level. For instance, why a price level which is derived from the same number of responses as expensive and cheap is the optimal price for a product (Muller, 2009; Roll et al., 2010).
Furthermore, the PSM-based price is not connected with the main goals of a company such as revenue or profit (Wildner, 2003). Each company has to maximize its revenues or profits on the basis of economic theory, but the results of price sensitivity do not provide such outputs. Hofmann et al., (2006 and Roll et al. (2010) argue that the PSM method is not able to justify recommended prices from a mathematical and economic perspective. The PSM technique can be efficient only in the initial stages and has to be complemented in advanced stages by more metrical methods.
Furthermore, we argue that the PSM method does not take into account the individual changing trend of customers` willingness to pay at each price level, because it works only with extreme values: (cheapness, extreme cheapness, expensiveness, extreme expensiveness). Therefore, the main purpose is to develop a novel method that will be based on a sufficient economic and mathematical background. Additionally, a novel method will use a simple set of questions for consumers which will be at least as easy as the set of questions applied in PSM analysis. Our novel method will be closely connected with the seller's main economic goal which is to maximize revenue or profit.
The Method
Fuzzy
Sets
Interpretation
of
Customer
Perception of a Product
In order to provide an alternative approach for the description of price sensitivity perception we developed an interpretation method inspired by principles of fuzzy sets. The method does not use the fuzzy sets theory or fuzzy logic theory themselves, it only exploits some of their terms and descriptive tools, namely graphical interpretation of fuzzy membership function
𝜇
. Similar results, however, could have been achieved by standard mathematical analysis if dedicated functions were defined.The introduction to the new approach consists of two steps. First the method of product perception for single
customer is developed. Then the method for the whole market is derived.
Reference Price
We use the term “reference price” how it is perceived by Monroe (1976) and also by Briesch (1997). The reference price is a predictive price expectation which is created by customers’ prior experience and the current purchase environment. The reference price is based on consumers’ memory or contextual information. The reference price in this context is the ideal amount of money that a customer would expect to pay for a concrete product.
Very important for the purposes of this paper is the strong correlation between the term “willingness to pay” and customer satisfaction (Homburg et al., 2005). In this context WTP is influenced by customer satisfaction - the maximum price level which customers are willing to pay before switching to a competitor’s product (Anderson, 1994).
Underpriced Goods
We follow the work of Dutch economists Westendorp (1976) and Travers (1983) who developed the price concept based on price threshold. This concept is related to the level of customer price resistance over a range of prices in connection with the consumer’ perception of value. The fundamental principle is the determination of both threshold price range and stress price level (Lewis & Shoemaker, 2006). The threshold range of acceptable prices works with the lowest price and the highest price. The lowest price is defined as the one below which the customer doubts the quality of the product. On this fundamental principle is based PSM method which is used in many research papers and studies (Carola, 2009; Jong et al., 2014; Salamandic et al., 2015; Gengler et al., 2017).
Product Utility
We look at the term product utility from a market point of view, namely that we consider a customer’s practical behaviour when they approach a particular product (primarily on the B2C market). We say that the customer has an idea about the product’s utility. It means that they are equipped with a set of factual knowledge, assumptions and feelings about the product and its practical use. Although this idea can be hard to directly quantify, in a typical situation the customer expects that in order to obtain this product, they will have to exchange it for an object of equivalent value, usually money. The amount of money they expect to give up is the reference price. In this sense the product utility and the reference price correspond to each other. If the product`s utility change, it will influence the product utility perceived by a customer. Subsequently the change of the perceived product utility will influence the reference price of the customer.
Price
Our Method and Approach of Microeconomics
When neoclassical microeconomics attempts to solve a problem of this sort, the usual approach is to take the product as a single, fixed, very specific exemplar of the goods, i.e. a specific brand, its composition and colour, which is sold in a specific retail shop etc. A micro-economist thinks (because the theory forces him to) of the product not only as a snowboard, or a mobile phone, but the “XY-123 type, red-coloured snowboard with such and such length, width etc. Then, the micro-economist examines, how a customer tends to buy this particular product, while its price is being changed. If they haven’t done so, if they took any snowboard, it would be much more complicated for them to predict what happens, when comparing an expensive, high quality type of snowboard with a cheap, low quality type. Here, an attempt to solve the problem by assigning a good type for each example might take place. The fate of an expensive snowboard would be explained by using a superior good type and for the cheap one an inferior good type would be used. But this only makes the analysis more complicated and ambiguous. A retailer needs to find out how likely the customer (a specific one) is to buy a snowboard from their shop. But the retailer doesn’t know which one and, presumably, the customer doesn’t know it up front either. Microeconomics suggests the customer will estimate their approach to the snowboard exemplar by looking at its quality, estimating if it’s a good type from the quality, and then decide, based on the price, if the exemplar is worth buying, or not. But here comes the main idea of the paper. The customer can realistically do this only with a pair of snowboards. It is impossible for him to do for say 30 different types, because (𝑛 − 1)2 comparisons would be necessary. But the customer can very easily narrow down the amount of different types taken into consideration. They can do it by filtering out “inappropriate” types a priori to break down the total amount to 2 or 3, which then can be examined in detail. But how are the snowboards marked as “inappropriate”? How can this be quickly achievable in practice? For the customer in a retail shop, the most striking information is usually the price tag. The customer can look at it and rationally assume, that the price reflects it being a good type, or even the overall quality of the product, very well. And this is usually true, because a typical exemplar of a luxury goods type is usually much more expensive than a typical exemplar of an inferior goods type. This is of course extremely goods-specific, Customers assessing snowboards will take different assumptions than the same customers assessing tablespoons. But the customer, making this assumption, immediately knows from the price which quality type they are dealing with. And here we clearly see the problem. In microeconomics, a person’s ideal price is estimated based on the quality of the product. In real-world retail experience, a customer assumes the product quality from its price, due to their inability to assess all the information about the product quality for the many products available for them.
In other words, at every purchase a customer faces decision making problem to choose between available product alternatives. The product is usually characterized by extensive list of parameters, which may or may not be all known to a customer. If a customer is to consciously decide
between different alternatives of the product, they have to bear in mind all relevant parametric dimensions of the product as well as specific values belonging to individual alternatives of it. Even if we admit that they are fully able to do so, we probably have to also admit, that they are not doing it regularly during ordinary shopping. We therefore propose, that the quite rapid conclusion comes from the knowledge of exemplars’ prices, which in conjunction with customer’s familiarity with the market allow to decide on the basis of their ideal price or rather the distance to it from different product exemplars.
It is very much possible to compare these concepts to H. Simon’s work on bounded rationality, namely his proposed reasoning shortcuts in decision making processes. A customer in our examples has indeed some degree of bounded scope of interest. They are not able or are not willing to grasp the whole set of parameters to be properly able to distinguish between a product exemplar and its alternatives.
The method we are describing is therefore significantly different from the customer’s demand function. The main difference is that our willingness function doesn’t need to be monotonically decreasing with respect to price. It is possible that the product, offered to a customer for a lower price, can be less likely to be purchased than the product offered for a higher price. And this is because of the customer’s initial filtering, which results in the behaviour observed by Monroe (1976), Briesch (1997) and Anderson (1994).
Single Customer Solution
To determine the optimal pricing for a single customer it is necessary to consider his emotional opinion about the product (the rate of his affection or resentment in relation to the product), but it is also necessary to consider the other side’s view – the seller of the product and its objectives, such as the total amount of revenue from a particular product or its market share. The customer’s opinion about the product is reflected in their willingness to pay for the product. Changing the price of the product does not change its utility for the customer, it only changes their willingness to pay for it. But since the goal of the market pricing is to set the optimal price for a particular product, the utility of the product for the customer is constant in our considerations. The willingness to pay for a particular product therefore can be considered as a function of the price.
As has been said earlier, the product does not appear on the market by itself. It is placed there by the seller, whose intention is to satisfy (maximize) their objective function, such as total revenue function. The price shall be set, from their point of view, in such a way that their revenue function reaches the maximum. And since we first consider one sole customer and one product, the quantity of the product along with its price cannot be taken into account, because there is either one product purchased or none. At this point the concept of willingness to pay is useful, because we can use it to extend the border values: one-purchased-product/none-purchased-product to the continuous function, where the rate of willingness to pay is considered. We use the maximization of revenue in the suggested method.
PSM by Westendorp (1976).
● At what price is the product so expensive that you would not consider buying it?
● At what price is the product so low that you would not buy it due to your feeling of bad quality?
We formulated a new question on the basis of the reference price theory, where the perceived quality-price ratio of the product by customer is the key factor in setting a fair price (Monroe, 2002; Reidenbach et al., 2006; Bolton et al., 2003). With this reference we formulated a more direct question to find out the ideal price of the product for a customer. ● What is the ideal price of the presented product?
In terms of the two previous questions, the respondents know exactly what are they asked about – the price, which is most convenient for them, not too high and not too low. These questions provide three basic price points for each customer: ● 𝑀 is the most convenient price and it can be identified with the reference price. Customers expect to pay this amount of money for this product.
● 𝐿 is the lowest feasible price in terms of their product utility value expectation. They would consider a lower price as inappropriate in relation to the expected utility value of the product, which could lead them to become suspicious about the product quality (Westendorp, 1976). ● 𝑈 is the highest feasible price in terms of their product
utility value expectation. A higher price would imply for them unfeasible utility/price ratio, since their utility expectations of the product (reference price) are constant, but the price is too high.
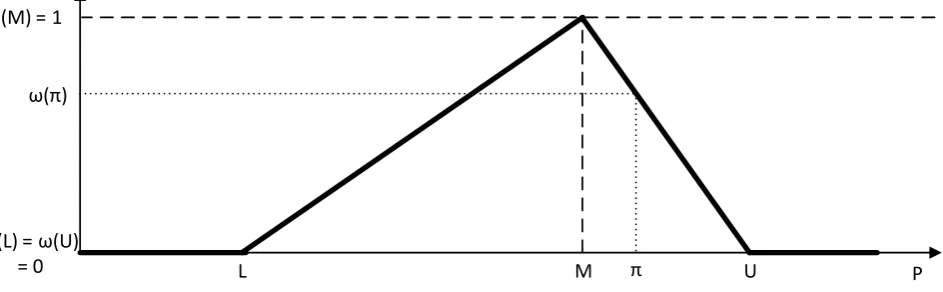
In order to model these points a graphical representation inspired by a fuzzy sets representation is developed in figure 1. The figure shows a customer’s willingness to purchase the product for three prices from above as well as for all prices obtained as a linear continuation of these points. The final willingness function describes how the customer reacts to the price in terms of their willingness to pay for the particular product.
L M U
ω(M) = 1
ω(L) = ω(U)
= 0 P
ω(π)
π
Figure 1. Graphical Representation of Willingness-to-Purchase Function
(Source: Authors)
The shape of 𝜔(𝑃) does not need to necessarily be triangular.This basic triangular type is considered to be the best prototype for modelling choice if no additional information about customer behaviour is available, because line segments are the shortest and the simplest way to connect pairs of distinct points. If there is information only about three points (prices), which should represent the customer’s behaviour, a linear continuation is sufficient for completion of the function without making any unsubstantiated assumptions.
Graphical representation allows us to describe the customer and seller intentions. When the question of optimal price is set, there are two vantage points. From the definition of willingness function 𝜔(𝑃) it is clear that the customer wants the most convenient price, which is 𝑀. This is clear because they explicitly state it, therefore this identity can be considered to be true. The seller’s point of view may however be different, but not necessarily. The seller wants the price which brings them the highest amount of “potential revenue”. Potential revenue is revenue obtained if the product is purchased by the customer with respect to the uncertainty of the purchase. Therefore, the potential revenue can be identified with the customer value. In these terms, the goal of the seller is to maximize the customer value 𝑣𝑖 of the single customer 𝑝𝑖 with respect to the price according to Eq. 1.
𝑣𝑖= 𝑝𝑖𝜔𝑖 Eq. 1
𝑣𝑖 – individual customer value of 𝑖-th customer (potential revenue of customer’s successful purchase)
𝑒𝑣 – modified price elasticity, only applicable for a single customer and their 〈𝑀, 𝑈〉 price interval; 𝑒𝑣~𝑣𝑖 for that case
𝑛 – number of customers (respondents) 𝑝𝑖 – price of the product for 𝑖-th customer 𝑝𝑜 – optimal product price
𝜔𝑖 – willingness to purchase the product by 𝑖-th customer 𝑃 – price of the product
𝐿, 𝑀, 𝑈 – significant price levels
𝑉𝑚𝑎𝑥1 – maximal customer value of all customers for given optimal price 𝑝𝑜 (1 segment case)
A few remarks about the possible outcomes of this kind of analysis: Let us divide the domain of function 𝜔(𝑃) into three intervals if 0 < 𝐿 < 𝑀 < 𝑈
:
● 𝑃 ∈ ⟨0, 𝐿) ∪ (𝑈, ∞), where 𝜔(𝑃) is constant and equal to 0.
● 𝑃 ∈ ⟨𝐿, 𝑀), where 𝜔(𝑃) is monotonically increasing and 𝜔(𝑃) ∈ ⟨0,1)..
● 𝑃 ∈ 〈𝑀, 𝑈〉, where 𝜔(𝑃) is monotonically decreasing and 𝜔(𝑃) ∈ 〈0,1〉.
value 𝑣 monotonically rise). It follows that the optimal price within the interval ad 2 ends up in M. The interval ad 3 is the most interesting. Note that when taken alone it can basically be identified with monotonically decreasing customer individual demand for a single product, while the quantity of the product is replaced by a customer’s willingness to pay for one piece of it. Within the interval ad 3 the customer’s tendency is to prefer lower prices instead of higher ones, therefore to tend towards M. However, the seller’s tendency is to maximize 𝑣, which can be done by using a simple economic analysis of total and marginal revenues respectively. The maximum of total revenues can be found using price elasticity of demand. Analogically, the maximum customer value within the interval ad 3 can be
found using eq. 2. 𝑒𝑣(𝑃) =
𝑃 𝜔(𝑃)
𝜔(𝑀) − 𝜔(𝑈)
𝑀 − 𝑈 Eq. 2
If ∃𝑝(𝑝 ∈ 𝑃, 𝑒𝑣(𝑝) = −1) then 𝑃𝑣𝑚𝑎𝑥= 𝑝 , else 𝑃𝑣𝑚𝑎𝑥= 𝑞, 𝑞 ∈ 𝑃, 𝑒𝑣(𝑞) = max ( 𝑒𝑣(𝑃)). This means that either there is an extremal value (maximum) of customer value inside the interval ad 3, or the best customer value price is the same as the customer’s most convenient price 𝑀.
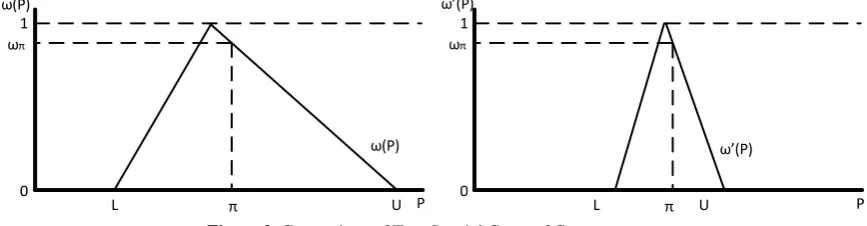
However there is at least one more effect influencing the decision-making process of optimal price determination. Consider the following graphical representation of two different customers which are compared to each other by the seller in terms of their customer value in figure 2.
1
0
L π U
ωπ
ω (P)
P ω (P)
1
0
L π U
ωπ
ω(P)
P ω(P)
Figure 2. Comparison of Two Special Cases of Customers
(Source: Authors)
These two customers have at the price 𝜋 the same willingness to pay
ω
as well as they should have the same customer value for the seller, according to the argumentation so far. But the question is, whether the customer value of these two customers should be equal? This problem contains the possibility of bargaining. If bargaining is not allowed, then the customer value is related only to the particular price 𝜋. Because the price is not allowed to change, any additional effect considering different slopes, shapes or sizes of the function must be equal to zero. However, if bargaining is allowed, then the price is not determined by the seller unambiguously, but it may change. In this case the seller does not compare single price points, i.e. 𝑓(𝑥) for particular 𝑥 ∈ 𝑃, but rather the sizes and shapes of the bargaining space. The bargaining space is the interval of price (and consequently the interval of willingness to pay), within which the price may change. Note that bargaining is not necessarily the same as “marketplace handling”, where the buyer tends towards a lower price and the seller tends towards a higher price. Namely, when the product is complex, assembled from many different modular parts and optional services, the process of bargaining may lead the customer and the seller to follow various strategies. For instance, the customer may bargain for some additional services for a given price, thus the price becomes even higher, or the seller may suggest lowering the price in order to speed up the purchase.In this respect it seems that if bargaining is allowed, then there is indeed a non-zero effect originating in different shapes and sizes of the willingness function. Such an effect should be reflected in the customer value metric. But since this effect occurs only when bargaining is possible, it can appear only when an individual customer approach is practiced by the seller, e.g. in the B2B market. When the
product is strictly homogeneous for all customers or if they are not allowed to bargain, the customer value uses only individual price points and the resulting willingness to pay points. A typical example of this kind of market is the B2C market, which is primarily being examined in this paper.
Whole Market Solution
If we take the B2C market into consideration, some particularities occur. Namely that bargaining is generally not allowed mainly because the amount of necessary transaction costs and also because of the simple fact that most of the goods have one price for all customers. Consequently, the process of price optimizations shifts from single customer optimization done via the elasticity metric to market optimization, which can be done by a numerical optimization algorithm using an aggregate objective function related to all customers altogether. When eq. 1 is applied for all 𝑛 customers on the market, eq. 3a is obtained. However, since the seller sets the same price for all customers, the price variable 𝑝𝑖 does not change for each - i-th customer, but is transformed into an optimized variable 𝑝𝑜 instead. This means that eq. 3b denotes the objective function of mathematical optimization program, whose objective value is to be maximized, where 𝜔𝑖 is i-th customer’s willingness to pay for the product n is number of customers considered, 𝑝𝑜 is the optimal product price and 𝑉𝑚𝑎𝑥1 is total customer value with respect to given price 𝑝𝑜,whose upper index denotes that only one optimal price is considered, therefore, in terms of segmentation, only one segment is considered.
𝑉𝑚𝑎𝑥= ∑ 𝑝𝑖𝜔𝑖 𝑛
𝑖=1
𝑉𝑚𝑎𝑥1 = ∑ 𝑝𝑜𝜔𝑖 𝑛
𝑖=1
Eq. 3b
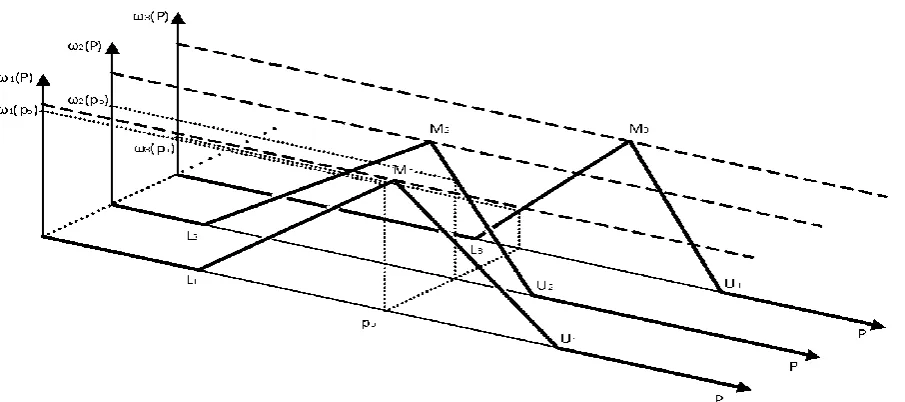
To demonstrate eq. 3b in an original graphical representation, we use an expansion of Figure 1 into the third dimension, which is not necessary, but which clearly shows the interaction between one optimal price
𝑝
𝑜 and individual willingness functions𝜔
𝑖(𝑃)
. Consider three sets of points 𝑆1= {𝐿1, 𝑀1, 𝑈1}, 𝑆2= {𝐿2, 𝑀2, 𝑈2} and𝑆
3=
{𝐿
3, 𝑀
3, 𝑈
3}
related to three customers, which define their personal triangular willingness functions𝜔
1(𝑃)
,𝜔
2(𝑃)
and
𝜔
3(𝑃)
respectively. Since in this case we are dealing with the B2C market with one-price-for-all property, let there be one price𝑝
𝑜, which is meant to be the optimal price, that maximizes eq. 3b. The exact value of𝑝
𝑜 is, however, not initially known and is to be established using the process of optimization. As the value of𝑝
𝑜 changes, it changes all (in this case all 3) individual customer values𝑣
𝑖= 𝜔
𝑖(𝑝
𝑜)
and through them also the total customer value𝑉
1 which is to be maximized as eq. 3b states.Figure 3. Interaction between Individual Willingness Functions and the Optimal Price
(Source: Authors)
Two remarks should be made at this point. Note that in fig. 3 the most convenient prices 𝑀1, 𝑀2 and
𝑀
3 respectively are marked, despite convention, for visualization purposes at the apex of the triangle.Also, although for one customer of one particular product (on the B2B market) the optimization process can be done using price elasticity, for many customers of one particular product (on the B2C market) this procedure is not really suitable. The reason for that comes from the shape of
𝜔
𝑖(𝑃)
and the existence of a single price value for all customers. There are at least two ways that lead to the solution via elasticities. However, they both have obstacles. One can either find the elasticity for all individual willingness functions according to eq. 2 and then find the optimal price which satisfies the elasticity closest to minus one with respect to all customers, or one can aggregate the individual willingness functions into the segment willingness function and find the optimal price via price elasticity of the segment. The first approach has to deal with the indistinguishability of individual elasticity values within any kind of cumulative elasticity metrics. The second approach has to deal with the shape of the segment willingness function, which can be very complicated. None of these arguments claim, that these obstacles are insurmountable. However, the authors want to point out, that for sake of user friendliness, there are easier ways of achieving the right results. Such a method is demonstrated in the following numerical example.Empirical Example
equipment in general, but proper categorization would be necessary, it is possible to take a market of specific type of electronics such as mobile phones, laptops or tablets, but rapid quality development of such devices may distort the customers’ initial perception etc. We believe that it is possible to take any of this middle-ground product market, but at the same time we admit, that each of these markets can have its particularities. This empirical example of snowboard market is thus not the ultimate proof of our theoretical statements but rather an example, on which they can be demonstrated. Further examination of our concepts on other markets is necessary.
Sample Description
The technique of quota sample selection was used so that the sample of respondents could reflect the reality of entire population. The sample was described by the demographic characteristics – age and gender. Respondents were all young people between 18 to 30 years old. The sample was gender balanced when 53 % were men and 47 % women. The research was done on the territory of the Czech Republic.
The first research was conducted at the beginning of the year 2016. The valid respondents were those, who had purchased a snowboard within the previous year, or who had an interest in purchasing one in the immediate future. From 152 respondents only 38 satisfied this condition and their answers form the first, preliminary data set. This data set had been used for method development and debugging.
The follow-up research was conducted later in 2016 and additional 514 people were asked. The answers of 123 respondents were valid and were added to the preliminary data set to form a second, full data set of 161 respondents in total.
Results
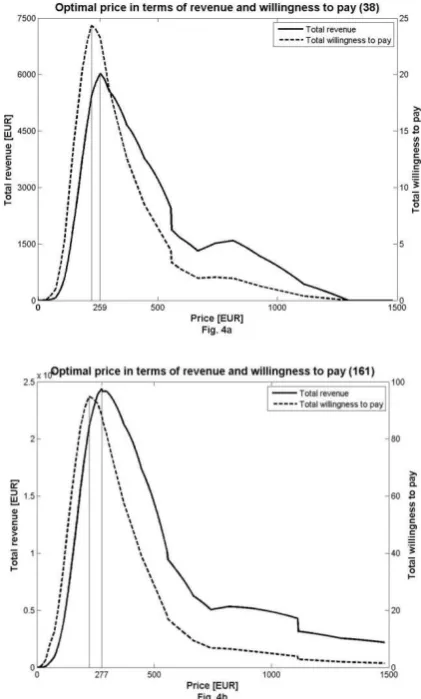
Figures 4a-b shows the graphical results of the analyses. Figure 4a is related to the first data set (marked “38” in the title), figure 4b is related to the second data set (marked “161”). These figures are the main results of optimal price analysis, where two significant prices can be recognized. Both these prices correspond to extreme values (maxima) of either the total willingness function, or the total revenue function. Figure 4a shows that the optimal price in terms of maximal revenues of the seller is 259 EUR, while the optimal price in terms of maximal customer satisfaction (maximal willingness to pay) is 223 EUR. For full data set the results in figure 4b are 277 EUR for the optimal price in terms of maximal revenues and 223 EUR for the optimal price in terms of maximal customer satisfaction (willingness to pay).
Previous chapters dealt with the transition from a single customer case to whole market case optimization and consequent obstacles. Namely optimization via price elasticities of willingness functions has been claimed to be very difficult to handle in the whole market case. The figures show the main reasons for that. The shapes of market willingness functions in figures 4a and 4b are quite unconventional in comparison to standard market demand functions in microeconomics, which are considered to be pre-images to market willingness functions. Therefore such an optimization process based on
𝑒
𝑣(𝑃)
is ambiguous (itresults in more than one optimal price), but the presented approach based on simple maximization of the defined objective function (revenues, willingness to pay, profit etc.) is both clear and user friendly.
These results also have a direct impact on the managerial decision-making of the seller in terms of pricing. In order to maximize the revenues related to a particular product, the price of the product should be the one suggested by the analysis. If the seller’s goal is not to maximize revenues, but to achieve maximal market share, the price should be the same as the optimal willingness to pay price. These obvious conclusions are explicitly mentioned in order to demonstrate that the suggested approach allows the definition of custom objectives by the seller.
Figure 4a-b: Examples of analysis based on the proposed
method
(Source: Authors)
Conclusion
The suggested price determination method is inspired by principles of fuzzy sets and exploits some of their terms and descriptive tools, particularly graphical interpretation of fuzzy membership. The method is developed using two steps. First the method of product perception for a single customer is developed and then the method for the whole market is derived. The individual changing trend of customers` willingness to pay at each price levelconstitutes the essence of the presented method.
The presented method works with the reference price (ideal price in the first question) according to the definition by Monroe (2002). Two other questions are inspired by the Westendorp’s price sensitivity meter.
According to Westendorp (1976), and also other authors, customers tend not to purchase underpriced goods, so the monotonicity of individual demand as well as the monotonicity of market demand is questionable. It may not be the case when discounts are used, but only because a customer perceives the discounted price in relation to the original price. If the information about the original price was removed, the perception of the product would change – the quality of the product would be perceived as a lot lower. This effect supports the idea of a triangular (or otherwise
non-monotone) willingness-to-purchase function.
The results have a direct impact on the managerial decision-making of the seller in terms of pricing. The resulted price given by the analysis conducted through the suggested method allows sellers to maximize the revenues related to a particular product. Moreover, if the seller’s goal is not to maximize revenues, but to achieve maximal market share, the price should be the same as the optimal willingness to pay price. These obvious conclusions are explicitly mentioned in order to demonstrate that the suggested approach allows the definition of custom objectives by the seller. The numerical example of the suggested method is presented via empirical data obtained from the snowboard market.
The topic with the most potential for future research is namely the problem of multiple segment optimization on the B2C market. When multiple optimal prices are allowed, the price optimization process becomes more difficult, but the result of the whole pricing analysis is more precise. Furthermore, it should be beneficial to focus future research on an analysis of product utility evolution over time and also its applicability on different markets. The fact that our method can be demonstrated on our example doesn’t make the method valid for different markets of types of products.
References
Anderson, E. W. (1994). Cross-category variation in customer satisfaction and retention. Marketing letters, 5(1), 19–30. https://doi.org/10.1007/BF00993955
Banyte, J., Rutelione, A., Gadeikiene, A., & Belkeviciute, J. (2016). Expression of Irrationality in Consumer Behaviour: Aspect of Price Perception. Inzinerine Ekonomika-Engineering Economics, 27(3), 334–344. https://doi:/10.5755/j 01.ee.27.3.14318
Bolton, R. N., & Lemon, K. N. (1999). A dynamic model of customers' usage of services: Usage as an antecedent and consequence of satisfaction. Journal of marketing research, 171–186. https://doi.org/10.2307/3152091
Bolton, L. E., Warlop, L., & Alba, J. W. (2003). Consumer perceptions of price (un) fairness. Journal of consumer research, 29(4), 474–491. https://doi.org/10.1086/346244
Briesch, R. A., Krishnamurthi, L., Mazumdar, T., & Raj, S. P. (1997). A comparative analysis of reference price models. Journal of Consumer Research, 24(2), 202–214. https://doi.org/10.1086/209505
Carola, R., Mayer, K., Yen-Soon, K., & Shoemaker, S. (2009). Price-Sensitivity Measurement: a Tool for Restaurant Menu Pricing. Journal of Hospitality & Tourism Research 33, 93–105. https://doi.org/10.1177/1096348008329659
Chen, X., Hu, P., & Hu, Z. (2016). Efficient algorithms for the dynamic pricing problem with reference price effect. Management Science. https://doi.org/10.1287/mnsc.2016.2554
Crompton, J. L. (2015). Reference price based strategies: a key to raising revenues without alienating users. Managing Sport and Leisure, 20(5), 275–292. https://doi.org/10.1080/23750472.2015.1090886
Frey, B. S., & Pommerehne, W. W. (1993). On the fairness of pricing—an empirical survey among the general population. Journal of Economic Behavior & Organization, 20(3), 295–307. https://doi.org/10.1016/0167-2681(93)90027-M
Gengler, C. E., & Mulvey, M. S. (2017). Planning pre-launch positioning: Segmentation via willingness-to-pay and means-end brand differentiators. Journal of Brand Management, 24(3), 230–249. https://doi.org/10.1057/s41262-017-0030-z Hardie, B. G., Johnson, E. J., & Fader, P. S. (1993). Modeling loss aversion and reference dependence effects on brand choice.
Marketing science, 12(4), 378–394. https://doi.org/10.1287/mksc.12.4.378
Hinterhuber, A. (2008). Customer value-based pricing strategies: why companies resist. Journal of business strategy, 29(4), 41–50. https://doi.org/10.1108/02756660810887079
Hofmann, T., Lederle, D., & Felsch, M. (2006). Innovative Verfahren der empirischen Preisforschung. Planung und Analyse, (6), 28.
Homburg, C., Koschate, N., & Hoyer, W. D. (2005). Do satisfied customers really pay more? A study of the relationship between customer satisfaction and willingness to pay. Journal of Marketing, 69(2), 84–96. https://doi.org/10.1509/ jmkg.69.2.84.60760
Ingenbleek, P. (2007). Value-informed pricing in its organizational context: literature review, conceptual framework, and directions for future research. Journal of Product & Brand Management, 16(7), 441–458. https://doi.org/10.1108/1 0610420710834904
Iyengar, R., Jedidi, K., & Kohli, R. (2008). A conjoint approach to multipart pricing. Journal of Marketing Research, 45(2), 195–210. https://doi.org/10.1509/jmkr.45.2.195
Janiszewski, C., & Lichtenstein, D. R. (1999). A range theory account of price perception. Journal of Consumer Research, 25(4), 353–368. https://doi.org/10.1086/209544
Jiang, P., & Rosenbloom, B. (2005). Customer intention to return online: price perception, attribute-level performance, and satisfaction unfolding over time. European Journal of Marketing, 39(1/2), 150–174. https://doi.org/10.1108/0309 0560510572061
Jong, J. C., Lai, Y. C., Wang, S. W., & Huang, S. H. (2014). Development of Rail Service Sensitivity Meter. Transportation Research Record: Journal of the Transportation Research Board, (2417), 10–17. https://doi.org/10.3141/2417-02
Lo, L. Y. S., Lo, & Lin, S. W. (2017). An approach to initiating eWOM intentions: A study on the effects of reference price and value homophily. Internet Research, 27(2), 277–302. https://doi.org/10.1108/IntR-05-2015-0132
Kalyanaram, G., & Little, J. D. (1994). An empirical analysis of latitude of price acceptance in consumer package goods. Journal of consumer research, 21(3), 408–418. https://doi.org/10.1086/209407
Hunt, K. A., & Secor, W. (2013). A Business Case Analysis Of The Snowboarding Industry. Journal of Business Case Studies (Online), 9(2), 111. https://doi.org/10.19030/jbcs.v9i2.7696
Kupiec, B., & Revell, B. (2001). Measuring consumer quality judgements.British Food Journal, 103(1), 7–22. https://doi.org/10.1108/00070700110382911
Mattila, A. S., & O'Neill, J. W. (2003). Relationships between hotel room pricing, occupancy, and guest satisfaction: A longitudinal case of a midscale hotel in the United States. Journal of Hospitality & Tourism Research, 27(3), 328–341. https://doi.org/10.1177/1096348003252361
Mezias, S. J., Chen, Y. R., & Murphy, P. R. (2002). Aspiration-level adaptation in an American financial services organization: A field study. Management Science, 48(10), 1285–1300. https://doi.org/10.1287/mnsc.48.10.1285.277
Monroe, K. B. (1973). Buyers' subjective perceptions of price. Journal of marketing research, 70–80. https://doi.org/10.2 307/3149411
Monroe, K. B. (2002). Pricing: Making Profitable Decisions, 3rd (Ed.) New York.NY: McGraw-Hill Book Company. Munnukka, J. (2008). Customers' purchase intentions as a reflection of price perception. Journal of Product & Brand
Management, 17(3), 188–196. https://doi.org/10.1108/10610420810875106
Muller, H. (2009). Empirische Untersuchung zur Messung der Preiswahrnehmung mittels Pricesensitivity-Meter. Marketing ZfP, 31(3), 171–182. https://doi.org/10.15358/0344-1369-2009-3-171
Noussair, C., Robin, S., & Ruffieux, B. (2004). Revealing consumers' willingness-to-pay: A comparison of the BDM mechanism and the Vickrey auction. Journal of economic psychology, 25(6), 725–741. https://doi.org/10.1016/j. joep.2003.06.004
Roy, R., Rabbanee, F. K., & Sharma, P. (2016). Exploring the interactions among external reference price, social visibility and purchase motivation in pay-what-you-want pricing. European Journal of Marketing, 50(5/6), 816–837. https://doi.org/10.1108/EJM-10-2014-0609
Ralston, R. W. (2003). The effects of customer service, branding, and price on the perceived value of local telephone service. Journal of Business Research,56(3), 201-213. https://doi.org/10.1016/S0148-2963(01)00221-1
Reidenbach, R. E., & Goeke, R. W. (2006). Value-driven channel strategy: extending the Lean approach. ASQ Quality Press. Roll, O., Achterberg, L. H., & Herbert, K. G. (2010). Innovative approaches to analyzing the Price Sensitivity Meter: Results
of an international comparative study. Laurea Publications A• 72, 181.
Salamandic, E., Alijosiene, S., & Gudonaviciene, R. (2014). Price Sensitivity Measurement Depending on Brand Awareness: A Case of Ziede Brand.Procedia-Social and Behavioral Sciences, 156, 473–478. https://doi.org/10.1016/ j.sbspro.2014.11.224
Salamandic, E., Alijosiene, S., & Gudonaviciene, R. (2015). Comparing the Price Sensitivity Measurement Effectiveness for New vs. Established brands. Trends Economics and Management, 9(22), 38–46.
Sattler, H., & Nitschke, T. (2003). Ein empirischer Vergleich von Instrumenten zur Erhebung von Zahlungsbereitschaften. Schmalenbachs Zeitschrift Fur Betriebswirtschaftliche Forschung Schmalenbachs Z Betriebswirtsch Forsch, 55(4), 364– 381. https://doi.org/10.1007/BF03372709
Shoemaker, S., Lewis, R., & Yesawich, P. (2006). Marketing leadership in hospitality and tourism. Upper Saddle River, NJ: Prentice Hall.
Schindler, R. (2012). Pricing strategies: A marketing approach. Thousand Oaks, CA: Sage Publications.
Sichtmann, C., & Wilken, R. (2015). Factors Influencing the Validity of Measuring Willingness-to-Pay with Choice-Based Conjoint Analysis. In Proceedings of the 2008 Academy of Marketing Science (AMS) Annual Conference (pp. 32–32). Springer, Cham. https://doi.org/10.1007/978-3-319-10963-3_11
Stunguriene, S. (2010). Optimization of the Ratio of the Bank Payment Cards Price and Quality. Inzinerine Ekonomika-Engineering Economics, 21(1), 12–18.
Subic, A., Clifton, P., & Beneyto‐Ferre, J. (2008). Identification of innovation opportunities for snowboard design through benchmarking. Sports Technology, 1(1), 65–75. https://doi.org/10.1002/jst.2
Travers, K. (1983). PSM: A new technique for determining consumer sensitivity to pricing. Los Angeles: Plog Research. Varki, S., & Colgate, M. (2001). The Role of Price Perceptions in an Integrated Model of Behavioral Intentions. Journal of
Service Research, 3(3), 232–240. https://doi.org/10.1177/109467050133004
Volckner, F., Sattler, H., & Teichert, T. (2008). Wahlbasierte Verfahren der Conjoint-Analyse. Handbuch Marktforschung: Methoden–Anwendungen–Praxisbeispiele, 3, 687–712.
Wangenheim, F. V., & Bayon, T. (2007). Behavioral consequences of overbooking service capacity. Journal of Marketing, 71(4), 36–47. https://doi.org/10.1509/jmkg.71.4.36
Westendorp, P. H. V. (1976). NSS Pricesensitivity-Meter (PSM)–A new Approach to study Consumer Perception of Prices. In Paper for 25th Esomar Congress, Venice, (pp. 0071–3082).
Weiner, J. L. (2001). Applied Pricing Research. In Sawtooth Software Conference (p. 111).
Wildner, R. (2003). Marktforschung fur den Preis. Jahrbuch der Absatz-und Verbrauchsforschung, 49(1), 4–26.
Winer, R. S. (1986). A Reference Price Model of Brand Choice for Frequently Purchased Products. J CONSUM RES Journal of Consumer Research, 13(2), 250. https://doi.org/10.1086/209064
Zeithaml, V. A. (1983). Conceptualizing and measuring consumer response to price. In R. P. Bagozzi & A. M. Tybout (Eds.), Advances in consumer research (pp. 612–616). Ann Arbor, MI: Association for Consumer Research