www.biogeosciences.net/11/915/2014/ doi:10.5194/bg-11-915-2014
© Author(s) 2014. CC Attribution 3.0 License.
Biogeosciences
Modelling microbial exchanges between forms of soil nitrogen in
contrasting ecosystems
M. Pansu1, D. Machado2, P. Bottner3, and L. Sarmiento4
1IRD, UMR Eco&Sol (Supagro, Cirad, Inra, IRD), Place Viala, Montpellier, France
2Laboratorio de Investigación en Análisis Químico Industrial y Agropecuario, Departamento de Química. Facultad de Ciencias, Universidad de los Andes, Mérida, Venezuela
3CEFE-CNRS, Montpellier, France
4Instituto de Ciencias Ambientales y Ecológicas, Facultad de Ciencias, Universidad de los Andes, Mérida, Venezuela
Correspondence to: M. Pansu ([email protected])
Received: 16 January 2013 – Published in Biogeosciences Discuss.: 25 March 2013 Revised: 15 November 2013 – Accepted: 6 January 2014 – Published: 20 February 2014
Abstract. Although nitrogen (N) is often combined with car-bon (C) in organic molecules, C passes from the air to the soil through plant photosynthesis, whereas N passes from the soil to plants through a chain of microbial conversions. However, dynamic models do not fully consider the microor-ganisms at the centre of exchange processes between organic and mineral forms of N. This study monitored the transfer of 14C and15N between plant materials, microorganisms, hu-mified compartments, and inorganic forms in six very differ-ent ecosystems along an altitudinal transect. The microbial conversions of the15N forms appear to be strongly linked to the previously modelled C cycle, and the same equations and parameters can be used to model both C and N cycles. The only difference is in the modelling of the flows between mi-crobial and inorganic forms. The processes of mineralization and immobilization of N appear to be regulated by a two-way microbial exchange depending on the C : N ratios of microor-ganisms and available substrates. The MOMOS (Modelling of Organic Matter of Soils) model has already been validated for the C cycle and also appears to be valid for the prediction of microbial transformations of N forms. This study shows that the hypothesis of microbial homeostasis can give robust predictions at global scale. However, the microbial popula-tions did not appear to always be independent of the exter-nal constraints. At some altitudes their C : N ratio could be better modelled as decreasing during incubation and increas-ing with increasincreas-ing C storage in cold conditions. The ratio of potentially mineralizable-15N/inorganic-15N and the15N stock in the plant debris and the microorganisms was
mod-elled as increasing with altitude, whereas the15N storage in stable humus was modelled as decreasing with altitude. This predicts that there is a risk that mineralization of organic re-serves in cold areas may increase global warming.
1 Introduction
mechanisms, the types of models available have changed; in 1970, 60 % were SIMP and 40 % were MIT, whereas in 2010, 5 % were SIMP, 7 % were MIT, 5 % were MIX, 17 % were PAR, and 66 % were DIR.
Organic N transformations have often been modelled by considering C compartments with different C : N ratios (e.g. van Veen and Ladd, 1985; Parton et al., 1987; Bradbury et al., 1993; Carter et al., 1993; Dou and Fox, 1995; Quemada and Cabrera, 1995; Richter and Benbi, 1996; Franko, 1996; Mueller et al., 1998; Garnier et al., 2001; Nicolardot et al., 2001; Pansu et al., 2003; 2004; Neill and Gignoux, 2006) but Treseder et al. (2011) called for a better integration of microbial ecology in ecosystem models, and Todd-Brown et al. (2012) considered that “current global models do not represent direct microbial control over decomposition” and called for a new generation of models. An important as-pect concerns the stoichiometry of decomposers (Sterner and Elser, 2002). Microbial biomass (MB) has often been consid-ered homeostatic, i.e. with a composition independent of that of the substrates used, implying that assumptions are made to maintain a constant MB C : N ratio. However, other models and experimental data (e.g. Wallander et al., 2003; Bottner et al., 2006) allow the C : N ratio of MB to change with time in response to the substrate C : N ratio and changes in the mi-crobial communities during decomposition.
This study considers N dynamics along an altitudinal tran-sect that had previously been used to validate the modelling of the microbial transformations of carbon forms (MOMOS-C model, Pansu et al., 2010). The aim was to predict the con-version of the15N-labelled forms and the conversion of14 C-labelled forms simultaneously. This raised questions about the validity of the extensions to the model for the N cycle. Can the rates of direct enzymatic C and N assimilation be considered to be the same (as in the DIR scheme)? Can the transfers of C by microbial mortality and respiration cause simultaneous transfers of N into labile humus and inorganic forms to balance the MB C : N ratio? Can the assimilation of inorganic N be modelled to sustain microbial activity (MIT scheme) in the case of an N deficit during conversion of organic forms? Can microorganisms be assumed to assimi-late N from labile and stable organic molecules as well as N from the inorganic N pool in realistic modelling of the PAR scheme?
This study also aimed to answer questions about the home-ostasis of microorganisms and the stability of the15N stor-age. Is the microbial14C :15N ratio constant or does it vary during incubation periods in different ecosystems at different altitudes? How does15N storage tend to change with climate in compartments of different stability?
2 Materials and methods
2.1 The experimental sites
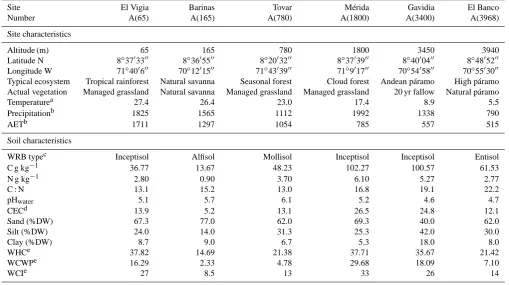
The experiment was carried out at six sites (Table 1) along an altitudinal transect in Venezuela, at 65–3968 m above sea level, covering a large bioclimatic gradient that comprised tropical rainforest (A(65)), natural savanna (A(165)), sea-sonal montane forest (A(780)), cloud forest (A(1800)) and Andean páramo (alpine vegetation) at two heights (A(3400) and A(3968)). The sites are described in previous publica-tions (Couteaux et al., 2002; Pansu et al., 2010). This al-titudinal transect was characterized by contrasting temper-ature, annual precipitation and its seasonal distribution and soil characteristics. The long-term mean annual air tempera-ture ranged from 5.5◦C at A(3968) to 27.4◦C at A(65), the mean annual precipitation ranged from 790 mm at A(3968) to 1992 mm at A(1800). Soils were acidic at all sites, par-ticularly in the two páramo soils. The soils were loamy at A(3400), and were sandy loams at the other sites. The sa-vanna soil at site A(165) contained the highest amount of sand and the lowest amount of organic matter, both wa-ter holding capacity (WHC) and cation exchange capac-ity (CEC) were lower than at any of the other sites. The mountain soils A(1800) and A(3400) contained the highest amounts of fine particles and organic matter and had the highest WHC and CEC. The three other soils had interme-diate WHC and CEC. The carbon content in the 0–10 cm soil layer varied from 13 g (C) kg−1at A(165) to more than 100 g (C) kg−1(soil) at A(1800) and A(3400). The quality of the soil organic matter was also variable, with C : N ratios rang-ing from 13 at A(65) and A(780) through 15 at A(165) up to 17–22 at the highest sites, A(1800) to A(3968).
2.2 Experimental design and data collection
Table 1. Site characteristics.
Site El Vigia Barinas Tovar Mérida Gavidia El Banco
Number A(65) A(165) A(780) A(1800) A(3400) A(3968)
Site characteristics
Altitude (m) 65 165 780 1800 3450 3940
Latitude N 8◦3703300 8◦3605500 8◦2003200 8◦3703900 8◦4000400 8◦4805200 Longitude W 71◦400600 70◦1201500 71◦4303900 71◦901700 70◦5405800 70◦5503000 Typical ecosystem Tropical rainforest Natural savanna Seasonal forest Cloud forest Andean páramo High páramo Actual vegetation Managed grassland Natural savanna Managed grassland Managed grassland 20 yr fallow Natural páramo
Temperaturea 27.4 26.4 23.0 17.4 8.9 5.5
Precipitationb 1825 1565 1112 1992 1338 790
AETb 1711 1297 1054 785 557 515
Soil characteristics
WRB typec Inceptisol Alfisol Mollisol Inceptisol Inceptisol Entisol
C g kg−1 36.77 13.67 48.23 102.27 100.57 61.53
N g kg−1 2.80 0.90 3.70 6.10 5.27 2.77
C : N 13.1 15.2 13.0 16.8 19.1 22.2
pHwater 5.1 5.7 6.1 5.2 4.6 4.7
CECd 13.9 5.2 13.1 26.5 24.8 12.1
Sand (%DW) 67.3 77.0 62.0 69.3 40.0 62.0
Silt (%DW) 24.0 14.0 31.3 25.3 42.0 30.0
Clay (%DW) 8.7 9.0 6.7 5.3 18.0 8.0
WHCe 37.82 14.69 21.38 37.71 35.67 21.42
WCWPe 16.29 2.33 4.78 29.68 18.09 7.10
WCIe 27 8.5 13 33 26 14
along-term annual mean temperature in◦
C;blong-term annual mean precipitation and evapotranspiration (mm);cWorld Reference Basis;dcation exchange capacity mmol (+) kg−1;e water holding capacity, water content at wilting point, and initial water content in soil bags (% DW).
Table 2. Composition of soil in bags buried in 5–10 cm soil layer.
Site g straw/ mg straw C/ mg straw N/ g soil+ mg N g−1 %15N1 %15N
bag1 bag2 bag3 straw/bag1 soil+straw1 exces4
A(65) 1.08 423.36 13.32 189.32 2.88 0.6094 0.2434
A(165) 1.08 423.36 13.32 225.43 0.93 0.8815 0.5155
A(780) 0.84 329.28 10.36 151.31 3.90 0.5347 0.1687
A(1800) 0.84 329.28 10.36 113.11 6.98 0.4964 0.1304
A(3400) 0.48 188.16 5.92 160.97 5.40 0.4310 0.0650
A(3968) 0.48 188.16 5.92 182.69 2.88 0.4857 0.1197
straw C=392 mg g−1; straw N=12.33 mg g−1; straw C : N ratio=31.79;15N natural abundance=0.366 %;1measured values;2g straw×straw C;3g straw×straw N;4 %15N–15N natural abundance.
ground to <5 mm particles. The N and15N composition of the soil in the bags is given in Table 2. The added carbon and nitrogen from the straw ranged from 1.2 % (A(3400)) to 13.8 % (A(165)) of the native C and 0.70 % (A(3400)) to 6.60 % (A(165)) of the native N in the soil.
A total of 40 bags containing the labelled straw and soil were buried 5 cm deep along four parallel lines in each ex-perimental plot (10 samples at different times×4 replicates for each sample at each site, making a total of 240 soil bags). When the plots had been set up (23 November to 6 December 1994), the soil bags were moistened with deionized water to the midpoint between WHC and the water content at wilting
[image:3.595.105.490.419.520.2]The total N was determined using Kjeldahl digestion by boiling subsamples in concentrated sulphuric acid with a potassium sulphate-copper sulphate-grey selenium catalyst for 2 h at 400◦C. The ammonia in the solution was then dis-tilled with sodium hydroxide into a standard H2SO4solution and the excess H2SO4was determined by back titration with a standard NaOH solution. After titration, the distillate was acidified to pH between 3 and 4 to avoid N losses and evap-orated to obtain ammonium sulphate crystals that were anal-ysed for15N abundance using mass spectrometry.
The MB N was determined by fumigation-extraction (Brookes, 1985). After homogenization, a fresh soil sample equivalent to 30 g dry soil was fumigated with alcohol-free chloroform for 18 h. The fumigated sample and an equiva-lent control soil sample were treated with 150 mL of 0.5 mol (K2SO4)L−1 solution for 30 min and centrifuged. The ex-tracts were digested, titrated, crystallized and analysed for 15N, as for the determination of total N. The N-labelled part of the microbial biomass was calculated as the differ-ence between the labelled N in the fumigated and the control samples, corrected by aKN factor of 0.54 (Joergensen and Mueller, 1996). An aliquot of the extracted solution from the unfumigated samples was used to determine the total inor-ganic N and 15N abundance (ammonium and nitrate sepa-rately).
For all compartments (total soil, microbial biomass and mineral nitrogen) the percentage of the N in the samples that had come from the N added in the straw (%Ndff) was calcu-lated as
%Ndff=%Ecomp %Estraw
·100,
where %Ecompis the atom percent excess of the tracer in the compartment and %Estrawis the atom percent excess in the straw. From this, the amount of N from the straw in each compartment was calculated as
mg N=%Ndff·Ntotal
100 ,
where Ntotalis the total N in the sample in mg.
Following the death of our colleague, Pierre Bottner, we recovered most of the experimental data, except the last re-sults for microbial biomass (MB) and inorganic15N, where only the first five results were available for each site.
All15N-labelled data and14C-labelled data (Pansu et al., 2010) are expressed as a fraction of the labelled N and C added at the start of the experiment. As the labelled inor-ganic N in the soil bags was very low compared to the total labelled15N, the total labelled15N was considered to be the labelled organic15N, the difference between the15N added in the straw and the organic15N being the production of in-organic15N which was assumed to have been lost mostly by root uptake, leaching, and gaseous losses through the porous soil bags.
Aboveground and belowground biomass
Aboveground and belowground biomass
Necromass (NC)
CO2
CO2
VS
MB
HL HS
Inorganic Nitrogen Plant exudation Plant mortality
Microbial respiration
Meteorological data
kHL
kHS
kHLS kVL
kMB
kVS
k qrespCO2 Production
module Soil
water module
Soil water Temperature
Soil properties Microbial
mortality
Humus stabilization
NC Quality
VL
R
a
infall
TAO model
N microbial immobilization
N mineralization
[image:4.595.307.549.64.293.2]Critical C:N ratio of MB
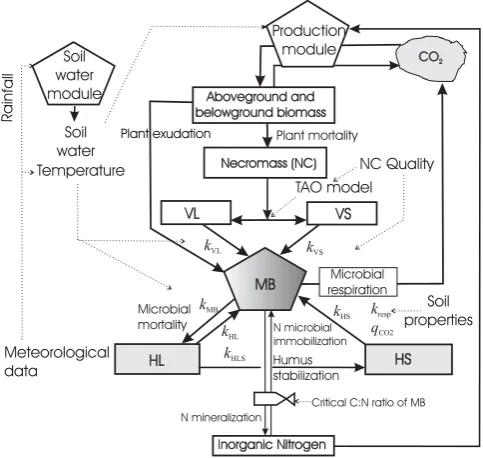
Fig. 1. Flow diagram for the MOMOS model coupled with a soil water module and a production module; MB is the microbial biomass, VL is the labile necromass (NC), VS is the stable necro-mass (NC); HL is the labile humus, HS is the stable humus; see table 3 for meaning of thekparameters.
The soil water content was measured in each soil bag using four 5 g replicates that were dried at 105◦C for 24 h. Other soil analyses were performed using standard methods (Pansu and Gautheyrou, 2006).
2.3 The decomposition model MOMOS
As carbon and nitrogen are closely associated in living organ-isms, it was assumed that the nitrogen cycle could be mod-elled in MOMOS-N in the same way as the carbon cycle in MOMOS-C (Pansu et al., 2004, 2010), using a subscripte
(either C or N) to distinguish between the elements in the model.
MOMOS (Fig. 1) was defined as a five-compartment model centred on the activity of soil microbial biomass (MBe) that grows by assimilation of labile (VLe) and
sta-ble (VSe) fractions of plant necromass (NCe) as well as
la-bile (HLe) and stable (HSe) fractions of humus. The
micro-bial mortality regulates humus formation. The only process which is considered more chemical than biological is the hu-mus stabilization from HLe to HSe, which is in agreement
with observations of Kemmitt et al. (2008). The only differ-ence between the C and N models is in the outputs from MBe
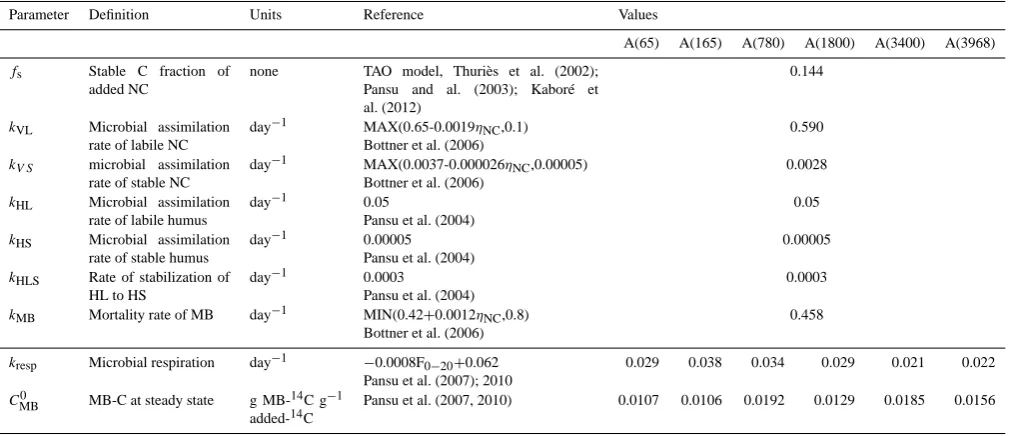
Table 3. Parameter values used in the MOMOS-C model (Pansu et al., 2010) and retained in this N study.
Parameter Definition Units Reference Values
A(65) A(165) A(780) A(1800) A(3400) A(3968)
fs Stable C fraction of added NC
none TAO model, Thuriès et al. (2002); Pansu and al. (2003); Kaboré et al. (2012)
0.144
kVL Microbial assimilation rate of labile NC
day−1 MAX(0.65-0.0019ηNC,0.1)
Bottner et al. (2006)
0.590
kV S microbial assimilation rate of stable NC
day−1 MAX(0.0037-0.000026ηNC,0.00005)
Bottner et al. (2006)
0.0028
kHL Microbial assimilation rate of labile humus
day−1 0.05
Pansu et al. (2004)
0.05
kHS Microbial assimilation rate of stable humus
day−1 0.00005 Pansu et al. (2004)
0.00005
kHLS Rate of stabilization of HL to HS
day−1 0.0003
Pansu et al. (2004)
0.0003
kMB Mortality rate of MB day−1 MIN(0.42+0.0012ηNC,0.8) Bottner et al. (2006)
0.458
kresp Microbial respiration day−1 −0.0008F0−20+0.062
Pansu et al. (2007); 2010
0.029 0.038 0.034 0.029 0.021 0.022
CMB0 MB-C at steady state g MB-14C g−1 added-14C
Pansu et al. (2007, 2010) 0.0107 0.0106 0.0192 0.0129 0.0185 0.0156
MB is microbial biomass, NC is added necromass,ηNCis the NC C : N ratio.
assimilation of organic substrates are the same for C and N (see introduction), we attempted to describe the N cycle for each of the six ecosystems by using the optimal values of pa-rameters previously adjusted for the C cycle (Table 3). All the C and N parameters are linked to soil functions of tem-perature and water content, ranging from 0–1, in the general MOMOS equation:
˙
xe= f (T )f (θ )Aexe+Be, (1)
wherexeis the vector of the state variables (14C or15N
con-tent of the compartments),x˙eis the vector of the derivatives
ofxe, Aeis the model parameter matrix for each organic
ele-ment,Beis a vector determining the external C and N inputs
(see Pansu et al., 2009 for C inputs from living roots;Be=0
for14C and15N-labelled data in this experiment) andf (T )is an exponential function of temperature (Pansu et al., 2010):
f (T )=Q(10T−Topt)/10 (2)
where T is the actual daily temperature of soil (0–10 cm layer) set equal to the air temperature;Topt is the optimum decomposition temperature, set to 28◦C (a temperature often used to perform laboratory experiments under optimum con-ditions; Thuriès et al., 2002), just above the mean annual tem-perature of the warmer sites A(65) and A(165) of this study;
Q10is the factor by which the rate increases with a 10◦C in-crease in temperature (this was set to 2.2 for all sites for this study; see discussion in Pansu et al., 2010); andf (θ )is the response function to soil moisture expressed as a fraction of the WHC (Table 1, see discussion in Pansu et al., 2010):
f (θ )=MIN
θ
WHC,1
. (3)
The soil water content,θ, was predicted using the SAHEL model (Penning de Vries et al., 1989). This model calculates the daily water content for each soil layer using meteorolog-ical data (daily minimum and maximum temperature, pre-cipitation, and latitude), WHC (Table 1) and plant cover as inputs. SAHEL was calibrated for each site using the water content of the soil in the soil bags, and the daily water content values for the 0–10 cm layer were generated (Pansu et al., 2004). The meteorological data for the experimental periods were collected from the local weather station at each site, or estimated from the nearest stations and archives of data us-ing a transition probability matrix as described in Pansu et al., (2010).
The model matricesACandANare
AC =
−kVL 0 0 0 0
0 −kVS 0 0 0
kVL kVS − qCO2+kMB
kHL kHS
0 0 kMB −(kHL+kHLS) 0
0 0 0 kHLS −kHS
and
AN =
−kVL 0 0 0 0
0 −kVS 0 0 0
kVL kVS −f xC,MBxN,MB
f (T ) f (θ ) xN,MB+kMB
kHL kHS
0 0 kMB −(kHL+kHLS) 0
0 0 0 kHLS −kHS
.
The vectorsxCandxNof the C and N concentrations in each compartment are
xC =
xC,VL
xC,VS
xC,MB
xC,HL
xC,HS
xN =
xN,VL
xN,VS
xN,MB
xN,HL
xN,HS
and the C : N ratios of each compartment are C : Ni = xxC,i N,i.
For each incubation period, the derivative of C is1
˙ C=
5
X
i=1 ˙
xi,C = −f (T )f (θ ) qCO2xC,MB, (5)
where qCO2 is the metabolic quotient of the microbial biomass:
qCO2= kresp
xMB
CMB0 , (6)
wherekrespis the respiration coefficient, (dimension day−1) scaled byC0MB, the biomass at steady state (estimated on un-treated soil without recent addition of substrate. In this case,
CMB0 was estimated from the values of MB-14C measured at the end of incubation).
For each incubation period, the derivative of the total or-ganic N is the negative of the derivative of total inoror-ganic N and is expressed by
˙ N=
5
X
i=1 ˙
xi,N = −f (xC,MB, xN,MB), (7)
where positive values of the functionf (xC,MB, xN,MB) cor-respond to N mineralization of microbial N and negative val-ues correspond to microbial immobilization of inorganic N.
As the simulation concerned only the14C and15N intro-duced in the straw, the initial conditions for C and N com-partments of microbial origin were set to zero. If C0 is the amount of added14C (=1 for data scaled by the14C input) andfSis its stable fraction, the initial conditions for the14C simulation were given by
xC,VL(0)=(1−fS)C0, xC,VS(0)=fSC0, (8)
xC,MB(0)=xC,HL(0)=xC,HS(0)=0.
The stable fraction,fS, was estimated as that of the stable compartment of the TAO (Transformation of Added Organic materials) model (Thuriès et al., 2002) betweenfSand bio-chemical composition of straw, which gavefS=0.14. IfηNC is the C : N ratio of labelled NC, andηVSthe C : N ratio of the stable fraction of NC, the initial conditions for the15N sim-ulation were given by
xN,VL(0)=
1
ηNC − f s
ηVS
C0, xN,VS(0)=
f s ηVS
C0, (9)
xN,MB(0)=xN,HL(0)=xN,HS(0)=0.
For each incubation period, the model assumes that inorg15N, the inorganic˙ 15N remaining in the porous soil
1The Eq. (5) previously given for MOMOS-C (Pansu et al.,
2010) had an optimumC which must be multiplied by˙ f (T )f (θ ) to giveC adjusted for weather conditions.˙ qCO2on the right-hand
scale of Figs. 3c–8c of Pansu et al. (2010) must be changed to f (T )f (θ )qCO2
bags, is the mineralized15N (− ˙N, Eq. 7) less the15N lost from the bag by root uptake, leaching or gaseous losses, which was modelled using a total loss ratekl:
inorg15N˙ = − ˙N(1−k
l)if inorg15N>0; (10) otherwise, inorg15N˙ =0 if inorg15N≤0.
2.4 Assumptions and strategies tested for simulation of N flows
The functionf (xC,MB, xN,MB)of equation 7 was defined in terms ofηMBlim, the target value for the C : N ratio of the MB (ηMB). The aim was to test the significance of exchanges (N immobilization and N mineralization) between MB and in-organic N, as modelled in MOMOS, using data for MB-15N and inorganic-15N. Two assumptions were tested:
1. The MB C : N ratio remains constant throughout incu-bation (microorganism homeostasis):
f xC,MB, xN,MB=xN,MB−
xC,MB
ηlimMB . (11)
For this function, only one parameter,ηlimMB, has to be fitted for each site, all the other parameters being those fitted for14C simulations (Table 3).
2. The MB C : N ratio decreases linearly with incubation time fromηmaxMB at the beginning of experiment toηminMB
at incubation time tc (succession in the decomposer chain with associated changes in C : N ratios), and then remains constant atηminMBaftertc:
f xC,MB, xN,MB
=xN,MB−ηmax xC,MB MB−ηMBmax−ηMBmin
t tc
fort <=tc;
otherwise,f xC,MB, xN,MB=xN,MB−xC,MB
ηmin MB
fort > tc. (12)
For this function three parameters must be fitted for each site:ηmaxMB,ηminMB, andtc.
Two alternative simulation strategies were also tested: (a) simulated values of MB 15N and inorganic 15N were lim-ited to positive values and (b) negative simulated values for MB15N and inorganic 15N were allowed. Strategy (b) was used for assumption 1, i.e. that the MB C : N ratio was con-stant (although the model did not calculate many negative values, except at the start of simulation), both strategies were tested for assumption 2, i.e. that the C : N ratio decreased. Simulated negative values did not, of course, indicate that the15N content was really negative, but rather that14N could replace15N to supply the nitrogen requirement.
y2 = (1.03 ± 0.02)R² = 0.98 *** x y1 = (1.06 ± 0.03)x
R² = 0.95 ***
y3 = (0.99 ± 0.02)x
R² = 0.98 ***
0 5 10 15 20 25
0 5 10 15 20 25
yPredicted mg inorganic-15N
g-1added-14C
xObserved mg inorganic-15N g-1added-14C
y1 = (1.07 ± 0.18)x
R² = 0.54 ***
y2 = (1.05 ± 0.19)x
R² = 0.51***
y3 = (0.99 ± 0.17)x
R² = 0.54 ***
0 2 4 6
0 2 4 6
yPredicted mg MB-15N
g-1added-14C
xObserved mg MB-15N g-1added-14C
[image:7.595.86.511.62.263.2]a
b
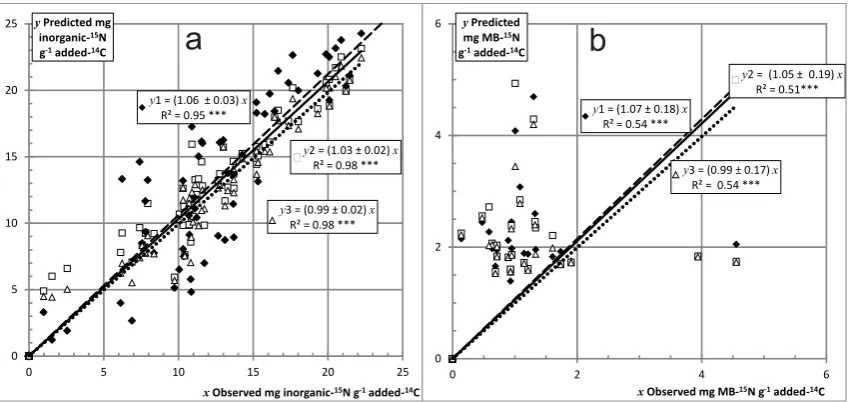
Fig. 2. Model predictions vs. observed values for the whole data set of (a) inorganic15N, and (b) MB-15N: (y1) assumption 1 (dashed line), (y2) assumption 2 and strategy (a) (solid line), or (y3) assumption 2 and strategy (b) (dotted lines).
2.5 Accuracy tests
The significance of the MOMOS simulations compared to the mean of measured values was tested by
F =
n P
i=1
(y¯i− ¯y)2/(n−1) Pn
i=1 y¯i− ˆyi
2
/(n−p)
, (13)
wherei=1,. . . nis the number of sampling occasions (n= 11),pthe number of model parameters which were specifi-cally adjusted to predict the total production of inorganic15N (p=1 for assumption 1,p=3 for assumption 2),y¯i is the
measured total remaining15N ati,yˆi is the corresponding
MOMOS predicted value with assumption 1 or 2 andy¯is the mean of the data series for each site.
The graphs in Figs. 3–5 show whether the predicted values were within or outside the confidence intervals of the corre-sponding data series.
F tests were performed using RSST, the residual sum of
squares between the measured values and the values pre-dicted by MOMOS for assumptions 1 and 2 (Table 4):
FyA12=
RSSA1 RSSA2
=
n P
i=1
(y¯i− ˆyiA1)2/(n−1)
n P
i=1
(y¯i− ˆyA2)2/(n−3)
, (14)
whereyA1 andyiA2 were the predicted values for assump-tions 1 and 2, respectively.
AnF value (Eq. 14) greater thanF(n,n−p)0.05 indicates that assumption 1 must be rejected at 5 % significance level; RSSA1 was significantly greater than RSSA2, and so as-sumption 1 predictions were significantly less accurate than
assumption 2 predictions. A non-significantF test (Eq. 14) showed that the two assumptions did not give significantly different predictions. The test was performed on the whole data set for all six sites and on data for each site (Burnham and Anderson, 1998). Predicted vs. measured values were plotted, and straight lines were fitted to test the overall ro-bustness of predictions for inorganic and MB15N (Fig. 2). Confidence intervals of the intercepts and slopes were calcu-lated; an intercept significantly different from 0 shows an ab-solute bias, and a slope significantly different from 1 shows a relative bias (Pansu et al., 2001).
3 Results
3.1 Mineralization of added15N
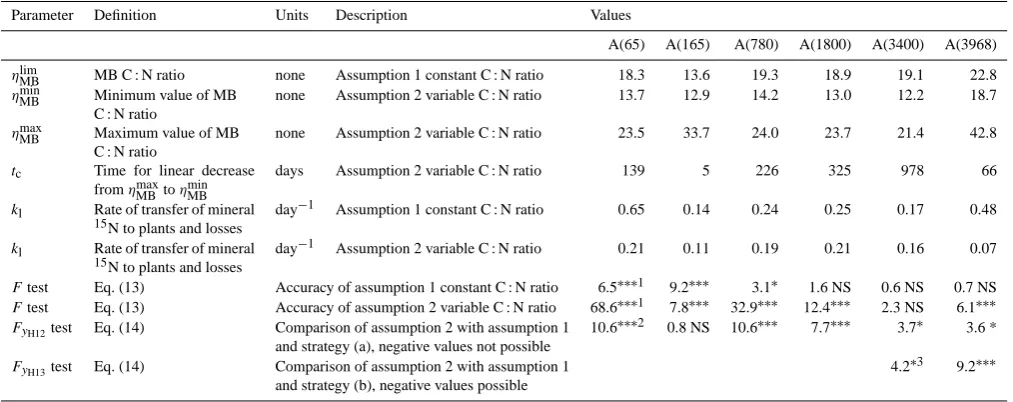
Table 4. Values and significance of additional parameters for MOMOS-N (this study).
Parameter Definition Units Description Values
A(65) A(165) A(780) A(1800) A(3400) A(3968)
ηMBlim MB C : N ratio none Assumption 1 constant C : N ratio 18.3 13.6 19.3 18.9 19.1 22.8
ηMBmin Minimum value of MB C : N ratio
none Assumption 2 variable C : N ratio 13.7 12.9 14.2 13.0 12.2 18.7
ηMBmax Maximum value of MB C : N ratio
none Assumption 2 variable C : N ratio 23.5 33.7 24.0 23.7 21.4 42.8
tc Time for linear decrease
fromηmaxMB toηMBmin
days Assumption 2 variable C : N ratio 139 5 226 325 978 66
kl Rate of transfer of mineral 15N to plants and losses
day−1 Assumption 1 constant C : N ratio 0.65 0.14 0.24 0.25 0.17 0.48
kl Rate of transfer of mineral
15N to plants and losses
day−1 Assumption 2 variable C : N ratio 0.21 0.11 0.19 0.21 0.16 0.07
Ftest Eq. (13) Accuracy of assumption 1 constant C : N ratio 6.5∗∗∗1 9.2∗∗∗ 3.1∗ 1.6 NS 0.6 NS 0.7 NS
Ftest Eq. (13) Accuracy of assumption 2 variable C : N ratio 68.6∗∗∗1 7.8∗∗∗ 32.9∗∗∗ 12.4∗∗∗ 2.3 NS 6.1∗∗∗
FyH12test Eq. (14) Comparison of assumption 2 with assumption 1 10.6
∗∗∗2 0.8 NS 10.6∗∗∗ 7.7∗∗∗ 3.7∗ 3.6 *
and strategy (a), negative values not possible
FyH13test Eq. (14) Comparison of assumption 2 with assumption 1 4.2
∗3 9.2∗∗∗
and strategy (b), negative values possible
MB is the microbial biomass;1model prediction significantly better than mean of measured values whenp <0.01(∗∗∗),
p <0.05(∗), or not significantly better (NS);2model prediction with assumption 2 and
strategy (a) significantly better than model predictions with assumption 1 whenp <0.01(∗∗∗),p <0.05(∗), or not significantly better (NS);3model prediction with assumption 2 and strategy (b) significantly
better than model predictions with assumption 1 whenp <0.01(∗∗∗),
p <0.05(∗), or strategy (b) not necessary (blank).
0 0.1 0.2 0.3
0 180 360 540 720 900
mg15N g-1
added14C
Days
c
Inorganic15N remaining in bags
A(65)
1 2
0 10 20 30
0 180 360 540
mg15N g-1
added14C
Days
b
Total produced inorganic15N Potentially mineralizable HL-15N
A(65)
1
2
HL-15N
0 2 4 6
0 180 360 540
mg15N g-1
added14C
Days
a
Microbial MB-15N Plant debris NC-15N Stable humus HS-15N
A(65)
HS-15N
NC-15N
MB-15N 2
1
[image:8.595.64.524.324.483.2]Inorganic- N15
Fig. 3. Measured and simulated values at the lowest site (A65): squares are measured data with 95 % confidence intervals of (a) MB-15N, (b) total inorganic-15N, (c) inorganic15N remaining in bags; heavy dashed lines (1) are the simulated values using assumption 1 of constant C : N ratio of MB; heavy solid lines (2) are the simulated values using assumption 2 (variable C : N ratio of MB) and the first strategy (a); the light dotted line in (a) is the simulated15N in stable humus HS, the light dashed line in (a) is the15N remaining in the plant necromass (NC) and the light solid line in (b) is the potentially mineralizable15N in the labile humus HL.
3.2 Prediction of 15N mineralization using a constant MB C : N ratio
Figure 2 shows the predictions of inorganic 15N using as-sumption 1 (Eq. 11) for the whole data set. No absolute bias was detected, but slopes significantly greater than 1 indicated a slight over-prediction of 6 % for inorganic15N (, dashed line, andy1 in Fig. 2a).
Nevertheless, the predicted values of15N mineralization corresponded with the measured values only for low-altitude sites whenp <0.01 for A(65) and A(165) and when p <
0.05 for A(780) (Table 4). Predicted values were within the
0 10 20 30
0 180 360 540 720 900
mg15N g-1 added14C
Days
b
Total produced inorganic-15N
Potentially mineralizable HL-15N
A(1800) Inorganic15N
1
2
HL-15N
0 1 2 3 4 5 6
0 180 360 540 720 900
mg15N g-1 added14C
Days
a
Microbial MB-15N
Plant debris NC-15N
Stable humus HS-15N
A(1800)
HS-15N
NC-15N 2
MB-15N 2
1
0 0.1 0.2 0.3
0 180 360 540 720 900
mg15N g-1 added14C
Days
c
Inorganic15N
remaining in bags A(1800)
1
[image:9.595.67.524.61.222.2]2
Fig. 4. Measured and simulated values for the mid-altitude site (A1800): squares are measured data with 95 % confidence intervals of (a) MB-15N, (b) total inorganic-15N, (c) inorganic15N remaining in bags; heavy dashed lines (1) are the simulated values using assumption 1 of constant C : N ratio of MB; heavy solid lines (2) are the simulated values using assumption 2 (variable C : N ratio of MB) and the first strategy, (a); the light dotted line in (a) is the simulated15N in stable humus HS, the light dashed line in (a) is the15N remaining in the plant necromass (NC) and the light solid line in (b) is the potentially mineralizable15N in the labile humus HL.
0 10 20 30
0 180 360 540 720 900 1080
mg15N g-1
added14C
Days
b
Total produced inorganic15N potentially mineralizable HL-15N
A(3968)
Inorganic15N 1
2
3 HL-15N
0 1 2 3 4 5 6
0 180 360 540 720 900 1080
mg15N g-1
added14C
Days
a
Microbial MB-15N
Plant debris NC-15N
Stable humus HS-15N
A(3968)
HS-15N
NC-15N
MB-15N 1
2 3
0 0.1 0.2 0.3
0 180 360 540 720 900 1080
mg15N g-1
added14C
Days
c
Inorganic15N
remaining in bags
A(3968)
1 2
[image:9.595.68.523.303.463.2]3
Fig. 5. Measured and simulated values for the high-altitude site (A3968): squares are measured data with 95 % confidence intervals of (a) MB-15N, (b) total inorganic-15N, (c) inorganic15N remaining in bags; heavy dashed lines (1) are the simulated values using assumption 1 of constant C : N ratio of MB; heavy solid lines (2) are the simulated values using assumption 2 (variable C : N ratio of MB) and the first strategy (a); heavy dotted lines (3) are the simulated values using assumption 2 and strategy (b); the light dotted line in (a) is the simulated
15N in stable humus HS, the light dashed line in (a) is the15N remaining in the plant necromass (NC) and the light solid line in (b) is the
potentially mineralizable15N in the labile humus HL.
3.3 Prediction of15N mineralization using variable MB
C : N ratio
For the whole data set, the predicted values using assump-tion 2 (solid line, and y2 in Fig. 2a) were close to those predicted using assumption 1 (, dashed line, and y1 in Fig. 2a). The use of assumption 2 and strategy (a) improved predictions by reducing the over-prediction of inorganic-15N to 3 %, but the two methods were not significantly differ-ent when p <0.1 (F test=1.52, Eq. 14). There was no over-prediction using assumption 2 and strategy (b) (1, dot-ted line, andy3 in Fig. 2a). In this case, the result of the
F test comparing the results for y1 and y3 (Eq. 14) was
1.89, which is not significant whenp <0.05, but is signif-icant whenp <0.1. For the whole data set, the predictions using the various assumptions and strategies can be consid-ered as equivalent.
Assumption 2 (Eq. 12) gave more accurate predictions than assumption 1 in some particular situations, especially at high altitude. The predicted values of15N mineralization us-ing assumption 2 corresponded to the measured values when
A(3968). There was no significant difference between the predictions given by the two assumptions for A(165). Strat-egy (b), allowing negative values for inorganic 15N and MB15N, predicted the measured values at the two highest sites significantly better than strategy (a), with p <0.01 for A(3968) and whenp <0.05 for A(3400) (Eq. 14, Table 4).
For A(65) (Fig. 3b), A(780) and A(1800) (Fig. 4b), the predicted values, using a variable MB C : N ratio and truncat-ing negative values (strategy (a)), were within the 95 % con-fidence intervals of all the measurements. For A(3400), 10 of the 11 predicted values were within the 95 % confidence intervals for both strategy (a) and strategy (b) (not shown). For A(3968) (Fig. 5b), 9 of the 11 predicted values were within the 95 % confidence intervals of the measurements when strategy (a) was used (curve 2). All the predicted val-ues were within the 95 % confidence intervals when strategy (b) was used (curve 3).
3.4 Prediction of other N-labelled compartments
Although measurements were only available for the first five periods, for the MB15N and inorganic-15N remaining in the soil bags (see material and methods), the model predictions of MB-15N were significantly similar to the measured values for the whole data set (Fig. 2b). The over-prediction of 7 %, calculated with assumption 1 for MB-15N in the whole data set, was not significant (Fig. 2), and was again reduced to 5 % by using assumption 2 and strategy (a). There was no over-prediction using assumption 2 and strategy (b) (Fig. 2b).
For A(65), four of the five MB15N values were slightly over-predicted using assumption 1 (1 in Fig. 3a), and three were over-predicted using assumption 2 (2 in Fig. 3a). For A(165) MB15N data were over-predicted (not shown). For A(780), the last MB 15N value was slightly under-predicted (but within its wide confidence interval) whereas the three previous values were over-predicted (not shown). For A(1800) (Fig. 4a), 3 values of MB15N were accurately predicted while one was under-predicted and one was over-predicted. For A(3400) (not shown), the MB15N were over-predicted. For A(3968) (Fig. 5a), 2 of the 5 MB15N values were over-predicted. Although microorganisms are consid-ered to be responsible for most transformations, their weight in terms of15N stock is one of the lowest of the five MOMOS compartments. This was found to increase with altitude: af-ter 540 days of incubation the stocks were 0.8 for A(65), 0.9 for A(165) and A(780), 1.5 for A(A800), and 2 mg15N g−1 (added14C) for A(3400) and A(3968).
With assumption 1 or assumption 2, all the predicted val-ues for organic 15N remaining in the soil bags were close to the measured 95 % confidence intervals, but there were no significant differences between the values for the two as-sumptions (Figs. 3c–5c).
In all cases, the model predicted a relatively large stock of 15N in the labile microbial metabolites (HL compartment), which was about 80 % of the organic forms of 15N at the
end of experiment and the main reserve of potentially min-eralizable15N (Figs. 3b–5b). At the lowest sites, A(65) and A(165), the net mineralization was highest and the HL-15N was modelled as having about one-third of inorganic-15N af-ter 540 days of incubation. The net mineralization then de-creased and the HL-15N reserve increased with altitude (ex-cept between A(3400) and A(3968)); at 540 days of incuba-tion the HL-/inorganic-15N ratio was 0.6 for A(780), 0.9 for A(1800), 2.3 for A(3400), and 1.4 for A(3968).
The non-decomposed plant debris (NC in Fig. 1) was pre-dicted as being the lowest15N stock at the end of the ex-periment, slightly increasing with altitude and proportion of coarse fractions (Table 1); at 540 days of incubation, it was close to 0.1 for A(65), 0.2 for A(165) and A(780), 0.3 for A(1800), and 0.4 mg15N g−1 (added14C) for A(3400) and A(3968) (Figs. 3a–5a). Conversely, the amounts of15N sta-bilized in the stable humified compartment (HS in Fig. 1)) were modelled as almost stable for the three low-altitude sites, and as decreasing with altitude and cold climate; at 540 days of incubation it was 1.2 for A(65), 1.0 for A(165), 1.3 for A(780), 0.8 for A(1800), 0.6 for A(3400) and 0.4 for A(3968) (Figs. 3a–5a).
4 Discussion
4.1 Relationship between N and C cycles
This study also provided an answer to the question of mi-croorganism homeostasis: does the microbial biomass C : N ratio remain constant or does it vary with incubation time and in different ecosystems? The model predictions using the as-sumption that the MB C : N ratio remains constant through-out the incubation period gave MB C : N values (Table 4) ranging from 13.6 at the tropical savannah site, A(165), to 22.8 at the highest site, A(3968), for a14C :15N ratio of 32 for the substrate (Table 2). These could be considered high since the C : N ratio is generally considered to be within a restricted range from about 5 to 15 (Manzoni and Porporato, 2009). The microbial cultures of Nicolardot et al. (1986) had C : N ratios in the range 5.2–12.7, depending on the substrate C : N ratios used in their laboratory conditions. Other works such as that of Wallander et al. (2003) found MB C-N ratios of between 18.5 (for a soil C : N ratio of 16.9) and 21.9 (for a soil C : N ratio of 30.4); Bottner et al. (2006) measured MB 14C :15N ratios of 7.9±1.3 for a substrate14C :15N ratio of 26.8, and MB 14C :15N ratios of 33.9±7.5 for a substrate 14C :15N ratio of 130 (2×10 measurements in two sites). The MB-C : N ratios found in this paper were close to the measured total C : N ratios (Table 1) for the six sites, sug-gesting that the quality of living and dead organic materials converge to similar values after long fallow periods.
Especially for the high-altitude sites in this study, the pre-dicted values were significantly more accurate when the MB C : N ratio was reduced linearly with the incubation time. The MB C : N ratio was highest with excess C at the start of cubation, which encouraged microbial immobilization of in-organic N. The C : N value decreased linearly with time to its minimum value associated with a reduction in C miner-alization, with a lower slope at higher altitudes. The mini-mum values found for MB C : N ratios (Table 4) were in the commonly accepted range, except at the high-altitude site A(3968), where CO2-C respiration was reduced by lower temperatures. This study shows that it is possible to model the climatic role in C and N storage: cold and wet climates cause the accumulation of C with high C : N values, in ac-cordance to Wallander et al. (2003) for Norway. Bottner et al. (2006) showed that total respired CO2-14C was lower for nitrogen-poor straw than for nitrogen-rich straw. This was partly explained by an increase in microbial mortality (kMB rate) which could increase the HL reserve, which is richer in N than stable NC and can sustain MB and the microbial con-version to inorganic N. This study illustrates that more15N was retained in plant debris at higher altitudes (and in soils with coarse texture) and that there was a lower concentration of15N and an increase in14C :15N ratios in stable humified compounds in these conditions. This was associated with a slight increase in the predicted values for the stock of living microorganisms in cold and wet climates which could cause significant release of CO2 associated with higher tempera-ture, from the high reserves of C in these conditions, con-firming risks already mentioned (Gundelwein et al., 2007; Reichstein et al., 2013).
Except for A(165) and A(3968), the slopes of the MB C : N ratio vs. time decreased with increasing altitude (tc in Table 4). This appears to be consistent with a decrease in metabolic rates with temperature (Eqs. 1 and 2).
Allowing negative values for inorganic15N (immobiliza-tion of inorganic 14N) only significantly improved the pre-dicted values for15N mineralization at the two high-altitude sites, especially at the highest site. For these sites, the model predicted microbial immobilization of N not only at the start of incubation, but also later on during incubation. This strange behaviour needs to be investigated by further experi-ments.
4.2 Ecological consistency, accuracy and robustness
This study established that there is a strong link between C and N assimilation, the only difference between the model for C and the model for N being the modelling of the mi-crobial exchanges to and from inorganic compounds. C is removed from the system as the CO2 from microbial respi-ration (Eqs. 5 and 6), while inorganic N recycles rapidly in the soil in equilibrium with the microbial N. This confirms that MB acts as a very active, short-term reserve, temporar-ily storing C and N, releasing C by respiration, producing C+N labile humus compounds (HL in Fig. 1) by microbial mortality and exudation, recycling the major part of this HL, and converting to and from inorganic forms of N. For the whole data set, MOMOS appears robust for the prediction of inorganic N available for plant growth. As a first approxi-mation, microorganism homeostasis can be assumed, giving accuracy within about 6 %. Consequently, using the simpler assumption 1, of a constant C : N ratio (Eq. 11), can give pre-dictions that are sufficiently robust (Fig. 2) for modelling on a regional scale.
However, more precise studies, especially in cold and wet areas, require microorganisms to be considered as not being really homeostatic. The decomposition processes are proba-bly initiated by fungi with a high C : N ratio and continued by bacteria or other microorganisms with lower C : N ratios. The fumigation-extraction used in this work is one of the most popular methods for global microbial quantification (Satya-narayana et al., 2012) but it is subject to errors which could explain some of the discrepancies between the predictions and measurements of14C- and15N-MB in this study. Fumi-gation and extraction must be made using fresh samples pre-served at 4◦C. Unfortunately, the experimental plots were in
encouraging that (1) MB predictions appeared to be unbiased for the whole data set (Fig. 2b) and (2) that the errors in MB measurements at some sites did not greatly affect the accu-racy of predictions of inorganic-15N; the model appears to be robust for these predictions which are essential for evaluating the life cycle.
The MOMOS model is based on the principle of parallel C and N assimilation (see PAR models in the introduction), as it includes simultaneous, direct microbial assimilation of plant and humus compounds, ammonium production by microor-ganisms and, possibly, microbial assimilation of the ammo-nium produced. This work builds on the proposition under-lying MOMOS C that microorganisms play a key role in the decomposition process. For the N cycle, the model requires only one two-way path between MB and inorganic N based on fitting the C : N ratio of MB (the C : N ratio of the humus compartments are predicted, the C : N ratio of necromass and its stable VS compartment are measured or estimated, and the C : N ratio of VL is calculated by the balance Eq. 9). The other C and N models (see Introduction) generally derive the N cycle by dividing the C values of each compartment by a given C : N ratio and they propose several paths for min-eralization and immobilization of N. For example, Parton et al. (1987) proposed fixing the C : N ratios at 150 for the struc-tural compartment, 10–25 for the metabolic compartment, 8 for the active compartment, 11 for the slow compartment, and 11 for the passive-compartment, with five paths for min-eralization and immobilization, which is less parsimonious in parameters than MOMOS as described in this study. The previously proposed MOMOS-N (Pansu et al., 1998) also at-tempted to simplify the model parameterization but was less parsimonious than the equation system described in this pa-per, which should fill a gap (see Introduction) in modelling “direct microbial control over decomposition”.
Acknowledgements. This study was part of the bilateral France–
Venezuela cooperation programme ECOS-NORD V07A01
(Modelling soil organic mater in Venezuelan ecosystems and its application to fertility management and carbon sequestration) and financed in part by CDCHT-ULA (project C-765-95-01-B) and FONACIT (F-2002000424). We should like to thank the experts who contributed to the Biogeoscience discussion website http://www.biogeosciences-discuss.net/: Nicolardot (Agrosup, Di-jon, France) for his constructive comments on microbial C : N ratio, A. Hammoudi and O. Iosifescu (Institute of mathematics and mod-elling, Université Montpellier 2, France) for their analysis of the MOMOS equation system, S. D. Allison (University of California, Irvine, USA) and three anonymous referees for their constructive reviews for Biogeoscience and Biogeoscience discussion.
Edited by: F. X. Meixner
References
Barraclough, D.: The direct or MIT route for nitrogen immobiliza-tion: a 15N mirror image study with leucine and glycine, Soil Biol. Biochem., 29, 101–108, 1997.
Bottner, P., Pansu, M., Sarmiento, L., Hervé, D., Callisaya-Bautista, R., and Metselaar, K.: Factors controlling decomposi-tion of soil organic matter in fallow systems of the high trop-ical Andes: a field simulation approach using 14C and 15 N-labelled plant material Soil Biol. Biochem., 38, 2162–2177, doi:10.1016/j.soilbio.2006.01.029, 2006.
Bradbury, N. J., Witmore, A. P., Hart, P. B. S., and Jenkinson, D. S.: Modelling the fate of nitrogen in crop and soil in the years following application of 15N-labelled fertilizer to winter wheat, J. Agr. Sci., 121, 363–379, 1993.
Brookes, P. C., Landman, A., Pruden, G., and Jenkinson, D. S.: Chloroform fumigation and the release of soil nitrogen : a rapid direct extraction method to measure microbial biomass nitrogen in soil, Soil Biol. Biochem., 17, 837–842, 1985.
Burnham K. P. and Anderson D. R.: Model Selection and Multi-model Inference A Practical Information-Theoretic Approach, Second Edition Springer, Eidelberg, New-York, Tokyo, 1998. Carter, M. R., Parton, W. J., Rowland, I. C., Schultz, J. E., and Steed,
G. R.: Simulation of soil organic carbon and nitrogen changes in cereal and pasture systems of southern Australia, Austr. J. Soil Res., 31, 481–491, 1993.
Coûteaux, M. M., Sarmiento, L., Bottner, P., Acevedo, D., and Thiéry, J. M.: Decomposition of standard plant material along an altitudinal transect (65–3968 m) in the tropical Andes, Soil Biol. Biochem., 34, 69–78, 2002.
Dou, Z. and Fox, R. H.: Using NCSWAP to simulate seasonal ni-trogen dynamics in soil and corn, Plant and Soil, 177, 235–247, 1995.
Franko, U.: Simulation of carbon and nitrogen dynamics in rural areas, Landbauforschung Volkenrode, 46, 114–120, 1996. Garnier, P., Néel, C., Mary, B., and Lafolie, F.: Evaluation of a
ni-trogen transport and transformation model in a bare soil, Europ. J. Soil Sci., 52, 253–268, 2001.
Gundelwein, A., Müller-Lupp, T., Sommerkorn, M., Haupt, E. T. K., Pfeiffer, E. M., and Wiechmann, H.: Carbon in tundra soils in the Lake Labaz region of arctic Siberia, Europ. J. Soil Sci., 58, 1164–1174. 2007.
Joergensen, R. G. and Mueller, T.: The fumigation-extraction method to estimate soil microbial biomass: Calibration of the k(EN) value, Soil Biol. Biochem., 28, 33–37, 1996.
Kaboré, W.T., Pansu, M., Hien, E., Brunet, D., Barthès, B.G., Houot, S., Coulibaly, A., Zombré, P., Thuriès, L., and Masse, D.: Near infrared reflectance spectroscopy applied to model the transformation of added organic materials in soil, J. Near Infrared Spectroscopy, 20, 339–351, 2012.
Kemmitt, S., Lanyon, C., Waite, I., Wen, Q., Addiscott, T. M., Bird, N. R. A., O’Donnell, A., and Brookes, P.: Mineralization of na-tive soil organic matter is not regulated by the size, activity or composition of the soil microbial biomass – a new perspective, Soil Biol. Biochem., 40, 61–73, 2008.
Manzoni, S. and Porporato, A.: Soil carbon and nitrogen mineral-ization: Theory and models across scales, Soil Biol. Biochem., 41, 1355–1379, 2009.
Mueller, T., Magid, J., Jensen, L. S., Svendsen, H., and Nielsen, N. E.: Soil C and N turnover after incorporation of chopped maize, barley straw and blue grass in the field: Evaluation of the DAISY soil-organic-matter submodel, Ecol. Modell., 111, 1–15, 1998. Neill, C. and Gignoux, J.: Soil organic matter decomposition driven
by microbial growth: a simple model for a complex network of interactions, Soil Biol. Biochem., 38, 803–811, 2006.
Nicolardot B., Guiraud G., Chaussod R., and Catroux G.: Minéral-isation dans le sol de matériaux microbiens marqués au carbone 14 et à l’azote 15 : quantification de l’azote de la biomasse mi-crobienne, Soil Biol. Biochem., 18, 263–273, 1986.
Nicolardot, B., Recous, S., and Mary, B.: Simulation of C and N mineralisation during crop residue decomposition: a simple dy-namic model based on the C : N ration of the residues, Plant Soil, 83, 83–103, 2001.
Pansu, M. and Gautheyrou, J.: Handbook of soil analysis – Miner-alogical, organic and inorganic methods, Springer, Berlin, Hei-delberg, New-York, 993 pp., 2006.
Pansu, M., Sallih, Z., and Bottner, P.: Modelling of soil nitrogen forms after organic amendments under controlled conditions, Soil Biol. Biochem., 30, 19–29, 1998.
Pansu, M., Thuriès, L., Larré-Larrouy, M. C., and Bottner, P.: Pre-dicting N transformations from organic inputs in soil in rela-tion to incubarela-tion time and biochemical composirela-tion, Soil Biol. Biochem., 35, 353–363, 2003.
Pansu M., Gautheyrou J., and Loyer J. Y.: Soil Analysis - Sampling, Instrumentation and Quality control, Balkema, Lisse, Abington, Exton, Tokyo, 489 pp., 2001.
Pansu, M., Bottner, P., Sarmiento, L., and Metselaar, K.: Com-parison of five soil organic matter decomposition models us-ing data from a14C and15N labeling field experiment, Global Biogeochem. Cy., 18, GB4022, doi:4010.1029/2004GB002230, 2004.
Pansu, M., Martineau, Y., and Saugier, B.: A modelling method to quantify in situ the input of carbon from roots and the resulting C turnover in soil, Plant Soil, 317, 103–120, doi:10.1007/s11104-008-9791-1, 2009.
Pansu, M., Sarmiento, L., Rujano, M. A., Ablan, M., Acevedo, D., and Bottner, P.: Modeling Organic transformations by Micro-Organisms of Soils in six contrasting ecosystems: validation of the MOMOS model, Global Biogeochem. Cy., 24, GB1008, doi:10.1029/2009GB003527, 2010.
Parton, W. J., Schimel, D. S., Cole, C. V., and Ojima, D. S.: Analysis of factors controlling soil organic matter levels in great plains grasslands, Soil Sci. Soc. Am. J., 51, 1173–1179, 1987. Penning de Vries, F. W. T., Jansen, D. M., ten Berge, H. F. M., and
Bakema, A.: Simulation of ecophysiological processes of growth in several annual crops, Pudoc, Wageningen, 271 pp., 1989. Quemada, M. and Cabrera, M. L.: CERES-N model predictions of
nitrogen mineralized from cover crop residues, Soil Sci. Soc. Am. J., 59, 1059–1065, 1995.
Reichstein, M., Bahn, M., Ciais, P., Frank, D., Mahecha, M.D., Seneviratne, S.I., Zscheischler, J., Beer, C., Buchmann, N., Frank, D.C., Papale, D., Rammig, A., Smith, P., Thonicke, K., van der Velde, M., Vicca, S., Walz, A., and Wattenbach, M.: Climate extremes and the carbon cycle, Nature, 500, 287–295, doi:10.1038/nature12350, 2013.
Richter, J. and Benbi, D. K.: Modeling of nitrogen transformations and translocations, Plant Soil, 181, 109–121, 1996.
Satyanarayana, T., Bhavdish, N. J.,and Prakash, A.: Microorgan-isms in Environmental Management. Microbes and Environ-ment, Springer, 2012.
Sterner, R. W. and Elser, J. J.: Ecological stoichimometry. The bi-ology of elements from molecules to biosphere, edited by: Press, P. U., Princeton and Oxford, 2002.
Thuriès, L., Pansu, M., Larré-Larrouy, M. C., and Feller, C.: Bio-chemical composition and mineralization kinetics of organic in-puts in a sandy soil, Soil Biol. Biochem., 34, 239–250, 2002. Todd-Brown, K. E. O., Hopkins, F. M., Kivlin, S. N., Jennifer, M.,
Talbot, J. M., and Allison, S. D.: A framework for represent-ing microbial decomposition in coupled climate models, Biogeo-chemistry, 109, 19–33, doi:10.1007/s10533-011-9635-6, 2012. Treseder, K. K., Balser, T. C., Bradford, M. A., Brodie, E. L.,
Dubin-sky, E. A., Eviner, V. T., Hofmockel, K. S., Lennon, J. T., Levine, U. Y., MacGregor, B. J., Pett-Ridge, J., and Waldrop, M. P.: In-tegrating microbial ecology into ecosystem models: challenges and priorities, Biogeochemistry, 109, 7–18, doi:10.1007/s10533-011-9636-5, 2011.
Van Veen, J. A., Ladd, J. N., and Amato, M.: Turnover of carbon and nitrogen through the microbial biomass in a sandy loam and a clay soil incubated with [14C(U]glucose and [15N](NH4)2SO4
under different moisture regimes, Soil Biol. Biochem., 17, 747– 756, 1985.