www.ann-geophys.net/29/81/2011/ doi:10.5194/angeo-29-81-2011
© Author(s) 2011. CC Attribution 3.0 License.
Annales
Geophysicae
Vertical and longitudinal electron density structures of equatorial
E- and F-regions
P. S. Brahmanandam1,2, Y.-H. Chu2, K.-H. Wu2, H.-P. Hsia2, C.-L. Su2, and G. Uma1,2
1Dept. of Electronics & Communication Engineering, K L University, Vaddeswaram 522502, India 2Institute of Space Science, National Central University, Chung-Li, Taiwan
Received: 17 July 2009 – Revised: 17 May 2010 – Accepted: 28 December 2010 – Published: 10 January 2011
Abstract. From global soundings of ionospheric electron density made with FORMOSAT 3/COSMIC satellites for September 2006–August 2009, day-night variations in ver-tical and longitudinal structures of the electron densities in equatorial E- and F-regions for different seasons are in-vestigated for the first time. The results reveal that the wavenumber-3 and wavenumber-4 patterns dominated the nighttime (22:00–04:00 LT) F-region longitudinal structures in solstice and in equinox seasons, respectively. In daytime (08:00–18:00 LT) F-region, the wavenumber-4 patterns gov-erned the longitudinal structures in the September equinox and December solstice, and wavenumber-3 in March equinox and June solstice respectively. A comparison of the day-time and nightday-time longitudinal electron density structures indicates that they are approximately 180◦out of phase with
each other. It is believed that this out of phase relation is very likely the result of the opposite phase relation between daytime and nighttime nonmigrating diurnal tidal winds that modulate background E-region dynamo electric field at dif-ferent places, leading to the day-night change in the locations of the equatorial plasma fountains that are responsible for the formation of the F-region longitudinal structures. Further, a good consistency between the locations of the density struc-tures in the same seasons of the different years for both day-time and nightday-time epochs has been noticed indicating that the source mechanism for these structures could be the same.
Keywords. Ionosphere (Electric fields and currents; Equa-torial ionosphere)
Correspondence to: P. S. Brahmanandam ([email protected])
1 Introduction
82 P. S. Brahmanandam et al.: Electron density structures of equatorial E- and F-regions role in the four-wave structures in electron densities via the
E-region dynamo mechanism. Immediately questions will be raised about the relative importance of other tidal waves (for example DE2, SE3, SE2 and DW1, DW2 etc.) particu-larly when the DE3 tidal wave significance is less i.e., dur-ing winter solstice (Forbes et al., 2008). Based on their lat-itudinal extent, vertical wavelength, hemispheric symmetry and wave amplitude, the relative importance of tidal waves in generating electric fields appears to be DE3, DE2, SW4 and SW3 (in the order of importance) respectively (Forbes et al., 2008) which means during the absence of DE3, other tidal waves should play an effective role in generating elec-tric fields, which may eventually govern the 3, wave-2 and wave-5 longitudinal ionospheric structures. To verify these aspects, studies on seasonal variations of ionospheric structures with advanced data analysis methods will be car-ried out as it is believed that these may provide clues on the possible role of tidal winds in the modulation of elec-tric fields in order to produce longitudinal structures in the overlying ionosphere. As a matter of fact, both observa-tional and modeling studies, though very few, on the seasonal variations in longitudinal ionospheric structures have been documented particularly after the Immel et al. (2006) report, who postulated for the first time that the fate of longitudinal structures would be dictated by the upward propagating tidal waves. For instance, after careful inspection of TEC data measured by the TOPEX/Poseidon altimeter for more than 13 years (between August 1992 and October 2005), Scher-liess et al. (2008) found that the wavenumber-4 longitudinal structure is observed during equinox in daytime as well as in nighttime and is prominent only during nighttime in June Solstice, while wavenumber-3 longitudinal structure is ob-served during December Solstice. Ren et al. (2008) analyzed ion density and electron temperature measured by the De-fense Meteorological Satellite Program (DMSP) F13 Satel-lite at the local time around 1745 for the period 1995–2005 and showed that the longitudinal variations in the electron temperature and total ion density in the equatorial topside ionosphere exhibit salient seasonal dependence, in which the wavenumber-4 longitudinal structures prevail in equinox and two and three peaks structures are, respectively, dominant in December and June solstice seasons. Ren et al. (2008) have argued that the wavenumber-4 longitudinal structures during equinox epochs may be due to DE3, while three and two wave structures during June and December solstice induced by both the longitudinal variation of geomagnetic declina-tion and DE3. Further, series of simuladeclina-tions of the Nadeclina-tional Center for Atmospheric Research (NCAR) Thermosphere-ionosphere-mesosphere general circulation model (TIME-GCM) indicated that the wavenumber-4 longitudinal struc-tures in the equinox nighttime equatorial ionization anomaly (EIA) can be explained by the effects of an eastward propa-gating non-migrating diurnal tide with wavenumber-3 (DE3) (Hagan et al., 2007). Nevertheless, these studies focused only on two-dimensional perspectives of longitudinal
struc-tures. Questions immediately arise as to what the vertical structure of the longitudinal electron density pattern is. How does it change with season and from day to night? It will defi-nitely be an interesting study to verify the vertical structure of the longitudinal electron densities in three-dimensional per-spectives in different seasons. To attain these goals, the mea-surements of global electron density profiles with sufficiently high resolutions in space and time for a long period of time are required. With the aid of low orbit satellites performing GPS radio occultation observations, it has been shown possi-ble to obtain global soundings of the electron density profiles in the height range from lower E-region to topside ionosphere with vertical resolution of about 1 km (Schreiner et al., 2007; Yang et al., 2009).
An attempt is made in this article to employ the globally GPS-retrieved electron densities for more than three years span of time made with the FORMOSAT-3/COSMIC satel-lite system, which consists of 6 small satelsatel-lites deployed at 800 km altitude to form a constellation with orbit planes of equal separation, to investigate the vertical structure of the longitudinal electron density pattern in equatorial E- and F-regions. Note that the electron densities in the ensuing sec-tions are shown in different seasons (the March and Septem-ber equinoxes and the June and DecemSeptem-ber solstices, respec-tively) in a year and each season contains a 3-month period. It is found that, in addition to seasonal variation, there are significantly day-night changes in the vertical and longitudi-nal electron density structures. This article is organized as follows. In Sect. 2, data analysis and methodology that we adopted in this study will be presented. The salient results of this study are given in Sect. 3. The plausible physical mech-anisms responsible for these features are discussed in Sect. 4 and summary and conclusions are given in Sect. 5.
2 Data analysis and methodology
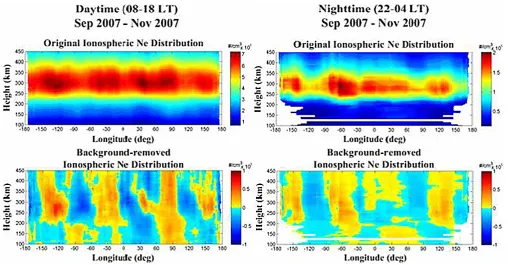
Fig. 1. Example of height versus longitude distributions of original (upper panels) and background-removed (lower panels) ionopsheric
electron densities along the equator for the period September–November 2007, in which daytime (08:00–18:00 LT) (left panels) and nighttime (22:00–04:00 LT) (right panels) averages were, respectively, demonstrated for comparison.
A number of factors, such as thermal noise fluctuations of the received signals, sharp gradients of the ionospheric re-fractive index in vertical and horizontal directions, system bias of the excess phase, inaccurate position of the satellites, and so on, may influence the accuracy and precision of the re-trieved bending angle in terms of radio occultation technique, causing physically erroneous inversion results (Schreiner et al., 2007). In addition, the presence of plasma irregulari-ties in the GPS ray path may cause significant fluctuations of the retrieved electron density profile, giving rise to large uncertainty of the estimation and impairment of the data re-liability (Yang et al., 2009). In this study, we use the criteria of data quality control developed by Yang et al. (2009) to re-move questionable and unreliable data from original data set. Moreover, the retrieved electron densities for the conditions of geomagnetic Kp index greater than 3 are also not included in the data analysis to limit effects from geomagnetic distur-bances.
3 Results
In order to underscore the longitudinal patterns of the equa-torial electron density variations in different seasons and heights, we employ a three order polynomial to best fit to the longitudinal electron density variations at different heights. The vertical structures of the background-removed
longitudinal variation patterns can thus be obtained after the fitted polynomials are subtracted from the original lon-gitudinal variations, which are considered to be the back-ground values along the equator. Figure 1 presents examples of height versus longitude distributions of original (upper panels) and background-removed (lower panels) ionopsheric electron densities for the period September 2007–November 2007, in which daytime average (08:00–18:00 LT) (left pan-els) and nighttime average (22:00–04:00 LT) (right panpan-els) electron density distributions along the geomagnetic equa-tor are, respectively, demonstrated for comparison. Note that the GPS-retrieved electron densities in the latitudinal region within 0±5◦with respect to the geomagnetic equator were employed to construct Fig. 1 and the remaining figures in this article. As shown, a one-to-one correspondence between the peaks (or troughs) of the background-removed electron density fluctuations and those of the original electron den-sity variations is seen, especially for the data around peak electron density height. It is obvious that the background re-moval procedure can indeed highlight the signatures of the longitudinal electron density variations with relatively small amplitudes compared to the background values.
84 P. S. Brahmanandam et al.: Electron density structures of equatorial E- and F-regions
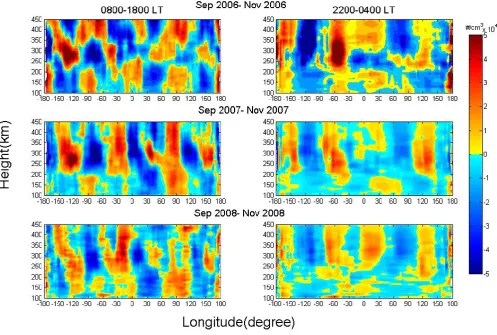
Fig. 2. Longitude versus altitude electron densities (residuals) during September equinox 2006 (upper panels), 2007 (middle panels), and
2008 (bottom panels) for both daytime (08:00–18:00 LT) and nighttime (22:00–04:00 LT).
2008 (bottom panels) respectively, revealed that the four-wave structures at∼160◦W,∼60◦W,∼0◦E, and∼120◦E
prevailed during nighttime F-region from around 200 km to topside ionosphere during 2006. Another noticeable find-ing from this figure is that the locations of four peaks durfind-ing nighttime in the September equinox of 2006 have maintained pretty well consistency with their counterpart nighttime four-peaks in September equinox of 2007 and 2008. This consis-tency behavior in the locations of four-peaks in longitudinal electron densities is not only implying the source mechanism for these structures is the same and it occurred repeatedly during that particular season so as to produce the four-wave longitudinal structures. It is worthwhile to mention here that the DE3 tidal wave has the capability to produce four-wave structures as mentioned in the introduction of this article and it is known to experience a clear seasonal variation in terms of its amplitude and phase (Oberheide et al., 2006). On the other hand, the daytime longitudinal structures dur-ing September equinox of 2006 is also showdur-ing four-wave structures at∼150◦W,∼0◦E,∼90◦E, and∼150◦E, while September equinox of 2007 is also characterized with four-wave structures that located at∼150◦W, ∼30◦W, ∼90◦E,
and ∼150◦E and the four-wave structure can also be
no-ticed during the September equinox of 2008 at ∼150◦W, ∼20◦W, ∼100◦E with another weak structure at ∼160◦E
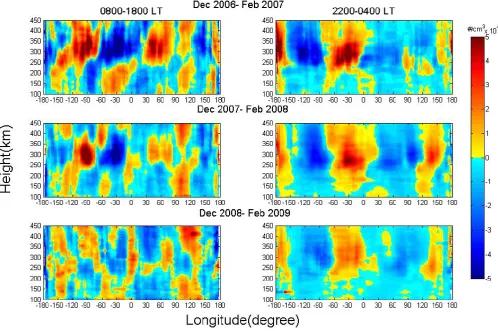
longitude. Further, by comparing both the daytime and night-time longitudinal density structures during 2006, 2007 and 2008, one can find an interesting relationship that the 180◦ out of phase between their locations. Figure 3 depicts the longitudinal density structures during daytime (nighttime) in the left (right) panels of top, middle, and bottom panels for December solstices (December, January, and February) of 2006, 2007, and 2008. On contrary to the density struc-tures in September equinox of 2006, 2007 and 2008, only three-wave longitudinal structures are present in December solstices and the locations of nighttime structures are found to be at∼170◦W,∼20–40◦W,∼150◦E in 2006,∼170◦W, 20–40◦W,∼120–150◦E in 2007, and∼170◦W, 20–40◦W,
130–150◦E in 2008, respectively. Though the daytime
Fig. 3. Same as Fig. 2 but for December solstice in 2006, 2007 and 2008.
and the average locations of this structure is found to be at ∼140–150◦W,∼90–100◦W, 40–60◦E, 90–120◦E in 2006, ∼140◦W,∼90◦W, 0◦E, 90∼120◦E in 2007 and∼150◦W, ∼90◦W, ∼0◦E, 90–120◦E in 2008. It is obvious that the structure at 140–150◦W longitude during winter season of 2006 is seemed to merge with the adjacent one, that is lo-cated at∼90–100◦W, and the structure at 40–60◦E is not
present either in 2007 or 2008. The out of phase relation be-tween daytime and nighttime structures, particularly in the F-region, is also prevailed during this season in the same lines with the September equinox season.
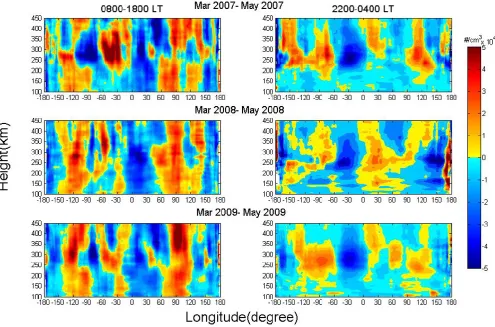
Figure 4 shows the longitudinal density structures for day-time and nightday-time in March equinox (March, April, and May) of 2007, 2008 and 2009. A striking feature from this figure that a clear four-wave structure during night-time is found in three years starting from∼250 km to top-side ionosphere and their respective locations are∼150◦W, ∼90◦W,∼20◦E,∼110–120◦E in 2007,∼150◦W,∼90◦W, ∼20◦E,∼130◦E in 2008, and∼140◦W,∼90◦W, ∼20◦E, ∼120◦E. On the other hand, the daytime densities are char-acterized with three-wave structures at ∼120◦W, ∼30◦W, ∼80–110◦E in year 2007 March equinox season while densi-ties during 2008 equinox season seem to have also character-ized with three-wave structures from 200 km to topside
86 P. S. Brahmanandam et al.: Electron density structures of equatorial E- and F-regions
Fig. 4. Same as Fig. 2 but for March equinox in 2007, 2008 and 2009.
Although the global patterns of the longitudinal F-region electron density have been extensively investigated, longi-tudinal variations of the vertical structures of electron den-sity in equatorial E- and F-regions simultaneously have not been well documented in literature and their day/night and seasonal variations are also not fully explored. More impor-tantly, the vertical structures are very essential to understand the physical mechanism that is responsible for these varia-tions. Keeping above in mind, we also present for the first time the day/night and seasonal variations of vertical elec-tron density structures of equatorial E- and F-regions simul-taneously during different seasons in three continuous years and discussed the observational results in the following lines concisely. As shown in Figs. 2 to 5, the daytime longitudi-nal structures are almost extended vertically throughout the E-region, while the nighttime structures are relatively weak and disorganized compared to the daytime structures. Over-all, as the daytime longitudinal structures in E-region are concerned, the wavenumber-4 patterns are discernible in De-cember solstice only. For the nighttime structures, relatively weak wavenumber-3 patterns are present in the December solstice, and wavenumber-4 patterns appear in the March equinox.
4 Discussion
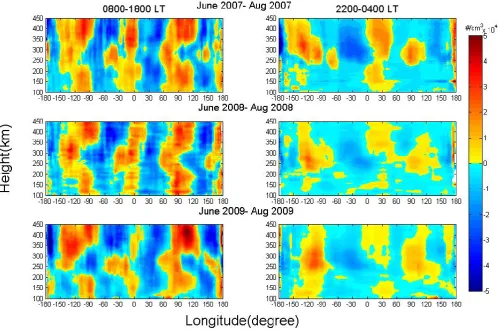
Fig. 5. Same as Fig. 2 but for June solstice in 2007, 2008, and 2009.
during December solstice of 2006, 2007, and 2008. More-over, Wan et al. (2008) reported that the wavenumber-4 pat-terns are weak in nighttime December solstice and intense in daytime June solstice and October equinox. However, our results show that the wavenumber-3 patterns are dominant in nighttime December solstice, but also prevalent in day and nighttime F-region in June solstices. The causes of the dis-agreements between present and other experimental results on the seasonal and day-night variations in the longitudinal patterns in E- and F-regions are not clear, and more data from other sources are needed to investigate these disagreements.
In general, an approximately 180◦out of phase relation be-tween the daytime and nighttime longitudinal electron den-sity structures is found in most part of the equatorial F-region above 200 km. This out of phase relation is also seen in the diurnal variation of the longitudinal TEC distributions in equatorial region (Wan et al., 2008), equatorialE×B drifts that measured with the ROCSAT-1 satellite (Kil et al., 2008), and equatorialE×Bdrifts that simulated with a theoretical ionospheric dynamo model (Ren et al., 2010). It is generally believed that the nonmigrating tidal waves play a critical role in the generation of the longitudinal electron density patterns in equatorial E- and F-region, which are excited in tropical
88 P. S. Brahmanandam et al.: Electron density structures of equatorial E- and F-regions that in neighboring region (Kil et al., 2007). Consequently,
the out of phase relation between the daytime and nighttime F-region longitudinal structures can be explained.
It is evident from the bottom panel of Fig. 5 that, ex-cept for their out of phase relation, the daytime longitudinal structure in longitudinal region 90◦W–150◦W for June sol-stice is nearly in phase with that for the nighttime structure. Note that the longitudinal wavenumber-3 patterns prevailed in June solstice, which can be induced by eastward nonmi-grating diurnal tide DE2 and semidiurnal tide SE1 (Kato, 1989; Forbes et al., 2008). Although TIMED/SABER mea-surements show that in average the amplitudes of SE1 are approximately 2 times smaller than those of DE2 in equato-rial E-region at 116 km, the former may occur intermittently at significant amplitude (Forbes et al., 2008). It follows that, because the in phase (out of phase) relation between day-time and nightday-time longitudinal wavenumber-3 structures is expected for SE1 (DE2) viewed in constant local time refer-ence frames with 12 h differrefer-ence, the observed in phase re-lation seems to suggest the dominance of SE1 over DE2 in June solstice in the longitudinal zone around 90◦W–150◦W.
5 Conclusions
On the whole, the day-night and seasonal variations in the vertical and longitudinal electron density structures are clearly revealed. In nighttime, the wavenumber-4 structures prevail in equinox seasons and the wavenumber-3 patterns are the dominant structures in solstice seasons in F-region although the nighttime structures in E-region below 200 km were relatively disorganized and irregular. In daytime, on the whole, the wavenumber-3 and 4 patterns govern the longitu-dinal structures in F-region in the March equinox, and June solstice and in September equinox and December solstice, respectively. It is also found that the longitudinal variations in daytime electron density have a tendency to be 180◦out of phase with those in nighttime electron density throughout F-region. This feature provides supporting evidence that the eastward nonmigrating diurnal tides DE2 and DE3 are very likely the main causes of the longitudinal wavenumber-3 and 4 structures in equatorial F-region.
Electrodynamics related to the DE3 tide investigated by Jin et al. (2008) using a numerical electrodynamical model for September equinox conditions and have reached to a con-clusion that the DE3 tide could able to generate perturba-tions in the F-region electric fields which produce eventually longitudinal four-wave structures. Though the scientific fra-ternity has come to a consensus on the role of DE3 in the generation of wavenumber-4 structures via dynamo mecha-nism and subsequent phenomena particularly during equinox epochs, the absolute and relative efficiencies of other tidal waves that we discussed in the present article in the mod-ulation of dynamo electric fields in order to produce the corresponding longitudinal structures in the F-region
iono-sphere yet to be determined which may be realized by using a realistic and tested dynamo model studies such as Hagan et al. (2007) and Jin et al. (2008) and through exhaustive seasonal longitudinal studies of ionospheric structures using available satellite measurements as well as future missions. Acknowledgements. This work was supported by the National
Space Program Office (NSPO) of the Republic of China under the grants 97NSPO (B)-SP-FA07-02 (A).
Topical Editor M. Pinnock thanks W. Wan and another anony-mous referee for their help in evaluating this paper.
References
England, S. L., Immel, T. J., Sagawa, E., Henderson, S. B., Hagan, M. E., Mende, S. B., Frey, H. U., Swenson, C. M., and Paxton, L. J.: The effects of atmospheric tides on the morphology of the quiet-time, post-sunset equatorial ionospheric anomaly, J. Geo-phys. Res., 111, A10S19, doi:10.1029/2006JA011795, 2006a. England, S. L., Maus, S., Immel, T. J., and Mende, S. B.:
Longitudinal variation of the E-region electric fields caused by atmospheric tides, Geophys. Res. Lett., 33, L21105, doi:10.1029/2006Gl027465, 2006b.
Forbes, J. M., Zhang, X., Palo, S., Russell, C., Mertens, J., and Mlynczak, M.: Tidal variability in the iono-spheric dynamo region, J. Geophys. Res., 113, A02310, doi:10.1029/2007JA012737, 2008.
Hagan, M. E. and Forbes, J. M.: Migrating and nonmigrating semi-diurnal tides in the upper atmosphere excited by tropo-spheric latent heat release, J. Geophys. Res., 107(D24), 4754, doi:10.1029/2001JD001236, 2002.
Hagan, M. E., Maute, A., Roble, R. G., Richmond, A. D., Immel, T. J., and England, S. L.: Connections between deep tropical clouds and the Earth’s ionosphere, Geophys. Res. Lett., 34, L20109, doi:10.1029/2007GL030142, 2007.
Immel, T. J., Sagawa, E., England, S. L., Henderson, S. B., Hagan, M. E., Mende, S. B., Frey, H. U., Swenson, C. M., and Paxton, L. J.: Control of equatorial ionospheric morphol-ogy by atmospheric tides, Geophys. Res. Lett., 33, L15108, doi:10.1029/2006GL026161, 2006.
Jin, H., Miyoshi, Y., Fujiwara, H., and Shinagawa, H.: Elec-trodynamics of the formation of ionospheric wavenumber-4 longitudinal structure, J. Geophys. Res., 113, A09307, doi:10.1029/2008JA013301, 2008.
Kato, S.: Non-migrating tides, J. Atmos. Terr. Phys., 51, 673–682, 1989.
Kil, H., Oh, S.-J., Kelley, M. C., Paxton, L. J., England, S. L., Ta-laat, E., Min, K.-W., and Su, S.-Y.: Longitudinal structure of the vertical ExB drift and ion density seen from ROCSAT-1, Geo-phys. Res. Lett., 34, L14110, doi:10.1029/2007GL030018, 2007. Kil, H., Talaat, E. R., Oh, S.-J., Paxton, L. J., England, S. L., and Su, S.-Y.: Wave structures of the plasma density and vertical E x B drift in low-latitude F-region, J. Geophys. Res., 113, A09312, doi:10.1029/2008JA013106, 2008.
electron density structures, Geophys. Res. Lett., 34, L11112, doi:10.1029/2007GL029265, 2007.
Ren, Z., Wan, W., Liu, L., Zhao, B., Wei, Y., Yue, X., and Heelis, R. A.: Longitudinal variations of electron temperature and total ion density in the sunset equatorial topside ionosphere, Geophys. Res. Lett., 35, L05108, doi:10.1029/2007GL032998, 2008. Ren, Z., Wan, W., Xiong, J., and Liu, L.: Simulated wave number
4 structure in equatorial F-region vertical plasma drifts, J. Geo-phys. Res., 115, A05301, doi:10.1029/2009JA014746, 2010. Sagawa, E., Immel, T. J., Frey, H. U., and Mende, S. B.:
Lon-gitudinal structure of the equatorial anomaly in the nighttime ionosphere observed by IMAGE/FUV, J. Geophys. Res., 110, A11302, doi:10.1029/2004JA010848, 2005.
Scherliess, L., Thompson, D. C., and Schunk, R. W.: Longitudinal variability of low-latitude total electron content: Tidal influences, J. Geophys. Res., 113, A01311, doi:10.1029/2007JA012480, 2008.
Schreiner, W. S., Sokolovskiy, S. V., Rocken, C., and Hunt, D. C.: Analysis and validation of GPS/MET radio occultation data in the ionosphere, Radio Sci., 34, 949–966, 1999.
Schreiner, W., Rocken, C., Sokolovskiy, S., Syndergaard, S., and Hunt, D. C.: Estimates of the precision of GPS radio occultations from the COSMIC/FORMOSAT-3 mission, Geophys. Res. Lett., 34, L04808, doi:10.1029/2006GL027557, 2007.
Wan, W., Liu, L., Pi, X., Zhang, M.-L., Ning, B., Xiong, J., and Ding, F.: Wavenumber-4 patterns of the total electron con-tent over the low latitude ionosphere, Geophys. Res. Lett., 35, L12104, doi:10.1029/2008GL033755, 2008.