SJSU ScholarWorks
Master's Projects Master's Theses and Graduate Research
Spring 2018
Sentiment Analysis using an ensemble of Feature
Selection Algorithms
Manankumar Bhagat San Jose State University
Follow this and additional works at:https://scholarworks.sjsu.edu/etd_projects
Part of theComputer Sciences Commons
This Master's Project is brought to you for free and open access by the Master's Theses and Graduate Research at SJSU ScholarWorks. It has been accepted for inclusion in Master's Projects by an authorized administrator of SJSU ScholarWorks. For more information, please contact [email protected].
Recommended Citation
Bhagat, Manankumar, "Sentiment Analysis using an ensemble of Feature Selection Algorithms" (2018).Master's Projects. 634. DOI: https://doi.org/10.31979/etd.xg3j-fty7
Sentiment Analysis using an ensemble of Feature Selection Algorithms
A Project Report Presented to Dr. Robert Chun
Department of Computer Science San Jose State University
In Partial Fulfillment of the Requirements for the Class
CS 298
By
Manankumar Bhagat May. 2018
i
2018 Manankumar Bhagat ALL RIGHTS RESERVED
ii
The Designated Project Committee Approves the Project Titled
Sentiment Analysis using an ensemble of Feature Selection Algorithms By
Manankumar Ramchandra Bhagat
Approved for the department of Computer Science
San Jose State University
May 2018
Dr. Robert Chun Department of Computer Science Dr. Katerina Potika Department of Computer Science Mr. Rhydham Joshi Software Developer, Microfocus
iii
ABSTRACT
To determine the opinion of any person experiencing any services or buying any product, the usage of Sentiment Analysis, a continuous research in the field of text mining, is a common practice. It is a process of using computation to identify and categorize opinions expressed in a piece of text. Individuals post their opinion via reviews, tweets, comments or discussions which is our unstructured information. Sentiment analysis gives a general conclusion of audits which benefit clients, individuals or organizations for decision making. The primary point of this paper is to perform an ensemble approach on feature reduction methods identified with natural language processing and performing the analysis based on the results. An ensemble approach is a process of combining two or more methodologies. The feature reduction methods used are Principal Component Analysis (PCA) for feature extraction and Pearson Chi squared statistical test for feature selection. The fundamental commitment of this paper is to experiment whether combined use of cautious feature determination and existing classification methodologies can yield better accuracy.
iv
ACKNOWLEDGEMENTS
I stretch out my appreciation to my advisor Dr. Robert Chun and my board of committee Dr. Katerina Potika and Mr. Rhydham Joshi for supporting me throughout my Masters of Science project desertation and helping me whenever I needed guidance. Their experience on various subjects assisted me in learning numerous industry practices while actualizing my decisions. Without their guidance, it would not have been a conceivable task to finish this venture.
v
Contents
1. INTRODUCTION ... 1
1.1. Importance and Aim of the project ... 1
2. BACKGROUND ... 2
2.1. Data cleaning ... 3
2.2. Data Preprocessing and Feature Reduction ... 4
2.2.1 N-grams and Bag of words (BoW) ... 4
2.2.2 Part of speech (PoS) ... 4
2.2.3 Latent Dirichlet allocation (LDA) ... 5
2.2.4. Feature Reduction Methods ... 5
2.2.4.1 Feature Selection: ... 5
2.2.4.2 Feature Extraction: ... 6
2.3. Classification approaches ... 7
2.3.1 Machine learning approach ... 7
2.3.2 Lexicon based approach ... 8
2.3.2.1 WordNet ... 8
3. RELATED WORK... 9
4. PROPOSED APPROACH ... 10
4.1. Objective ... 10
4.2. Main Motivation ... 10
5. TOOLS AND DATASET ... 12
5.1. Python libraries: ... 12
5.1.1 NLTK ... 12
5.1.2 Sklearn machine learning ... 12
5.2. Dataset Description ... 12
6. IMPLEMENTATION AND ANALYSIS APPROACH ... 14
6.1. Data Exploration and Preparation ... 14
6.2. Data Preprocessing and Transformation ... 14
6.2.1 Tokenization ... 14
6.2.2 Filtering ... 14
6.2.3 Stemming ... 15
6.3. Data Modeling ... 15
6.4. Data Visualization and Presentation ... 16
vi
7.1. LDA Exploratory data analysis ... 17
7.2. Feature Reduction and Machine learning algorithm- Bernoulli Naïve Bayes ... 17
7.2.1 Feature Extraction using PCA ... 18
7.2.2 Feature selection ... 21
7.2.3 Experiments with ensemble of feature extraction and feature selection ... 24
8. CONCLUSION... 28
9. FUTURE WORKS ... 29
vii
TABLE OF FIGURES:
Figure 1: Sentiment Analysis Process Flow ... 3
Figure 2: Snapshot of Data ... 13
Figure 3: Exploratory Analysis using LDA ... 17
Figure 4: Classification report of using PCA=250 ... 18
Figure 5: Normalized Confusion matrix of the model using PCA=250 ... 19
Figure 6: Classification report of using PCA=300 ... 19
Figure 7: Normalized Confusion matrix of the model using PCA=300 ... 20
Figure 8: Classification report of using Chi Squared Test, Top k=5000 ... 21
Figure 9: Normalized Confusion matrix of the model using Chi Squared Test, Top k=5000 ... 22
Figure 10: Classification report of using Chi Squared Test, Top k=7500 ... 22
Figure 11: Normalized Confusion matrix of the model using Chi Squared Test, Top k=7500 ... 23
Figure 12: Classification report of using PCA=250 and Chi Squared Test, Top k=7500... 24
Figure 13: Normalized Confusion matrix of the model using PCA=250 and Chi Squared Test, Top k=7500 ... 25
viii
LIST OF TABLES:
Table 1: Analysis of the results from PCA algorithm ... 20 Table 2: Analysis of the results from Feature selection using Chi Square Statistical test ... 23 Table 3: Analysis of the results comparing ensembled model with standalone models using Naïve Bayes ... 25 Table 4: Analysis of the results comparing ensembled model with standalone models using Logistic Regression………..………26 Table 5: Analysis of the results comparing ensembled model with standalone models using Decision
1
1. INTRODUCTION
1.1. Importance and Aim of the project
Internet is amongst the most rapidly developing technologies and has become an essential part
in today’s world. Data on internet varies from areas like academics, criticism or conclusion about items, remarks on social issues and so forth. Individuals regularly communicate, examine and share data via web. It helps individuals to compare and settle on choice in numerous things. Large number of individuals dependably tune into other’s assessment before making any choice of the service. For instance, in a case of preference for watching a movie, fairly large number of individuals prefer to select a movie based on reviews or ratings given by other individuals. Various organizations gather data through their websites and the data which is assembled is analyzed to decide the sentiment behind it. One such example is e-commerce where before buying any item, people prefer to check the item review and ratings by other customers. The project exhibits strategies to analyze the reviews and extract their sentiment. The fundamental goal is to anticipate the sentiment of a review by performing and analyzing a group of feature reduction methodologies. This paper also attempts on extracting compelling features that can give better outcome.
2
2. BACKGROUND
Sentiment analysis is sometimes called opinion mining, a method to process Natural language. Natural language Processing(NLP) is identified with territory of machine-human cooperation. Sentiment analysis can be termed as an errand of recognizing the survey’s opinion. The
conclusion might be classified as negative, nonpartisan, or positive extremity. Sentiment analysis can be classified into three diverse as sentence level, document level, and entity-aspect level. In a sentence level, a supposition of specific sentence is considered as a priority for sentiment prediction. Whereas, document level is a more generalized feeling which considers the whole document for sentiment prediction. And if the focus is straightforwardly on the opinion itself then it can be termed as an entity-aspect level sentiment analysis. [1]
The databases are inflating enormously because of the vast collection of data electronically. Information retrieval is the procedure of extracting important information regarding data from a larger collection of data in the databases. Naïve Bayes, Logic Regression, and Support vector machine are the most used machine learning algorithms for prediction of sentiment. The analysis of a sentiment faces a couple of arguments during its investigation. Classification accuracy is the major issue. This gives a motivation for acquiring a good classification precision picking great feature determination, preprocessing along with order procedures.
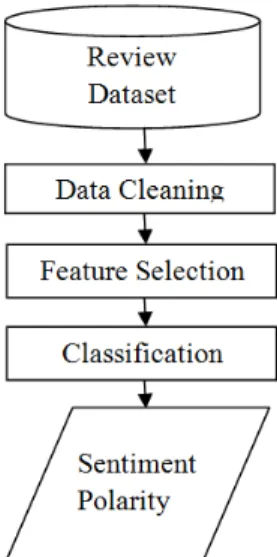
Process of Sentiment analysis is shown in figure 1. Customer’s opinion is posted on websites,
blogs or forums. The data format of the customer’s opinions is unstructured and messy. At the first place, the unstructured data is changed over into organized frames. After that point, features are extracted from that organized frames utilizing feature selection strategy. The last step of the analysis goes with the classification algorithm for predicting the sentiment of the records.
3
Figure 1: Sentiment Analysis Process Flow
The below section presents an overview of each components which would be a part of the analysis:
2.1. Data cleaning
Special character removal and stop word expulsion strategy has been performed in [2]. New lines, unwanted punctuations, and stemming is likewise executed as a piece of preprocessing strategy [3]. Tokenization [4] separates given text into tokens. Natural language processing tool kit (NLTK) is utilized as a part of numerous existing papers using python to preprocess the dataset. NLTK is a python library for solving various text analytics and natural language processing tasks.
The following different strategies forms pieces of the preprocessing step, as a part of sentiment analysis:
• Conversion from upper case to lower case letter, expel undesirable punctuations and additional white spaces, and evacuate newline and special characters.
• Stemming, a process to reduce inflected or morphological word forms to their base form or root form i.e. word stem is used to reduce the total number of unique words in the dataset. Porter Stemming algorithm is an algorithm to expel suffixes from English words. Porter stemmer is most broadly utilized algorithm for stemming words.
4
2.2. Data Preprocessing and Feature Reduction 2.2.1 N-grams and Bag of words (BoW)
N-gram, Bigram and Unigram features are utilized for getting the features in [1]. Unigram with the BOW model delivers the most promising features in comparison with the other N-gram techniques. It is shown that the Unigram methodology combined with stemming as a preprocessing step and excluding stop words yields good results in comparison with all other possibilities. [3]. The terminology, Unigram feature states of taking single word as a single feature from the text corpus. A text corpus is a bag full of words comprising from the dataset. On the other hand, Bigram features are considered as a pair of continued twofold words as a feature. In the same fashion, selecting “n” continue features from the text corpus is named as N-gram feature.
TF-IDF Vectorizer and CountVectorizer are considered as well-known techniques for feature selection elaborated in [2]. CountVectorizer just counts the word frequencies. With the TF-IDF Vectorizer, the value of the word in the corpus increases proportionally to the number of count but it drastically decreases if the frequency of word increases in the corpus. For normalizing the end results, TF-IDF is used. To balance most and least weighted word, TF-IDF score needs be taken into consideration [2]. TF-IDF is utilized to choose feature from high dimensional data. [3]
2.2.2 Part of speech (PoS)
The procedure towards assigning tags to the corresponding text is called Part of speech tagging method. It is utilized to label the word using different taggers already available in form of libraries such as Stanford tagger NLTK (natural language toolbox) tagger and Penn Treebank POS tagger. English as a language consists 9 types of speech. There are around 50 to 150 labels on the off chance that we consider all labels [4]. In [4], Bigram, Unigram and Unigram with PoS tagging techniques has been utilized considering it to be a major aspect of feature extracting procedures to enhance the precision level.
5
2.2.3 Latent Dirichlet allocation (LDA)
Topic analysis from a collection of raw data is currently attaining attention in the field of text analytics applications. The approach of detecting the latent information in a corpus of words is termed as a topic model. LDA is an unsupervised method of doing a probabilistic topic modeling. The feature representation model works in a fashion by assuming that each collection of data falls into different subjects. The main motive of the model is to testify each word according to their likelihood distributions across the document with variations in the parameters of the model. This will make every word to fall into different distribution of words called topics. [5]
For a given corpus w, every single word wt of it is accepted to have been organized by a latent topic zt. The topics are created from a document-specific distribution over the T number of topics given as a parameter to the model. [6]Topic modelling can be used as an exploratory data analysis technique to see the distribution of words over various topics.
2.2.4. Feature Reduction Methods
In machine learning and text mining, a feature is a quantifiable property of a phenomenon being observed. Choosing and discriminating independent features is critical to any text mining calculation that hopes to be effective in classification. In genuine applications generally, tens of thousands of features are estimated, while only an extremely small percentage of them convey valuable information towards our learning objective. Subsequently, we typically need an algorithm that compresses our feature vector and reduces its dimension.
Two groups of techniques which can be utilized for dimensionality reduction are: 1) Feature selection
2) Feature extraction
2.2.4.1 Feature Selection: Selecting a subset of the existing features without a transformation. For any given dataset, many conceivable features can be chosen. An important point to consider is which features to utilize. Even in the event that we limit ourselves to the space of common transformations for a given dataset, we are still often left with thousands of conceivable features.
6
In any case, in all actuality, the algorithms don't function admirably when they ingest an excessive number of features.
There are numerous feature selection algorithms that convert a set with an excessive number of features into a manageable subset. The main objectives of the data scientist must be accounted for also when choosing the feature selection algorithm. Without great features, it doesn't make any difference what the algorithm selects. Selecting the most predictive features from a huge space is precarious. The more training examples we have, the better the model can perform; however, the computation time will increase.
Pearsons Chi Squared Test:
The Pearson's chi-squared test (X2) is a measurable and prominent statistical strategy tested to
ascertain the chi-squared statistics measurement which looks like a standardized aggregate of squared deviations amongst watched and hypothetical frequencies. It is reasonable for unpaired(independent) information from huge samples. The chi-squared measurement would then be able to be utilized to ascertain a p-value to the data points after making a comparison of the measured values with the chi-squared distribution. Features with the top p-value scores can be considered as great features for grouping.
2.2.4.2 Feature Extraction: It is a process of transforming the current features into a lower dimensional space. Feature extraction varies essentially from Feature Selection approaches; be that as it may, its inspiration is to diminish the list of feature measure. This approach does not measure terms, remembering the ultimate objective to discard the lower weighted ones. Principal Component Analysis is an eminent strategy of feature reduction. Its point is to take in a discriminative transformation matrix to lessen underlying component space making it to a lower dimensional, remembering the true objective to diminish the many-sided quality of the grouping errand with no exchange off in terms of the accuracy of the model. Eigenvectors are the mathematical reason behind the transformation of the dimensions. [7]
7
2.3. Classification approaches
Machine learning and lexicon-based approaches are two the types of classification approaches. Lexicon-based approach is also classified into 2 categories, corpus-based and dictionary-based approach. The corpus-based approach classifies words by considering the bunch of words as word list. Furthermore, the Corpus based is classified as semantic and statistical approach. The semantic approach uses terms to represent in semantic space for finding relationship in terms. The approach using statistical terms identifies the sentiment by utilizing the co-occurrences of words. The approach using dictionary as a collection of words helps the sentiment to be classified using the antonym and synonym of the words from WordNet, a lexical dictionary. [4]
The second most popular classification approach is using Machine learning(ML) algorithms. Supervised learning and Unsupervised learning are the two main types of ML algorithms. Supervised classification algorithms are the classifiers which can be a decision tree classifier, linear classifier, probabilistic classifier, or rule-based classifier. The supervised learning works in a fashion in which it relies on labeled dataset as a training model input. This model is then used to predict the test dataset for performing classification. While the unsupervised learning algorithms works on an unlabeled training model input. The main motive is to find patterns and get inferences which help to understand the nature of the dataset. The procedure of sentiment classification with machine learning goes with the first step being extracting the compelling features and forming an input for the ML algorithm. And the second step is to apply the ML algorithm to create a model for classification and prediction.
2.3.1 Machine learning approach
This part consists of some previous work results of applying machine learning algorithms. Naïve Bayes and Support Vector Machine (SVM) algorithms are utilized for classification, and it has been shown that Support Vector Machine performs better to Naïve Bayes. [2] LIBSVM is a library of SVM which works on a linear kernel. It performs superior in comparison with the other four kernels of SVM [4]. Bag of words demonstrated with SVM algorithm delivers great outcome [4].
8
2.3.2 Lexicon based approach
Lexicon based approach follows its procedure on the basis of semantic orientation. Semantic orientation of expressions is determined as positive on the off chance that it is more identified
with "best” and is considered to be negative in the event that it is more identified with "poor". There are certain hard coded allocations given by the algorithm to the respective words for example the negative word has been given a -1 value. In the same way, the word with a positive polarity has been given a +1 value. A neutral word is allocated a null value i.e. a numerical zero. Apart from it, weak positive and weak negative has been given +0.5 and -0.5 values each. These values are called as semantic orientation scores. The algorithm identifies the synonyms of the words by using calculated scores and WordNet. The algorithm compares each word feature with other features of the dataset according to their scores and the features with the relative scores are clustered. [4]. There are two functions in the algorithm namely Sentence Sentiment Scoring Function (SSSF) and Sentiment Aggregation Function (ESAF). The semantic orientation score for every entity is distinguished by SSSF. And, ESAF ascertains the aggregate sentiment scores for an entity.
2.3.2.1 WordNet
WordNet is a database of English dictionary in which each word is related with one another by the means of a link. For the most part, WordNet is utilized to verify the comparability with words and to score sentiment orientation calculation. WordNet acquires linked words with the help of semantic relations such as antonym, synonym, hyponym, meronym, and so forth. [8]. The procedure begins with finding the synonym of all the features from feature vector list. Descriptive words can be scored with WordNet that helps in classifying extremity. WordNet has approximately 166,000 sense pairs and word forms. A string of ASCII characters represents the
9
3. RELATED WORK
This section explains what the existing methodologies are and what endeavors have been taken by others for a better feature selection technique.
• Pang et al. [9] analyzed movie reviews by using different machine-learning techniques to determine if it will be as powerful as various other classification techniques to classify sentiments. By varying input features, the best classification accuracy scores around 77%.
• A model proposed by Pak and Paroubek (2010) [10] to order the tweets as negative, positive and objective. They compiled a twitter tweet dataset using Twitter API and automatically annotating emoticons to those tweets. Using that dataset, they built an algorithm to classify sentiments in view of the multinomial Naive Bayes technique that utilizes N-gram features. But as the dataset contained only tweets having emoticons, the training dataset they utilized was less efficient.
• Barbosa et al. (2010) [11] created a 2-stage programmed analysis technique to classify tweets. It characterized certain tweets as target in the first step and the second stage was to classify those tweets as negative or positive.
• Turney et al. [12] utilized BOW technique which is a technique where a document is represented as only a word collection disregarding the word relations. The sentiment behind each word was determined and then the sentiment for the entire document sentiments was determined using functions for aggregating.
• Kamps et al. [8] utilized the lexical database WordNet to evaluate the emotional opinion behind a word along various dimension. Using WordNet, a distance metric is calculated and used to determine extremity of descriptive words.
10
4. PROPOSED APPROACH
The main point of the paper is to find compelling features which give better outcome and likewise give better feature extraction strategy.
4.1. Objective
An ensemble of bag of words (BoW) along with TF-IDF vectorizer for word frequency and weighting, integrated with combined features from a feature extraction methodology and for sentiment classification, a feature selection method along with Machine learning would outperform other traditional bag of words model for predicting sentiments. Latent Dirichlet Allocation (LDA) for topic modelling is used for exploratory data analysis. A comparative analysis of 3 feature reduction methods are done i.e. a model with standalone feature extraction method PCA, a model with standalone feature selection method Pearson’s Chi Squared test and a model
with the ensemble of the features extracted from both the methods.
4.2. Main Motivation
• Motivation behind Bag of Words: BOW model is the most prevalent text mining methodology used for sentiment prediction. Unigram along with BOW create better feature set compared to other N-gram strategies. A BOW model with Unigram features is considered for the project.
• Motivation behind Latent Dirichlet Allocation (LDA): LDA, a technique to model topics gives an idea of the distribution of words over different contextual topics of the text corpus on the basis of their probability of occurrences. A generic idea of the most probable words over different topics can be known which is the most basic step is during data exploration. LDA is used to infer the domain knowledge from the vast amount text data.
• Motivation behind Feature Reduction methods: Text classification of a corpus is predominantly implemented having the BOW model. This model utilizes words in the provided set to perform the classification. A major issue of the BoW model is the amount of unique words contributing to the entire corpus can be amazingly vast. The use of such substantial high number of features faces challenging problems towards the accuracy of
11
the model using various algorithms. In this way, a minimized corpus is a necessity to enhance the performance of the algorithms. Thus, in variance to past methodologies instead of using only BoW extracted features, the impact of using an ensemble of PCA which is a dimensionality reduction method with some original features selected on the basis of Chi Squared statistical test can be experimented and researched.
• Motivation behind Machine Learning: Research in the areas of data mining and knowledge discovery has shown quick development in past years, driving on the immense advances in computer hardware and programming methodology. Text mining is developing even today from merging of assorted fields, for example, machine learning, Statistics and so forth, demonstrating its versatile and synthesizing nature.
Machine Learning (ML), an artificial intelligence sub field tries to pre-define a way for getting inferences from the data and develop a capacity to predict future data patterns. Machine learning means investigating techniques and algorithms for extracting information consequently. Today, we have many machine learning algorithms utilized as a part of text mining.
The fundamental motto of using ML models can be described as follows.
ML models are often show substantially high accuracy than human-made standards in data oriented problems as for many humans it is often difficult to express what they know. The second main reason of its usability is that the model doesn’t need a human
expert or programmer because it works on a programmed strategy to look for theories explaining information. On the contrary, ML models apart from being cheap and adaptable can be easily applied on any task that involves learning progressively.
A few disadvantages of ML models are as follows:
• It needs a great deal of labeled data
• It is error prone
12
5. TOOLS AND DATASET
To accomplish the desired outcome, Python as a programming language and SQLite for dataset storage were utilized as a part of the implementation. The tools and the dataset are open source so it can be easily utilized by scientists or developers.
5.1. Python libraries: 5.1.1 NLTK
Natural Language Processing is sub-field of software engineering, computerized reasoning and linguistics which goes for use of computers to understand any natural language.
Many text mining algorithms make extensive use of NLP methodologies for different kinds of linguistic analysis such as grammatical feature tagging and syntactic parsing.
NLTK provides a platform in order to implement Python scripts related to data pertaining to natural language. It reliably provides interfaces for many collection of words databases as well as with various lexical resource for instance, WordNet. NLTK is best suitable for many professionals including but not limited to linguists, engineers, educators and researchers. It is available on various Operating System platform like Windows, Linux, and Mac OS X. Best feature of all is that NLTK is an open source and free for all. [13]
5.1.2 Sklearn machine learning
Sklearn is a python library consisting of varied topics on data science. There are a vast number of application of this library which includes data preprocessing, along with feature reduction, model evaluation, classification, regression, clustering and so forth.
5.2. Dataset Description
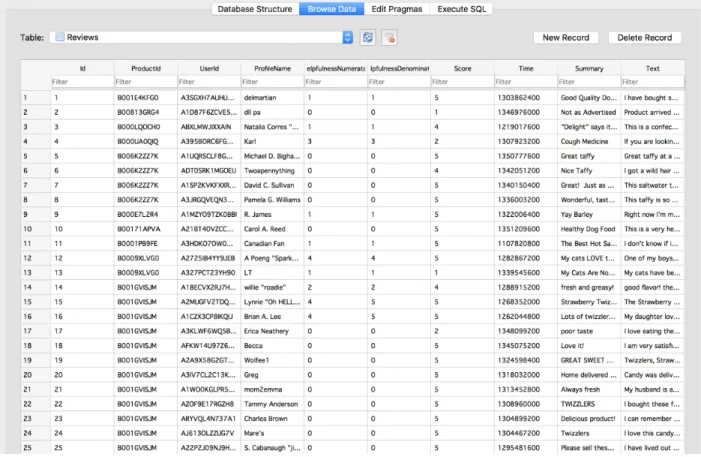
The Amazon Fine Food Reviews dataset is a vast dataset having 568454 reviews about fine food products from Amazon. The reviews have been written by reviewers over a span of 10 years. The source of this data is kaggle.com and was originally published on Snap. We have a SQLITE data file named database.sqlite for the dataset. Each record in the dataset comprises of nine columns
13
but among them the column consisting user information, product information, review, review summary and ratings are considered as the main features.
The following is a snapshot of the dataset viewed in SQLite.
Figure 2: Snapshot of Data
The project mainly focuses on the important features namely ‘score’, ‘summary’ and ‘text’
which are the ones that can be used in building the prediction model for sentiment
classification. From the features “summary” and “text”, one can use either of it for prediction.
In this paper, the “summary” is used instead of “text” to avoid computational deficiency. The value of Score are basically the ratings that ranges from 1 to 5 and Summary has text reviews of each product in it. Score will be the target variable. Data cleaning techniques should be applied on the dataset for removing missing values and preprocessing the data.
14
6. IMPLEMENTATION AND ANALYSIS APPROACH 6.1. Data Exploration and Preparation
The mean of all the scores is 4.18. So, to initiate and distinguish the ratings into two sentiments i.e. positive and negative, it is assumed for all reviews having score above 3, i.e. 4 and 5 can be considered as positive and the rest are considered as negative having a value of 3 or below. That is the first step for performing a binary sentiment classification.
6.2. Data Preprocessing and Transformation
This step is applied for getting ready the raw input data which is in text format to preprocess
and transform it in a format that is reliable as an input to machine learning algorithms. Several
data preprocessing techniques were performed on the dataset after splitting it into training and testing sets on a test ratio of 0.2.
The main data preprocessing steps are Tokenization, Filtering, Lemmatization and Stemming.
6.2.1 Tokenization
The process of breaking a sentence into words is called tokenization. The words that fall out after the process are termed as tokens. The formation of list of tokens is the first step of any text analytics problem which is then utilized in the further preprocessing step.
6.2.2 Filtering
The process of evacuation of unwanted words or a portion of words from a list of tokens is termed as Filtering. Stop-words removal is a common filtering method. Common stop words include
‘the’, ‘is’, ‘at’, ‘on’ and so forth. Likewise, words occurring frequently in the text can be proposed to have little information to distinguish different documents, and in the same way, words occurring rarely can also be considered as least important pertaining to model prediction.
15
6.2.3 Stemming
Stemming strategies go for obtaining the base of the words.
After preprocessing the data, a bag of words (tokenization, counting and normalization)strategy is used along with a Term-doc incidence matrix using term frequency and inverse document frequency (TF-IDF). In a BOW strategy, documents are described by the frequency of words appeared in the document and it completely ignores the positions of the other words in the document.
The weighted word frequencies are determined by TF-IDF method. Term Frequency and Inverse Document Frequency is one of the most favored methods of determining the weighted word
frequency as it skips all the stop words like ‘the’, ‘is’, ‘of’, ‘an’, ‘on’, and so forth, while determining the word frequencies. These words constitute the most frequent words in the text but have no importance to sentiment analysis. The word ‘the’ constitutes much of any text, but has no significance for an analyzer. TF-IDF method ignores these words, and hence, it can determine important word frequencies easily. TF-IDF of a word is the product of term frequency and inverse document frequency of a word.
The vocabulary of the summary will be the new feature set of the dataset. It is approximately 27795-word features for the current dataset. A sample of the dataset is taken to lower the time computation of the analysis. A sample of 50000 reviews is taken which comprises approximately 9288-word features. LDA is used to infer the distribution of most probable words under different topics
6.3. Data Modeling
Machine learning algorithms: The project implements a Bernoulli Naïve Bayes machine learning algorithm. Bernoulli Naïve Bayes is a simple probabilistic classifier that works best when the features are independent of each other. It is a very popular method of text classification and uses word frequency as its features. In the current set of problem, for determining a sentiment polarity into a positive or a negative sentiment, the Bernoulli Naïve Bayes is considered as one of the best algorithm that can be used for a binomial classification problem.
16
6.4. Data Visualization and Presentation
In the current project, a classification report and confusion matrix are utilized to compare the results. A classification report is a text report of the various classification metrics such as Accuracy, Precision, Recall, f-1 score and so forth. A confusion metrics is a visualization graph that shows the performance of the classification model. Its comprises of 4 terms as follows:
The True positives (TP) are the cases which correctly predicts positive labels as positive. The True negatives (TN) are the cases which correctly predicts negative labels as negative. The False positives (FP) are the cases which incorrectly predicts negative labels as positive. "Type 1 error."
The False negatives (FN) are the cases which incorrectly predicts positive labels as negative. "Type 2 error."
17
7. Experiments and Results
This section presents several experiments and the analysis results obtained during various use cases of the implementation. After performing the required preprocessing steps on the dataset and applying the Bag of Words strategy on it, a document term matrix containing distribution of word features with its frequency in the dataset is generated. The First step of the experiment is to test an exploratory analysis technique using LDA to find the most probable word distribution on different topics.
7.1. LDA Exploratory data analysis
Figure 3: Exploratory Analysis using LDA
Figure 3 shows the word distribution over 10 topics on the basis of their probability of occurrences. For each topic, top 10 words are shown. As the dataset is a Food review dataset, it clearly states that the topics are comprised of the food items along with some affirmative and negation words. It is a good basic way to grab domain knowledge about the dataset. The LDA model is prepared after the preprocessing steps on the dataset.
7.2. Feature Reduction and Machine learning algorithm- Bernoulli Naïve Bayes
The second important step for the analysis is to apply the feature reduction methodologies on the preprocessed dataset. The project intends to research on the impacts of Principal Component Analysis (PCA) as a feature extraction method and Pearson’s Chi Square test as the feature
18
dataset of word features for a sentiment classification problem. For the project, we will be using Bernoulli Naïve Bayes machine learning algorithm for classification.
Below are some experiments results based on using PCA only as feature reduction method.
7.2.1 Feature Extraction using PCA
PCA algorithm takes a manually supplied input for the number of dimensions. The high dimensional word feature set comprises into the number of dimensions given as a parameter which forms an output of the algorithm. The dimensions will work as the new features for the dataset. The machine learning algorithm will be applied on the new processed dataset. The model will give different accuracy results for different number of dimensions. Below are the two best results obtained on the basis of experiments for different number of dimensions of PCA.
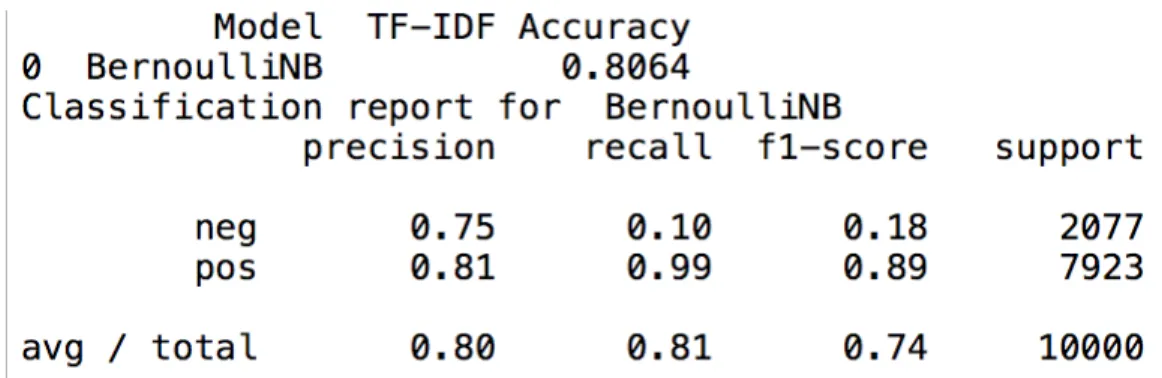
For a number of PCA components=250
19
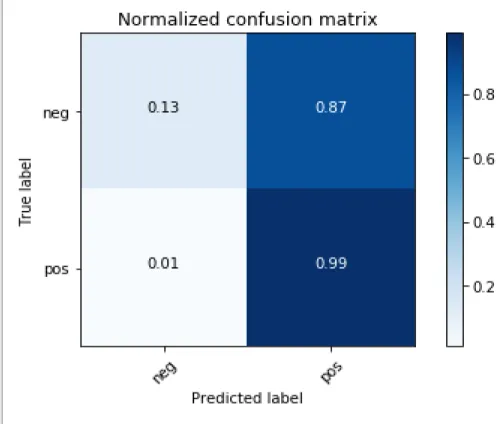
Figure 5: Normalized Confusion matrix of the model using PCA=250
For a number of PCA components=300
20
Figure 7: Normalized Confusion matrix of the model using PCA=300
Analysis of the results:
Accuracy True Positive True Negative False Positive False Negative PCA=250 80% 0.99 0.10 0.90 0.01
PCA=300 79% 0.99 0.13 0.87 0.01
Table 1: Analysis of the results from PCA algorithm
The results show that the model gives a very high value of type1 error i.e. False Positive which decreases the True negative values of the results. The above analysis states that 90% of the reviews are falsely predicts the originally negative reviews as positive reviews. Due to this, the model achieves a low value of True negative i.e. predicting negative reviews for negative
21
reviews in original. The model gives a spectacular True positive value of 99% truly predicting an originally positive review as a positive review.
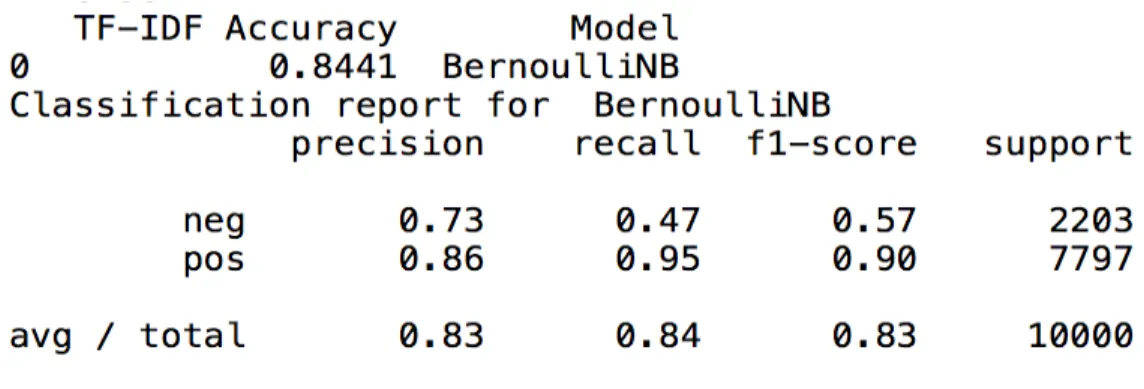
7.2.2 Feature selection
This part shows analysis using Chi Square Statistical test as the feature selection methodology. The statistical test gives a p-value for each feature. The features with high scores of p-values are selected as the features of the dataset. Multiple number of features need to be tested for gaining a model with high accuracy. After selecting the specific number of features, the machine learning algorithm is applied on the processed dataset. Below are the two best results obtained from experimenting different values of top highly scored selected features. The main aim of this algorithm is to decrease the high dimensional dataset into a little lower dimension on the basis of the Chi Square Statistical test.
Top K features for Chi Squared Statistical test: K=5000
22
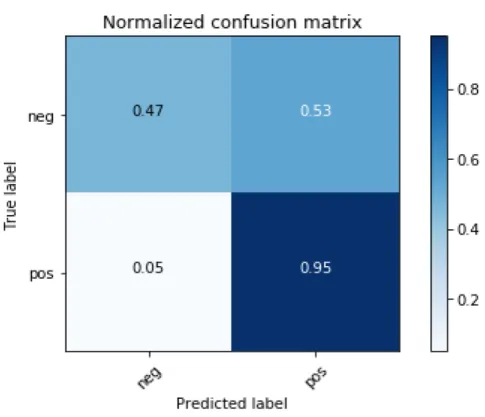
Figure 9: Normalized Confusion matrix of the model using Chi Squared Test, Top k=5000
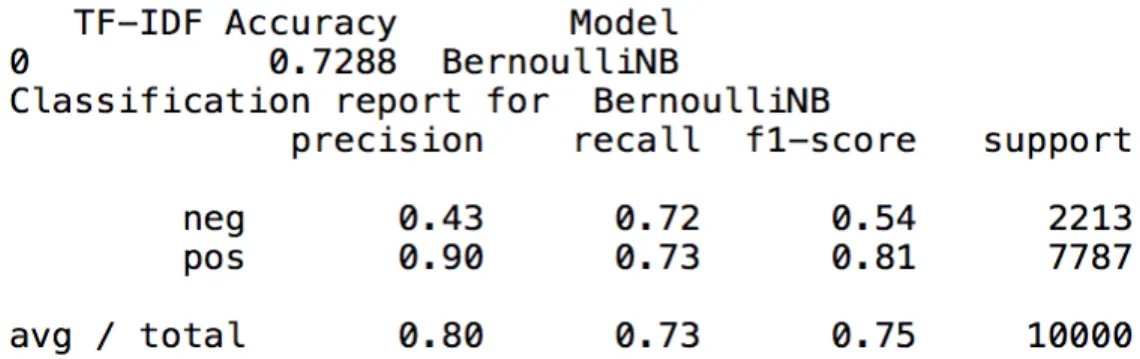
K=7500
23
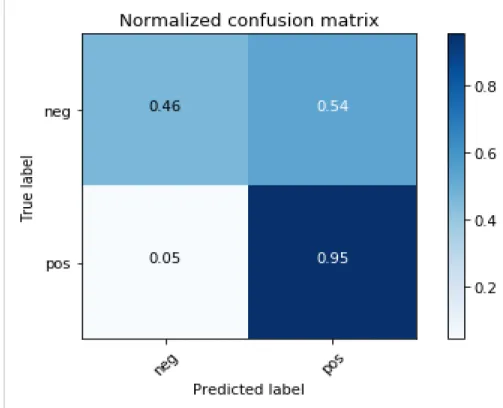
Figure 11: Normalized Confusion matrix of the model using Chi Squared Test, Top k=7500
Analysis of the results:
Accuracy True Positive True Negative False Positive False Negative K=5000 84% 0.95 0.47 0.53 0.05
K=7500 84% 0.95 0.46 0.54 0.05 PCA=250 80% 0.99 0.10 0.90 0.01
Table 2: Analysis of the results from Feature selection using Chi Square Statistical test
Table 2 shows the comparison between the results obtained using PCA algorithm and results obtained using Chi Square Statistical Test. The results show that the accuracy of the model is 84% which is better in comparison to the model with PCA algorithm. The False positive value goes down by 36% and the True negative goes up by 36% which states that it predicts the negative reviews as negative better than PCA algorithm. This gives a head start and the main motivation
24
to achieve the best traits of both by applying an ensemble of the algorithms. Thus, achieving better True Positive values from the model with PCA algorithm and a better value of True negative from the model with feature selection using Chi Square Statistical Test.
7.2.3 Experiments with ensemble of feature extraction and feature selection
The main motive of this experiment is knowing of the impacts of the algorithms that are going to be ensembled for feature reduction. The impact of PCA algorithm is getting all the features of the dataset into a comprised dimension considering the importance of all the features of the high dimensional dataset. By using the feature selection, a number of features based on a statistical test are acquired. While using PCA, a requirement of squeezing a high dimensional dataset into a low dimension is fulfilled. But on the other side, their might be a possibility of missing some important original features for training the model. In that case, an ensembled model with both the feature reduction techniques as PCA and Chi Square statistical test can be experimented and compared with the standalone models using just PCA or Chi Square statistical test as feature reduction methods. The best parameter values of both the algorithm from the above experiments are taken as input parameter for the ensembled method which will consider the PCA dimensions as well as the top selected features concatenated as input features for the machine learning algorithm. Below are the results of the experiment.
PCA components=250 and K=7500
25
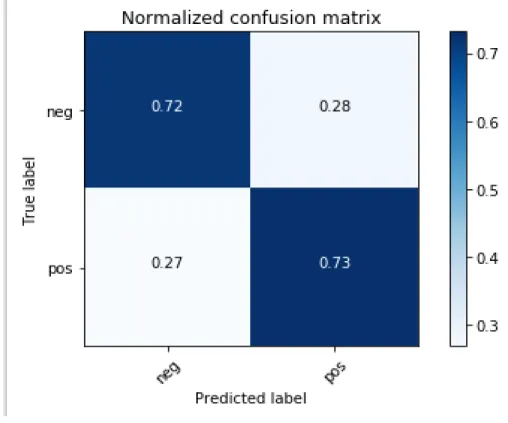
Figure 13: Normalized Confusion matrix of the model using PCA=250 and Chi Squared Test, Top k=7500
Analysis of the results, Bernoulli Naïve Bayes:
Accuracy True Positive True Negative False Positive False Negative PCA=250 80% 0.99 0.10 0.90 0.01
K=7500 84% 0.95 0.46 0.54 0.05 PCA=250 + K=7500 72% 0.73 0.72 0.28 0.27
Table 3: Analysis of the results comparing ensembled model with standalone models using Naïve Bayes
Table 3 shows a comparison between three different models consisting a standalone PCA, a standalone Chi Square Statistical test as Feature selection method and an ensemble of both methods. The accuracy of the ensembled model is 72% which is fairly low comparatively. By comparing the best results of the standalone models with the ensembled model, we can see that the value of True Positive goes down by 26% in comparison to PCA model. On the other hand,
26
the value of True Negative increases by 26% in comparison to the feature selection model (Chi Square). In the same fashion, the value of False positive (type1 error) decreases by 26% but the value of False Negative (type2 error) increases by 26%. The main assumption behind using an ensembled model is to increase the True Negative value which predicts the originally negative review as a negative review and the model successfully does the required. But on the contrary, it decreases the True Positive value which predicts an originally positive review as a positive review which affects the overall model accuracy.
More Comparative Analysis Results for Different Machine Learning Algorithms: Analysis of the results, Logistics Regression:
Accuracy True Positive True Negative False Positive False Negative PCA=250 83% 0.97 0.32 0.68 0.03
K=7500 85% 0.94 0.55 0.45 0.06 PCA=250 + K=7500 84% 0.93 0.56 0.44 0.07
Table 4: Analysis of the results comparing ensembled model with standalone models using Logistics Regression
Analysis of the results, Decision Tree:
Accuracy True Positive True Negative False Positive False Negative PCA=250 79% 0.87 0.52 0.48 0.13
K=7500 84% 0.92 0.59 0.41 0.08 PCA=250 + K=7500 79% 0.87 0.53 0.47 0.13
27
Table 4 and Table 5 shows that while using the research approach with different machine algorithms, the impact of the increasing True Negative scores remains the same.
In the case of using Bernoulli Naïve Bayes algorithm, the value of True Negative increased from PCA model to Chi Squared model. And the ensemble model had a value better than both the models. But for different other machine learning algorithms, the pattern changes. For using Logistics regression as the machine learning algorithm, the pattern of increasing True Negative value remains same in comparison with the Bernoulli Naïve Bayes algorithm used model. While using Decision Tree as the machine learning algorithm, the model with only Chi Squared Test as the feature selection technique has the best True negative value score in comparison with other two models using Decision Tree Classifier.
From all the three machine learning algorithms used with three approaches each, the models with only the Chi Square statistical test as the feature selection method performed better in terms of accuracy. Among them, the model with Logistics regression algorithm with the accuracy of 85% performed best for Sentiment prediction.
28
8. CONCLUSION
From the analysis results performed above, it can be justified that the model with the ensemble of the feature reduction methods using Principal component Analysis(PCA) as feature extraction method and Chi Square Statistical Test as feature selection method gives less accuracy than both the other standalone models that are using PCA and Chi Squared statistical test as feature reduction methods. This can be confirmed from the analysis obtained from the experiments performed in this project. A True Negative score is the amount of predicting originally negative reviews as negative. From the model that uses PCA algorithm, it can be confirmed that the model yields a very low value of True Negative score which states that it hardly predicts a negative review as a negative review. The PCA model gives a spectacular score of True Positive. The model with Chi Squared statistical test as feature selection method performs better in giving a higher True Negative score in comparison with the PCA model. So, a motivation of increasing the True Negative score value along with a spectacular True Positive score was obtained which resulted in performing the experiments on ensembled methods.
From the ensembled model results, it was confirmed that a better True negative score value is obtained in comparison to both the standalone models proving the motivation affirmatively. But on the other side, a compromise was made on the True Positive value which resulted in an overall decline in the accuracy of the model. By performing experiments with different other machine learning algorithms, it was resulted that it also goes on the ML algorithm used for classification. In this project, it was primarily focused on the impacts of different feature reduction methods with just one ML algorithm. But while experimenting different other ML algorithms with the research approaches, it was gained that the model with Logistics Regression ML algorithm performed best with an accuracy of 85% with just using Chi Squared Statistical test as the feature selection method.
29
9. FUTURE WORKS
From the conclusion it can be observed that, the ensemble of the feature reduction methods drastically decreases the accuracy of the model. In the future work, a different feature reduction methodology in place of PCA can be tested. On top of it, there are several different feature selection methods that can be used in place of Chi Square Statistical Test for feature selection. One can also consider Bigram or N-gram features as their word features rather than considering just Unigram as the word feature which significantly decreases the dimension of word features. A different set of experiments can be performed focusing on increasing the True Positive score value of the ensembled model, keeping in mind that a better True Negative score value is already obtained by the model.
Apart from it, the sequence of implementing various feature reduction methods in a serialized fashion can be experimented rather than taking the concatenated features as the input for the machine learning algorithm for classification. The experiments of using the feature reduction methods in different sequences can also be tested. One more important topic of interest is to compare the results after implementing the different approaches considering different ML algorithms. It’s a topic of research as for which ML algorithm can be considered best for a text analytics problem.
30
10. BIBLIOGRAPHY
[1] B. Liu, "Sentiment analysis and opinion," International Journal of Computer
Applications(0975-8887), vol. 5(1), no. Synthesis lectures on human technologies, pp. 1-167, 2012.
[2] B. M. Jadav and V. B. Vaghela, "Sentiment Analysis using Support Vector Machine based on
Feature Selection and Semantic Analysis," International Journal of Computer Applications, vol. 146, 2016.
[3] S. P.H and B. Omman, "Evaluation of Features on Sentimental Analysis," in International
Conference on Information and Communication Technologies, 2014.
[4] V. B. Vaghela and B. M. Jadav, "Analysis of Various Sentiment Classification Techniques,"
International Journal of Computer Applications, vol. 140, 2016.
[5] D. M. Blei, A. Y. Ng and M. I. Jordan, "Latent Dirichlet Allocation," Journal of Machine Learning
Research 3, pp. 993-1022, 2003.
[6] H. M. Wallach, "Topic Modeling: Beyond Bag-of-Words," in 23rd International Conference on
Machine Learning, Pittsburgh, 2006.
[7] H. Ke and S. Ma, "Text categorization based on concept indexing and principal component analysis," in TENCON '02. Proceedings. 2002 IEEE Region 10 Conference, Beijing, 2002. [8] G. A. Miller, WordNet: A Lexical Database for English, Communications of the ACM, 1995. [9] B. Pang, L. Lillian and S. Vaithyanathan, "Sentiment Classification using Machine learning
techniques," in ACL-02 Conference on EMNLP, 2002.
[10] V. N. Patodkar and I. R. Sheikh, "Twitter as a Corpus for Sentiment Analysis and Opinion Mining,"
International Journal of Advanced Research in Computer and Communication Engineering, vol. 5,
no. 12, 2016.
[11] V. A. Kharde and S. S. Sonawane, "Sentiment Analysis of Twitter Data: A Survey of Techniques,"
International Journal of Computer Applications, vol. 139, 2016.
[12] P. Turney, "Semantic Orientation applied to unsupervised classification of reviews," in 40th annual
meeting on Association for Computational Linguistics, Philadelphia, 2002.
[13] S. Bird, "media.readthedocs.org," [Online]. Available: https://media.readthedocs.org/pdf/nltk/latest/nltk.pdf.