SCALABLE DATA ANALYSIS ON
MAPREDUCE-BASED SYSTEMS
WANG ZHENGKUI
Master of Computer Science
Harbin Institute of Technology
Bachelor of Computer Science
Heilongjiang Institute of Science and Technology
A THESIS SUBMITTED
FOR THE DEGREE OF DOCTOR OF PHILOSOPHY
NUS GRADUATE SCHOOL OF INTEGRATIVE SCIENCE AND
ENGINEERING
NATIONAL UNIVERSITY OF SINGAPORE
2013
iii
ACKNOWLEDGEMENT
“Let the peace of Christ rule in your hearts, to which indeed you were called in the one body. And be thankful.” -Colossians 3:15
This thesis would not have been completed without the support of many people. I would like to reserve this section to express my gratitude to all of them.
First and foremost, I would like to thank my supervisor Professor Kian-Lee Tan. I would like to express my heartfelt gratitude and appreciation for his invaluable guidance and inspiration in this research, his moral support and encouragement during the duration of my Ph.D study. It is a privilege to work under him, and he has set a good example to me in many different ways. His insights and knowledge in this area play an important role in completing this thesis. As a supervisor, he shows me not only how to be a good researcher with rigorous research attitude, but also how to build a good personality with humility and gentleness. All that I have learned from him will be of great influence for my research and my entire life.
Professor Divyakant Agrawal, who has collaborated with me in many of my research works, deserves my special appreciations. He has provided many precious advices dur-ing my Ph.D work. His insight of research has inspired me to find a lot of interestdur-ing research problems. I would also like to thank him for inviting me to visit the Univer-sity of California at Santa Barbara, UCSB as a research scholar. That provided me a
good opportunity to meet many professors and researchers in UCSB. I would also like to thank Professor Amr EI Abbadi who has co-hosted me together with Divy in UCSB. I am grateful for his help as well as his guidance during my stay there.
My deep gratitude also goes to Professor Wing-Kin Sung and Professor Roger Zim-mermann for being my thesis committee members, monitoring and guiding me in my Ph.D research. I am grateful for their precious time to meet with me for each TAC reg-ular meeting every year. They always provide many precious questions and comments which have inspired me during my research.
I also wish to thank all the people collaborating with me during the last few years: Professor Limsoon Wong, Qian Xiao, Huiju Wang, Qi Fan, Yue Wang, Xiaolong Xu. It was a great pleasure to collaborate with each of them. Their participation further strengthened the technical quality and literary presentation of our papers.
In NUS, I have met a lot of friends who brought a lot of fun to my life, especially, Yong Zeng, Htoo Htet Aung, Wei Kang, Nannan Cao, Luocheng Li, Lei Shi, Lu Li, Guoping Wang, Zhifeng Bao, Xuesong Lu, Yuxin Zheng, Ruiming Tang, Jinbo Zhou, Hao Li, Yi Song, Fangda Wang and all the other students and professors in the entire database labs. I would also thank all of my friends who have made my life much colorful in UCSB, especially, Wei Cheng, Xiaolong Xu, Ye Wang, Shiyuan Wang, Sudipto Das, Aaron Elmore, Ceren Budak, Cetin Sahin, Faial Nawab and many other church friends.
Furthermore, I would like to thank NUS Graduate School of Integrative of Science and Engineering, National University of Singapore for providing me the scholarship during my PhD study.
Last but not least, my deepest love is reserved for my parents Baoren Wang and Suolian Wang, my brother and sister-in-law Xuefa Wang and Feng Yan. They are always supporting, encouraging and loving me. I thank God for blessing me in such a manner to put all of them in my life.
CONTENTS
Acknowledgement iii
Summary ix
1 Introduction 1
1.1 Motivation . . . 1
1.2 Research Problems and Challenges . . . 2
1.2.1 Computation Intensive Analysis . . . 3
1.2.2 Data Intensive Analysis . . . 4
1.3 Contributions of This Thesis . . . 6
1.4 Thesis Outline . . . 10
2 Related Work 11 2.1 Preliminaries on MapReduce . . . 11
2.2 Combinatorial Statistical Analysis . . . 13
2.3 Data Cube Analysis . . . 16
2.3.1 Top-down Cube Computation . . . 18
2.3.2 Bottom-up Cube Computation . . . 19
2.3.3 Hybrid Cube Computation . . . 20
2.3.4 Parallel Array-based Data Cube Computation . . . 22
2.3.5 Parallel Hash-based Data Cube Computation . . . 23
2.3.6 Parallel Top-down and Bottom-up Cube Computation . . . 24
2.3.7 Cube Computation under MapReduce . . . 26
2.4 Graph Cube Analysis . . . 27
2.4.1 Graph Summarization . . . 27
2.4.2 Graph OLAP . . . 28
2.4.3 Graph Cube on Multidimensional Networks . . . 29
3 Combinatorial Statistical Analysis 31 3.1 Overview . . . 31
3.2 Preliminaries . . . 33
3.3 TheCOSACFramework . . . 36
3.4 Efficient Statistical Testing . . . 38
3.5 Parallel Distribution Models . . . 42
3.5.1 Exhaustive Testing . . . 42
3.5.2 Semi-Exhaustive Testing . . . 47
3.6 Processing of Allocated Combinations . . . 54
3.7 Experiment . . . 56
3.7.1 Performance Comparison among different Models . . . 58
3.7.2 Sharing Optimization . . . 60
3.7.3 Scalability . . . 62
3.7.4 Performance . . . 62
3.7.5 Top-k Retrieval . . . 64
vii
4 Data Cube Analysis 67
4.1 Overview . . . 67
4.2 Preliminaries . . . 69
4.2.1 Data Cube Materialization . . . 69
4.2.2 Data Cube View Maintenance . . . 70
4.3 HaCube: The Big Picture . . . 71
4.3.1 Architecture . . . 72
4.3.2 Computation Paradigm . . . 73
4.4 Initial Cube Materialization . . . 74
4.4.1 Cuboid Computation Sharing . . . 75
4.4.2 Plan Generator . . . 77
4.4.3 Load Balancer . . . 79
4.4.4 Implementation of CubeGen . . . 82
4.5 View Maintenance . . . 86
4.5.1 Supporting View Maintenance in MR . . . 86
4.5.2 HaCube Design Principles . . . 87
4.5.3 Supporting View Maintenance in HaCube . . . 88
4.6 Other Issues . . . 93
4.6.1 Fault Tolerance . . . 93
4.6.2 Storage Cost Discussion . . . 94
4.7 Performance Evaluation . . . 95
4.7.1 Cube Materialization Evaluation . . . 96
4.7.2 Cube Materialization Evaluation . . . 97
4.7.3 View Maintenance Evaluation . . . 101
5 Graph Cube Analysis 105
5.1 Overview . . . 105
5.2 Hyper Graph Cube Model . . . 109
5.3 A Naive MR-based Scheme . . . 116
5.4 MR-based Hyper Graph Cube Computation . . . 117
5.4.1 Self-Contained Join . . . 118
5.4.2 Cuboids Batching . . . 119
5.4.3 Batch Processing . . . 123
5.4.4 Cost-based Execution Plan Optimization . . . 126
5.5 Experiment . . . 131
5.5.1 Effectiveness . . . 132
5.5.2 Self-Contained Join Optimization . . . 135
5.5.3 Cuboids Batching Optimization . . . 135
5.5.4 Batch Execution Plan Optimization . . . 136
5.5.5 Scalability . . . 137
5.6 Summary . . . 138
6 Conclusion and Future Work 139 6.1 Thesis Contributions . . . 140
6.2 Future Research Directions . . . 142
ix
SUMMARY
Many of today’s applications, such as scientific, financial and social networking ap-plications, are generating and collecting data at an alarming rate. As the size of data grows, it becomes increasingly challenging to analyze these datasets. The high compu-tation and I/O cost of processing large amount of data make it difficult for these applica-tions to meet the performance demands of end-users.
Meanwhile, the MapReduce framework has emerged as a powerful parallel com-putation paradigm for data processing on large-scale clusters. As such, there has been much effort in developing MapReduce-based algorithms to improve performance. How-ever, there remain many challenges in exploiting MapReduce for efficient data analysis. Thus, designing new scalable, efficient and practical parallel data processing algorithms, frameworks and systems for computation intensive analysis and data intensive analysis is the research problem of this thesis.
In this thesis, we explore two extremely important and challenging analyses: Com-binatorial Statistical Analysis (CSA, as an representative example of computation inten-sive analysis to finding the significant objects correlations that is measured by statistical methods) and Online Analytical Processing (OLAP) cubes analysis (as an representative
example of data intensive analysis to materialize the data in support of efficient query response and decision making in data warehousing).
First, we adopt the MapReduce computation paradigm to develop a highly scalable and generic framework with two alternative computation schemes (exhaustive testing and semi-exhaustive testing) for the CSA problem. It is able to distribute the compu-tation task to each processing unit for the analysis with any number of objects with a good load balancing. We also propose new techniques to speed up the statistical testing among different combinations of objects. By incorporating these techniques, our frame-work obtains great efficiency and scalability towards a large number of objects that none of the existing frameworks are able to achieve. Second, we develop a distributed system, HaCube which is an extension of MapReduce, designed for efficient parallel data cubes analysis for large-scale multidimensional data in traditional OLAP and data warehous-ing scenario. We propose a generic parallel cubwarehous-ing algorithm to materialize the cube efficiently. We also investigate the view update problem and provide the techniques to update the view when new data is inserted. This, to the best of our knowledge, is the first work to study view maintenance in MapReduce-like environment. Third, we extend the data cubes analysis to a more complex data structure, attributed graphs where both vertex and edge are associated with attributes. Specifically, we propose a new conceptual graph cube model, Hyper Graph Cube, based on the attributed graphs, since the tradi-tional data cubes are no longer applicable in graphs. This is also the first work to develop a MapReduce-based distributed and parallel graph cube materialization solution towards the graph OLAP on large-scale graphs.
We have implemented the above techniques and conducted extensive experimental studies. The experimental results demonstrated the efficiency, effectiveness and scala-bility of our approaches. We believe that our research in this thesis brings us one step closer towards developing scalable and efficient big data analysis systems.
LIST OF TABLES
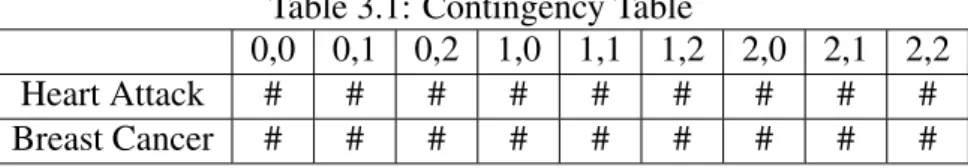
3.1 Contingency Table . . . 35
3.2 Frequently Used Notations in COSAC . . . 42
5.1 Variables Used in Cost Model . . . 127
5.2 Cluster configuration . . . 132
LIST OF FIGURES
2.1 The MapReduce computation paradigm . . . 12
2.2 A cube lattice with 4 dimensions A, B, C and D . . . 17
2.3 Top-Down Computation . . . 18
2.4 Bottom-Up Computation . . . 20
2.5 Star-Cubing Computation . . . 21
3.1 An example of the raw data with 8 samples and 6 objects. . . 34
3.2 COSAC framework architecture . . . 36
3.3 Data reformation and contingency table construction . . . 38
3.4 COSAC: Parallel distribution models for Exhaustive Testing . . . 44
3.5 Combinations enumeration in Semi-Exhaustive Testing. . . 48
3.6 Converting the group id to the position combination . . . 51
3.7 Execution time ratio for Round Robin/Bestfit . . . 57
3.8 Execution time ratio for Greedy/Bestfit . . . 59
3.9 Execution time ratio for CSA without/with sharing optimization . . . . 60
3.10 COSAC Scalability Evaluation . . . 61
3.11 COSAC Performance Evaluation . . . 63
3.12 Execution time for different k values . . . 64
3.13 Execution time for top-50 retrieval from different datasets . . . 65
4.1 A cube lattice with 4 dimensions A, B, C and D . . . 70
4.2 HaCube Architecture . . . 71
4.3 A directed graph of expressing 4 dimensionsA,B,CandD . . . 78
4.4 The numbered cube lattice with execution batches . . . 80
4.5 Recomputation for MEDIAN in HaCube . . . 89
4.6 Incremental computation for SUM in HaCube . . . 91
4.7 CubeGenPerformance Evaluation for Cube Materialization . . . 98
4.8 The load balancing on 280 reducers . . . 99
4.9 Impact of Number of Dimensions . . . 100
4.10 HaCube View Maintenance Efficiency Evaluation . . . 101
4.11 Impact of Parallelism for View Maintenance . . . 103
5.1 A running example of an attributed graph . . . 106
5.2 The V-Agg lattice cartesian product the E-Agg lattice . . . 111
5.3 Aggregate Graphs . . . 112
5.4 The Hyper Graph Cube lattice . . . 113
5.5 The self-contained file format . . . 118
5.6 The generated batches . . . 122
5.7 The worker fitting model for multiple jobs execution . . . 130
5.8 OLAP query on V-Agg Cuboids . . . 133
5.9 OLAP query on VE-Agg cuboid<Region, Type> . . . 134
5.10 Evaluation for self-contained join . . . 134
5.11 Evaluation for batch processing . . . 136
CHAPTER 1
INTRODUCTION
1.1
Motivation
The amount of data in our world has been exploding, such as scientific data, industry sales data, finance data, social network data etc. These data resources contain a wealth of information that is of benefit to different communities. A better understanding of these data may help us have a better insight of the world, better target marketing campaigns and perform a better decision making support in industries etc. Analyzing large data sets has become one of the main challenges in various enterprises. Thus, the design of efficient methods for big data analysis has drawn a tremendous attention from both industries and academia recently.
Due to the increasing size of data, analyzing these data becomes quite difficult. The difficulty of analyzing these large-scale data arises because of either the high computa-tion overhead or the high I/O overhead incurred in big data processing. In such a data explosion era, existing techniques developed on a single server or a small number of
machines are unable to provide acceptable performance. Therefore, many studies have endeavored to overcome the limitations of existing techniques to face the challenges arisen by data.
My research aims at developing new techniques towards an efficient and effective large-scale data processing and analysis. Given that the applications could be either computation intensive or data intensive, this thesis studies both of these two categories of applications. Specifically, this thesis explores two extremely important but challeng-ing analyses, combinatorial statistical analysis (CSA) and Online Analytical Processchalleng-ing (OLAP) cubes analysis. The former is a representative example of computation-intensive applications, while the latter represents data-intensive applications.
1.2
Research Problems and Challenges
In this thesis, we propose to exploit parallelism to speed up the data analysis in computation and data intensive applications. Today, we are facing good opportunities to develop scalable data analysis systems. On the one hand, the large amount of com-putation resources become available to each user, especially benefited from the emer-gence of cloud computing. Cloud computing has emerged as a successful and ubiqui-tous paradigm for service oriented computing. The major advantages that make cloud computing attractive are: pay-as-you-use pricing resulting in low time to market and low upfront investment for trying out novel application ideas;elasticity, i.e., the ability to scale the computation resources and capacity as you need. This provides us power-ful computation resources to all users to deploy a real scalable and elastic data analysis system in a large infrastructure.
On the other hand, MapReduce (MR) has emerged as a powerful parallel computation paradigm for data processing on large-scale clusters. It becomes a very popular and
3
attractive platform due to itshigh scalability(scale to thousands of machines),good fault tolerance (automatic failure recovery), andease-of-programming(simple programming logic). More importantly, the MR framework has been integrated with the cloud so that each user can easily deploy their MR-based algorithms to the cloud with low expense.
Based on this, we are able to develop real scalable data analysis systems by adopting MR as the data processing engine over the large-scale cluster. However, it is non-trivial to develop such MR-based data analysis operators. A naive data processing solution over MR may be very costly. Thus, the research problem, in this thesis, is to explore the efficient big data analysis techniques over the MR computation paradigm. Since the analysis could be either computation intensive or data intensive, we tackle the problems for both of these categories of analyses in this thesis.
1.2.1
Computation Intensive Analysis
Computation intensive analysis involves high computation overhead where paral-lelizing these computation tasks will reduce the total data processing time. In this thesis, we take the combinatorial statistical analysis as an example to explore a practical parallel solution for computation intensive applications.
Combinatorial Statistical Analysis (CSA) plays an important role in finding the sig-nificant correlations that are typically measured by statistical methods among different objects. Finding such correlations between multiple objects may help us better under-stand their relationships. Intuitively, CSA evaluates the significance of the associations between a combination of objects by adopting the statistical methods, such as χ2 test.
Due to the power of the statistical methods, CSA has been widely used in many dif-ferent applications to find the associations between objects, especially in scientific data analysis.
among a combination of Single Nucleotide Polymorphisms (SNPs) that cause complex diseases(e.g. breast cancer, diabetes and heart attacks)[47][74][90][80][81].
From a computational point of view, finding significant associations is very challeng-ing. On the one hand, scientists typically do not want to miss any answers. As such, the widely adopted solution is to exhaustively enumerate all possible combinations of a cer-tain size, sayk, in order to find all statistically significant associations ofkobjects [51]. Givennobjects, there areC(n, k) = (k!(nn!−k)!) combinations to evaluate.
On the other hand, the cost for computing statistical test to evaluate the association significance of one combination is high. As such, for a large number of combinations, it will take a very long time to complete the processing.
Thus, the research problem we have here is how to build a scalable, practical, efficient and effective parallel cloud-basedCSA computation framework on MR. In particular, an efficient and effective scheme must address two challenges:
1. Given the large number of combinations, they must be distributed evenly across the processing units; otherwise, the unit with a significantly bigger load will become a bottleneck. Therefore, a distribution scheme that balances the load should be developed. Meanwhile, the solution should be able to scale well towards a large-scale data analysis. 2. At a particular unit, we also have a large number of combinations being allocated, each of which requires an expensive statistical test. The naive strategy of processing these tests independently is inefficient. Instead, a scheme that can minimize the compu-tation for efficient statistics testing should be designed.
1.2.2
Data Intensive Analysis
Besides the computation intensive analysis, we also want to study the processing of data-intensive applications. In such applications, the computation difficulty is not the main bottleneck but high I/O overhead incurred by the large volume of data. Decision
5
support systems that run aggregation queries over data warehouse is an example.
OLAP data cubes [31] are one such critical technology that has been used in data warehousing and OLAP to support decision making. Given n dimensions, data cubes normally precompute a total of2ncuboidsor group-bys, where each cuboid or group-by
captures the aggregated data over one combination of dimensions. Each of such cuboid can be stored into a database as a view to speed up query processing.
There are two key operations in data cube analysis. The first is data cube ma-terialization where the various cuboids are computed and stored as views for further observation and query support. The second is data cube view maintenance where the materialized views are updated when new data is inserted. Both these operations are computationally expensive, and have received considerable attention in the literature [7][95][96][44] .
Therefore, in this thesis, our research problem is to deploy an efficient and scalable data cube analysis system targeting on a large amount of data over the MR-like com-putation paradigm. To design such a distributed system, the main challenges can be summarized as follows:
1. Given n dimensions in a relation, there are2n cuboids to be computed to mate-rialize the cube. An efficient parallel algorithm to matemate-rialize the cube faces two sub-challenges: (a) Given that some of the cuboids share common dimensions, is it possible to batch these cuboids to exploit some common processing? (b) Assuming we are able to create batches of cuboids, how can we allocate these batches or resources so that the load across the processing nodes is balanced?
2. View maintenance in a distributed environment introduces significant overheads, as large amounts of data (either the materialized data or the base data) need to be read, shuffled and written among the processing nodes and distributed file system (DFS). Moreover, for non-distributive measures, recomputation is necessary to update the views.
It is thus critical to develop efficient view maintenance methods for a wide variety of fre-quently used measures.
Furthermore, we extend the OLAP cubes analysis to a more complex structured data, attributed graphs where both the vertex and the edge are associated with attributes. The attributed graph has been widely used to model the information networks. Attributed graphs become quite ubiquitous due to the astounding growth of different information networks such as the Web and various of social networks(e.g. Facebook, LinkedIn, RenRen).
Obviously, these attributed graphs contain a wealth of information. Analyzing such information may provide us an accurate and implicit insight of the real world. For in-stance, analyzing the relationship (edge) information in a social network may help us to better understand how users interact with each other among different communities.
However, the traditional OLAP cubes are no longer applicable to graphs, since the edges(relationship information) have to be considered in graph warehousing. The tra-ditional data cubes only aggregate the numeric value based on the group-bys and are unable to capture the structural information.
In order to conduct graph OLAP, a new conceptual graph cube model has to be de-signed on a graph context further. And then, to support large graphs, there is a need to develop a parallel graph cube computation algorithm such that it is practical and scalable enough in processing the large graphs we are facing today.
1.3
Contributions of This Thesis
To solve the research problems aforementioned, we propose several new algorithms, frameworks and systems in this thesis. Our main contributions are summarized here.
In the first part of this thesis, we propose a MR-based framework,COSAC -COmbina-torial Statistical Analysis on Cloud platforms for the CSAproblem. Our contributions
7
are:
• We propose an efficient and flexible object combination enumeration framework with good load balancing and scalability for large scale of datasets using the MR paradigm. The enumeration of combinatorial objects takes an important role in computer science and engineering [64]. We develop schemes for enumerating the entire set of objects (Exhausitive Testing) as well as a subset of the set (Semi-exhaustive Testing). Our framework is useful beyond scientific data processing; it is suited for any applications that need to enumerate the objects set.
• We propose a technique for efficient statistics analysis using IRBI (Integer Repre-sentation and Bitmap Indexing) which is both CPU efficient with regard to statis-tics testing, and storage and memory efficient. Statisstatis-tics methods have been widely used as powerful tools in many different applications, e.g. data mining, machine learning. The approach we adopted in our thesis can be a promising solution to speed up the statistical testing.
• We propose an optimization technique based on the sharing of computation to salvage computations that can be reused during statistical testing with significant performance savings, instead of conducting the testing for each combination inde-pendently.
• We implement the framework and conduct extensive experimental evaluation. The results indicate that our framework is able to conduct analysis in hours where the task normally took weeks, if not months. To the best of our knowledge, non of the existing framework has such a computation capability.
In the second part of this thesis, to develop a scalable parallel data cube analysis platform on big data, we develop a distributed system,HaCube, integrating a new data
cubing algorithm and an efficient view maintenance scheme. Our main contributions in this work are as follows:
• We present a distributed system, HaCube, an extension of MR, for data cube analysis on large-scale data. HaCubemodifies the Hadoop MR framework while retaining good features like ease of programming, scalability and fault tolerance. It also builds a layer with user-friendly interfaces for data cube analysis. We note thatHaCuberetains the conventional Hadoop APIs and, thus, is compatible with MR jobs.
• We show how batching cuboids for processing can minimize the read/shuffle over-head to salvage partial work done for efficient data cube materialization.
• We propose a general and effective load balancing schemeLBCCC(short for Load Balancing via Computation Complexity Comparison) to ensure that resources are well allocated to each batch. LBCCC can be used under both HaCube and MR frameworks.
• We adopt a new computation paradigm, MMRR (MAP-MERGE-REDUCE-REFRESH
), with a local store underHaCube. HaCubesupports efficient view updates for different measures, both distributive such as SUM, COUNT and non-distributive such as MEDIAN, CORRELATION. Thus, this is able to support more applica-tions with data cube analysis in a data center environment. To the best of our knowledge, this is the first work to address data cube view maintenance in MR-like systems.
• We evaluateHaCubebased on the TPC-D benchmark with more than one billion tuples. The experimental results show that HaCubehas significant performance improvement over Hadoop.
9
In the third part of this thesis, we further tackle the graph OLAP problem where a new graph OLAP model and a parallel solution over the attributed graphs have been proposed. Our main contributions in this work are in the following aspects:
• We propose a new conceptual graph cube model, Hyper Graph Cube, to extend decision making services on attributed graphs. Hyper Graph Cube is able to cap-ture queries in different categories into one model. Moreover, the model supports a new set of OLAP Roll-Up/Drill-Down operations on attributed graphs.
• We propose several optimization techniques to tackle the problem of performing an efficient graph cube computation under the MR framework. First, our self-contained join strategy can reduce I/O cost. It is a general join strategy applicable to various applications which need to pass a large amount of intermediate joined data between multiple MR jobs. Second, we combine cuboids to be processed as a batch so that the intermediate data and computation can be shared. Third, a cost-based optimization scheme is used to further group batches into bags (each bag is a subset of batches) so that each bag can be processed efficiently using a single MR job. Fourth, a MR-based scheme is designed to process a bag.
• We introduce a cube materialization approach, MRGraph-Cubing, that employs these techniques to process large scale attributed graphs. To the best of our knowl-edge, this is the first parallel graph cubing solution over large-scale attributed graphs under the MR-like framework.
• We conduct extensive experimental evaluations based on both real and synthetic data. The experimental results demonstrate that our parallel Hyper Graph Cube solution is effective, efficient and scalable.
The works in this thesis have resulted in a number of publications, more specifically, [80], [81] and [77], [79] and [78].
1.4
Thesis Outline
The thesis is organized as follows. In Chapter 2, we first provide the preliminaries on MapReduce and then review the related works. For theCSAproblem, we focus on work related to epistasis discovery. We also review the existing data cubes analysis techniques including three classic cubing approaches and parallel computation solutions, and the graph OLAP works.
We then present our proposed COSAC framework for combinatorial statistical anal-ysis in Chapter 3. In this chapter, we demonstrate how to use MR to develop a highly scalable and efficient framework that parallelizes the computation tasks in the computa-tion intensive analysis.
Chapter 4 introduces a distributed system, HaCube, designed for an efficient parallel data cube analysis on the traditional relational data. This chapter shows how MR can be extended to support traditional data cubes analysis. We will also introduce the system architecture of HaCube, a new cubing algorithm for cube materialization as well as the new view maintenance strategies in HaCube.
In Chapter 5, we present our proposed Hyper Graph Cube model and a MR-based cube computation framework. We also introduce other graph OLAP operations and chal-lenges in graph OLAP.
Finally, we conclude this thesis and discuss some future research work in Chapter 6.
CHAPTER 2
RELATED WORK
In this chapter, we first introduce the preliminaries of MapReduce. Then, we focus on some related works. More specifically, we first present some related work on the Combinatorial Statistical Analysis-CSA problem. In particular, we focus on existing works on epistasis discovery. Then, we review the most closely related works on existing data cube processing and graph OLAP analytics.
2.1
Preliminaries on MapReduce
MapReduce (MR), which was first proposed in [22], has emerged as a powerful par-allel computation paradigm. MR has several advantages which make it attractive, such as its high scalability (scalability of thousands of machines), good fault tolerance (auto-matic failure recovery by the framework), ease-of-programming (simple programming logic) and high integration with cloud(availability to every user and low expense with a pay-as-you-go model). It has been widely used by various applications such as scientific
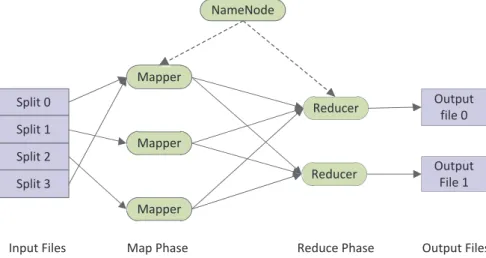
NameNode Split 0 Split 1 Split 2 Split 3 Mapper Mapper Mapper Reducer Reducer Output file 0 Output File 1
Input Files Map Phase Reduce Phase Output Files
Figure 2.1: The MapReduce computation paradigm
data processing, media data processing, data mining and machine learning etc.
Under the MR framework, the system architecture of a cluster consists of two kinds of nodes, namely, the NameNode and DataNodes. The NameNode works as a master of the file system and is responsible for splitting data into blocks and distributing the blocks to the data nodes (DataNodes) with replication for fault tolerance. A JobTracker running on the NameNode keeps track of the job information, job execution and fault tolerance of jobs executing in the cluster. A job may be split into multiple tasks, each of which is assigned to be processed at a DataNode.
The DataNode is responsible for storing the data blocks assigned by the NameN-ode. A TaskTracker running on the DataNode is responsible for the task execution and communicating with the JobTracker.
The computation of MR follows a fixed model with a map phase and followed by a reducephase [22]. Figure 2.1 provides the MR computation paradigm. The MR library is responsible for splitting the data into chunks and distributing each chunk to the processing units (calledmappers) on different nodes. Themappersprocess the data read from the file system and produce a set of intermediate results which are shuffled to the other processing units (calledreducers) for further processing. Users can set their
13
application logic by writing themapandreducefunctions in their applications.
Map Phase:Themapfunction is used to process(key, value)pairs(k1, v1)which are read from data chunks. Through themapfunction, the input set of(k1, v1)pairs are transformed into a new set of intermediate (k2, v2)pairs. The MR library will sort and partition all the intermediate pairs and pass them to thereducers.
A partitioning function is responsible to partition the pairs emitted from the map
phase intoM partitions on the local disks, whereM is the total number ofreducers. The partitions are then shuffled to the corresponding reducers by the MR library. Users can specify their own partitioning function or use the default one provided by the MR framework.
Reduce phase: At thereducer, the intermediate(k2, v2)pairs with the same key that are shuffled from different mappers are sorted and merged together to form a values list. The key and the values list are fed to the user-written reduce function iteratively. The reduce function makes a further computation to the key and values and produces new (k3, v3) pairs. The output (k3, v3)pairs are written back to the file system.
2.2
Combinatorial Statistical Analysis
Combinatorial statistical analysis (CSA) plays an important role in many scientific applications to find significant object associations. In this thesis, we focus on epistasis discovery as one representative application, which has widely adopted CSA. Hence, in this section, we provide the related works for CSA in epistasis discovery.
In epistasis discovery, scientists aim to discover the correlation between a combina-tion of Single Nucleotide Polymorphisms (SNPs) and the diseases such as heart attack and cancer. Traditionally, many researchers focused on the association of individual
SNPs with the phenotypes (such as the diseases). However, these methods can only find weak associations as they ignore the joint genetic effects, which is called Epista-sis, across the whole genome [50]. Recently, there has been a shift away from the one-SNP-at-a-time approach towards a more holistic and significant approach that detects the association between a combination of multiple SNPs with the phenotypes [49]. In the meanwhile, the number of discovered SNPs is becoming larger and larger. For example, the Hapmap project provides the dataset containing 3.1 million SNPs [24]. Determining the interactions of SNPs has become a very time-consuming job from a computational perspective.
To discover such a significant association, statistical modeling techniques have been proposed [59][83][82]. However, these statistical modeling methods, which work well for a small number of SNPs, are not able to provide acceptable performance and become impractical when the number of SNPs increases enlarging the search space. To prune the search space, the heuristics techniques are proposed to speedup statistical modeling approach [93][92][91]. In particular, a filtering step is added to select a fixed number candidate SNPs. Then the selected candidate SNPs are exhaustively evaluated. On the other hand, many researchers still focus on the exhaustive enumerating approach to test all the possible pairs of SNPs [74][60]. Exhaustive enumerating guarantees that all the combinations of SNPs are tested, thus none of the significant associations will be missed.
However, all the aforementioned related works are designed on a single server ma-chine, which has become no longer practical to provide acceptable computation perfor-mance, as the size of dataset and analysis order increases. Thus, due to such a computa-tional difficulty, researchers have made great effort to exploit parallel processing to the computational challenge in epistasis discovering.
Ma at el. [47] proposed a parallel computation tool designed for two-locus analysis (checking the pair association) specially targeting on a supercomputer platform. Given
15
N SNPs, there are totalC(N,2)pairs to evaluate. In order to distribute and enumerate theC(N,2)pairs into different processor cores, theN SNPs are first evenly divided into msubsets. Then each combination of themsubsets is sent to one processor core. There-fore, the total number of processor cores (p) needed isp=m(m+ 1)/2. For illustration, we define n = N/m. Among thepcores, there are mcores only receiving one subset to make a self-subset pairing operations to pair the SNPs among one subset. In these processors, each of them computes n(n+ 1)/2pairs. For the restp−m cores, each of them receives two different subsets and conducts a cross-subset pairing operations where the SNPs from one subset are paired with the ones in another subset. In these cores, it is easy to see that n∗n pairs are evaluated in each core. Through their experimental results, they predict the time for pairwise epistasis testing among 1,000,000 SNPs using 2048 cores would require about 20 hours to complete [47].
However, first, N/m may not be always an integer in practice, while they assume that N/mis an integer in their paper. Second, based on the computation task assigned to each core, we can see that the load is not well balanced between the m cores (the ones conduct self-subset pairing) and the restp−mcores (the ones conduct cross-subset pairing). Third, they only introduce how to conduct the pairwise analysis. It is unclear and more challenging to make a high order analysis. The last but not the least, the tool is specially designed for a supercomputer system which is not easy for others to obtain and thus, not easy to have the proposed solution works on other computation resources such as a shared-nothing cluster.
Thong at el. [37][38] adopted the graphical processing units (GPUs) to exhaustively test all the SNPs pairs. However, the authors did not provide the implementation details on GPUs. Indeed, the GPU is more powerful than a single PC, since it has more comput-ing units and large memory. However, it requires the researchers to fully understand the GPU architecture to optimize the parallel computation. It is still unclear how to develop
an optimized multi-threads program to process the pairs evaluation in parallel. Thong at el. design the analysis on single GPU. However, we argue that this is still not scalable since a single GPU may only have limited computing resources. A scalable technique may need to be able to perform on multiple machines.
In our works [80][81], we have provided the solution to solve the pairwise epistasis testing in genome-wide association study. However, it is more challenging to conduct a high order analysis for any generic CSAanalysis. In thesis, we mainly focus our work where a flexible and general framework,COSAC, for any order of analysis are proposed [77]. COSACis a more general framework which is computationally practical, efficient, scalable for CSA systems, and flexible to support any level of analysis with different optimization techniques. In particular, COSAC incorporated numerous extensions: (a) a general and flexible framework to support any level of analysis in CSAapplications. It is non-trivial to perform the combinatorial statistical analysis when analysis level in-creases. The load balancing becomes more tricky in such a high order analysis scenario. (b) a new practical scheme to support partial enumeration when a scientist has already identified a set of key objects that (s)he would like to investigate further. (c) a novel sharing optimization to speed up the analysis when the analysis level is bigger than 2. (d) a new approach to reduce the memory utility inCSAapplications.
2.3
Data Cube Analysis
Data Cubes play an important role in data warehousing and OLAP to precompute the aggregate values for different dimensions. Given n dimensions, there are total 2n
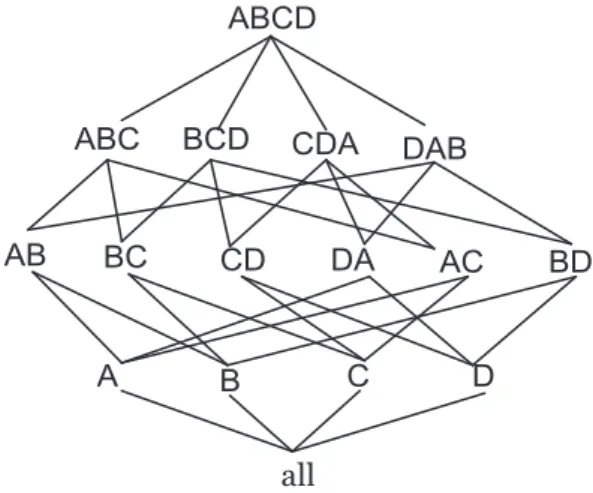
different combinations of dimensions, which is called cuboids. Efficient computation of data cubes has attracted a lot of research interests in the last two decades. For instance, given four dimensions A, B, C and D, all the 16 cuboids can be represented as a cube
17 all A AB BC CD ABCD C B D DA AC BD
ABC BCD CDA DAB
Figure 2.2: A cube lattice with 4 dimensions A, B, C and D
lattice as shown in Figure 2.2. All the research works can be classified into the following categories: (1) efficient computation of full or iceberg cubes: the computation of the full cube needs to compute the aggregate of each group in a complete cube, while the computation of iceberg cubes only needs to process the group which meet a certain condition or threshold[7] [11] [63] [33] [95]. (2) selective view materialization: these batch of researches aims to materialize only partial of the cubes instead of a complete cube [58][32] [35] [70]. (3) computation of special data cubes: these researches include computing condensed, quotient or dwarf cubes or compressed cubes by approximation such as wavelet cubes, quasi-cubes etc [75] [72] [69][42] [41].
The first one, efficient computation of full or iceberg, is of great importance among the aforementioned categories as it is the fundamental problem, and the new techniques for this category may have a strong influence to all the other categories [85]. Therefore, in this thesis, we focus on introducing the different computation approaches for materi-alizing a full or iceberg cube in the literature. We classify the existing approaches into three categories on efficient cube computations, bottom-up, top-down and hybrid cube computations, each of which is introduced in the following sections.
2.3.1
Top-down Cube Computation
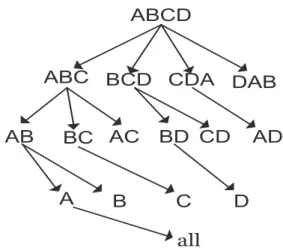
Zhao et al. [95] proposed a top-down computation approach (we refer this approach as MultiWay approach) which overlaps the computation of different group-bys based on a Multi-Way Array. The approach includes three-step procedure. First, it scans the table and loads it into an array. Second, it computes the cube on the resulting array. Third, it dumps the resulting cubed array into the tables. The array is used as an internal in-memory data structure to load the base cuboid and compute the cube. For a more memory efficient processing, the array may be partitioned into different chunks, each of which can be fit into memory.
all A AB BC AC ABCD C B D CD AD
ABC BCD CDA DAB
BD
Figure 2.3: Top-Down Computation
To illustrate how this top-down approach computation works, we take the example in Figure 2.3 as a running example. Given four dimensions A, B, C and D, ABCD is considered to be the base cuboid. As shown in Figure 2.3, the results of computing cuboid ABC can be used to process AB and similarly the results of AB can be used to process A. This shared computation makes MultiWay approach efficient and allows different cuboids to be computed simultaneously. Figure 2.3 shows the entire execution plan based on the MultiWay approach. The advantages of this approach is that it uses the array indexing to avoid tuple comparison and the array structure offers compression
19
as well as indexing.
The MultiWay approach is not effective or feasible when the dimensionality is high and the data is too sparse, since the array and the intermediate results will be too big to fit into memory. Meanwhile, MultiWay cannot take advantage of the Apriori pruning [8] during the iceberg cubing. For instance, if one cellA1B1C1 in ABC does not satisfy
the condition such ascount(A1B1C1)> t, there is no guarantee thatcount(A1B1)< t,
since a cell A1B1 in AB is likely to contain more tuples than in the cell A1B1C1 in
ABC.
2.3.2
Bottom-up Cube Computation
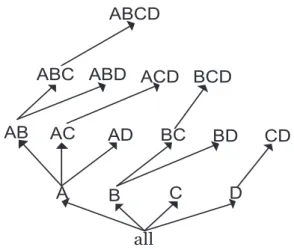
Beyer et al. [11] proposed another bottom-up cube computation approach which is referred as BUC computation. The idea of BUC is to combine the I/O efficiency of processing multiple cuboids, but to take advantage of minimum support pruning like Apriori. To achieve pruning, BUC processes the lattice from the bottom, the apex cuboid and moving upward to the larger, less aggregated group-bys, as shown in Figure 2.4. For instance, if the cell A1 does not satisfy the condition of count(A1) > t, we are sure
that the cell A1B1C1 does not satisfy the conditioncount(A1B1C1) > teither, since it
is likely that A1B1C1 contains less value than the cell A1. Therefore, the computation of
the up-level cuboids can be pruned by the low-level cuboid.
The majority of the run time in BUC is spent on partitioning the data. To facili-tate efficient partitioning, the linear sorting method, CountingSort[67] is adopted. The CountingSort, is fast in BUC, since it does not perform any key comparisons to find boundaries and the counts computed during the sort can be reused to compute the group-bys. However, partitioning and sorting incur the most costs in BUC’s cube computation. This is because the recursive partitioning does not reduce the input size which incurs high overhead for both partition and aggregation. Furthermore, BUC is sensitive in data
all A AB AC AD ABCD C B D BC BD CD
ABC ABD ACD BCD
Figure 2.4: Bottom-Up Computation
skew where the performance degrades as skew increases.
2.3.3
Hybrid Cube Computation
Dong at el. [85][84] proposed a Star-Cubing method, which is a hybrid cube compu-tation to integrate the strengths of both bottom-up and top-down cube compucompu-tations and explores both multidimensional aggregation and a priori pruning. Star-cubing organizes input tuples in a hyper-tree structure, called Star-Tree. The Star-Tree is an extension of a H-Tree [33]. In H-Tree structure, each level is one dimension in the base cuboids. A d-dimension tuple forms one path of d nodes from the root and the leaves with the same value in the same level are linked together by a side-link. A head table is associated with each H-Tree to keep track of each distinct value in all dimensions and the link to the first node with that value in H-Tree.
While Star-Tree is used to represent individual cuboids in Star-Cubing, each level represents a dimension and each node represents an attribute. In steading of maintain-ing a side link and a head table, each node in the Star-tree has four fields includmaintain-ing the attribute value, aggregate value, pointer(s) to possible descendant(s), and pointer to possible sibling. If the single dimensional aggregate on an attribute value p does not
21
satisfy the iceberg condition, the nodepis replaced by ∗so that the tree can be further compressed, since there is no need to distinguish such nodes for a Iceberg computation.
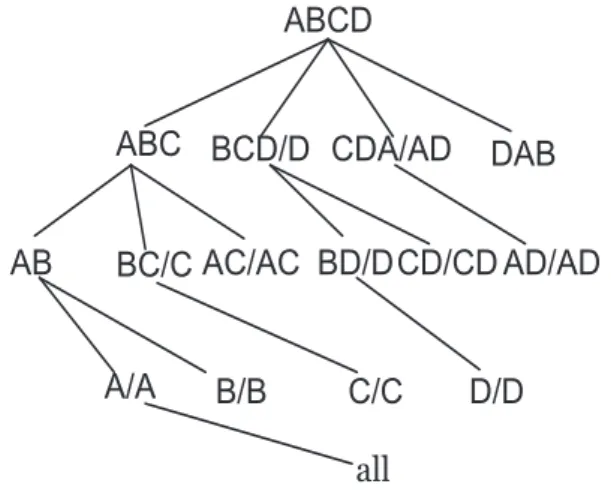
all A/A AB BC/C AC/AC ABCD C/C B/B D/D CD/CD AD/AD ABC BCD/D CDA/AD DAB
BD/D
Figure 2.5: Star-Cubing Computation
The Star-Cubing algorithm explores both the top-down and bottom-up models. On the global computation order, it is similar to the top-down order as shown in Figure 2.3. However, it adopts the bottom-up model for each sub-partition tree by theshared dimen-sions. Note that the shared dimensions are defined according to the common dimensions shared in those particular sub-trees. For instance, all the cuboids in the leftmost sub-tree of the root include dimensions ABC, all those in the second sub-tree include dimensions BC and so on. Figure 2.5 shows the extended lattice with the spanning tree marked with the shared dimensions. For instance, BCD/D means cuboid BCD has shared dimension D, CDA/DA means cuboid CDA has shared dimensions DA, and so on. Since the shared dimensions are identified early in the tree expansion, the shared dimension can be com-puted early to share the computation. Therefore, for instance, AD extending from CDA can be pruned since AD has already been computed in CDA/AD. Given the shared di-mensions, it is easy to see that, if the measure of an iceberg cube is anti-monotonic and also the aggregate value of the shared dimensions does not satisfy the condition, all the cells extended from these shared dimensions cannot satisfy the iceberg condition either.
The Star-Cubing has been evaluated to be more efficient than MultiWay and BUC. However, all the aforementioned cubing methods are designed for a centralized system, thus are not feasible for a parallel processing.
As the data size increases, a significant amount of parallel data cube research has been performed. In the following section, we review several important methods in the literature.
2.3.4
Parallel Array-based Data Cube Computation
Goil and Choudhary proposed one approach to parallelize the data cube computation in the MOLAP (Multidimensional OLAP) environment, based on the data organized in array-based structures [26] [27] [28]. In their approach, a data partitioning model was chosen to parallelize the data cube workload. Intuitively, they distribute each view to multiple processing units so that every processing unit computes a portion of every group-by, since it is easy to partition the array-based structures across nodes.
Specifically, in [26] [27] [28], the data is globally sorted and partitioned based on a given dimension A such that the data set is split into r partitions, P1, P2... Pr each of
which is for one processing unit. Meanwhile, the partitioning guarantees that the value of A in any tuple ofPi is locally sorted and smaller or equal to the one in any tuple of
partition Pj where 16i6j6r. Note that a single value of A may straddle partitions Pi
and Pi+1. The partial results are obtained on distributed views and may eventually be
merged with the partial results on other nodes. For instance, when data is partitioned on the dimension A, then all the cuboids with A as their first dimension can be processed almost independently. This is because there is almost one set of contiguous tuples with the same value of A which can be found on different processors. For the cuboids not containing A, there is a need to merge the partial results in each node. This can be done for example through resorting and partitioning the data according to another dimension
23
say B, where all those remaining cuboids with B as the first dimension can be processed independently. The process is repeated d times for each distinct dimension.
This technique can reduce the re-partitioning cost. However, the total amount of data redistribution network traffic can still be quite large. Furthermore, for large data, the main memory may not be large enough to concurrently house all of the necessary arrays. Thus, arrays must be carefully partitioned and controlled. Given the complexity of this approach and the overhead incurred, it is unclear how effective this method is likely to be in terms of parallel speedup.
2.3.5
Parallel Hash-based Data Cube Computation
Lu at el. [46] present a parallel data cube implementation for the high-end multi-computer, Fujitsu AP3000. This work uses hashing for aggregation of common records, rather than the aforementioned sorting model. Here, the dimensions of each record are concatenated to form ahash keywhich is used to identify a uniqueaggregation bucket. In each aggregation bucket, the dimensions with the same value are added together. Mean-while, if collisions occur such as two or more hash keys pointing to the same bucket, collision resolution must be employed. Hashing for data cube computation was first proposed in conjunction with the PipeHash [66]. This technique is attractive since it is not only relatively simple to implement but also bounded by O(n)which outperforms the sort-based methods that typically rely on θ(nlogn) sorting algorithms. Counter-intuitively, in [66], the experimental results demonstrate that PipeSort has superiority than the PipeHash. The reason of this is because that hashing costs cannot be shared amongst child group-bys since the dimension combinations for different views are com-pletely unique. Moreover, it is significant to choose the “constants” of the hashing with such a large number of keys. As a consequence, these two factors make the hash-based cubing algorithm slower than expected computation time.
Under this scheme, the algorithm parallelizes the computation by either (1) produc-ing individual and partitioned hash tables by multiple processors or (2) computproduc-ing groups of hash tables on individual nodes. To optimize the computation, a single common par-ent is used to produce all hash tables during a given iteration which means a computation round limited by the available main memory, where the group of available cuboids was chosen from a view list sorted in terms of the estimated size. The experimental results demonstrate some performance improvement on one to five processors, but no advan-tage beyond this point. The potential of this approach is limited by the failure to exploit smaller intermediate group-bys and the overhead of independently hashing each cuboid. Muto and Kitsuregawa propose another more efficient parallelization technique that used a minimum cost spanning tree for hash-based cube computation [53]. In particular, their technique is to partition the individual views on a given dimension (similar to Goil and Choudhary) and then independently compute child view partitions using hash tables constructed from the smallest available parent cuboid. They also proposed the approach to balance the work load through dynamically migrating partitions from busy processors to idle ones. However, there is no physical implementation done by the authors where only simulated results are given. Furthermore, they assume that all the communication would be free since it could be completely overlapped with computation is unlikely to be borne out in practice due to the interdependencies between cuboids.
2.3.6
Parallel Top-down and Bottom-up Cube Computation
Ng at el. provide four separate algorithms designed for fully distributed PC-based clusters and large, sparse data cubes [57]. Specifically, the first two techniques are pro-posed based upon the bottom-up design and another two are based on the top-down design. Brief reviews are provided as follows:
25
coarse granularity cuboids to fine granularity cuboids. It takes the lattice and carves it into d sub-trees where each sub-tree contains a set of cuboids contain-ing the same attribute. For instance, some views contain attribute A, some contain attributed B and so on. The algorithm distributes the unevenly sized sub-trees across the network in a round robin fashion. Of course, if more than d processes exist, the extras remain idle during the computation. Not surprisingly, this leads very poor performance because of the coarseness of the partitioning.
• BPP (Breadth First Writing, Partitioned Parallel BUC):BPP is to partition the data across all processors. In order to avoid the excessive communication cost, the entire fact table is replicated into d distributed copies each of which is for one dimension. Unfortunately, the performance and load balancing results are only marginally better than RP. The main reason is because the costs associated with computing partitions of equivalent size vary widely due to the data skew and clustering patterns in the data set.
• ASL (Affinity SkipList): ASL is designed to decompose the lattice into its 2d individual components and distribute them one by one to the best processors. Here, the best processor is the one associated with the cuboids which has been processed with the common attributes. Note that for this technique and the one below, a dynamic scheduler is adopted where a master scheduler dictates which individual view or a set of views are assigned to given processors at runtime.
• PT (Partitioned Tree): PT recursively divides the lattice into subtrees which is partitioned based on a particular attribute. And then each sub-tree is assigned to an available node where the BUC algorithm is actually computed further. Similarly, to exploit computation sharing, the scheduler tries to reuse the data which has already processed on the node with some common attributes. The experimental
results demonstrate that the finer granularity scheduling of the ASL and PT pro-vides a better load balancing and further gains a better overall performance. When the cluster has less than eight processors, the techniques gain a good speedup. However, the performance declines quickly after this point. This is because the scheduling used by these algorithms cannot capture the global cost information of the complete lattice. As a consequence, the cost reductions reduces when the workload is highly distributed since the computation of the localized view subsets is poorly coordinated.
However, all of these cubing algorithms are only developed for a cluster with a small number of machines, thus are no longer applicable under the MR framework because they are not able to leverage the full parallel power provided by MR [54].
2.3.7
Cube Computation under MapReduce
Several research works have been conducted on performing the cube computation using the MR framework. Sergey et al. [68] and You et al. [88] provided a parallel al-gorithm for calculating the cell closure in a closed cube computation which requires the measures to be algebraic using the MR framework. Nandi et al. [54] [55] developed a scheme to handle special holistic measures, when one reducer gets the “hot spot” group with a large number of tuples during the cube computation. In addition, Abello et al. [6] studied three different approaches to retrieve data cubes(full source scan, indexed ran-dom access and index filtered scan) from BigTable by means of MR and the definition of criteria to choose among them. However, it is still unclear how to efficiently materi-alize the views with a generic algorithm which can balance the load well and optimize the computation for different measures. Furthermore, none of existing works provided any solution for view maintenance when new data is inserted to update the views under the MR framework. A naive solution for view maintenance mechanism can result in
27
significant overhead.
Even though there are some research efforts on incremental computation in MR, none of them provided explicit support and techniques for data cube analysis under the OLAP and data warehousing semantics. For instance, existing works [12][36][43] have studied some techniques for incremental computations for single operators in the MR framework. HaLoop [14] is designed to support iterative operations through a similar caching mechanism. Restore [23] is developed to keep the intermediate results (either the output of one MR job or the data operated within one job) to the DFS in a work flow and reuse them in the future. However, none of these techniques can be directly used in data cube analysis for efficient view maintenance.
Therefore, this calls for a new generic cubing approach and efficient cube main-tenance techniques towards a large amount of data which can incorporate the unique feature of the MR framework.
2.4
Graph Cube Analysis
2.4.1
Graph Summarization
In graph OLAP, the aggregate graph can be considered as a summarization of the underlying graph in terms of a particular perspective and granularity. From this sense, the graph OLAP shares the similar terminology as providing a generation of summarizes of the graph as much research has devoted to. These techniques include the graph sim-plification, compression and summarization. For instance, [9] [56] study the problem of simplifying the graph by preserving its skeleton according to topological features. However, in these works, the attributes on vertices and edges become unimportant. In its abstract form, they are mainly working on the graph where the vertex and edge do not contain any attributes. [62] [13] aim to compress the large graphs, especially Web
graphs. However, these works only focus on how the Web information can be stored and thus facilitate an efficient computation such as pageRank, which do not give any insight of into the graph structures.
Tian et al. and Zhang et al. proposed approaches to summarize the large graphs [73][89]. Two operations are provided including the SNAP (Summarization by Group-ing Nodes on Attributes and Pairwise Relationships) operation and a less restrictive k-SNAP operation. In many applications, graphs are so large that it is almost impossible to understand the information encoded in them by mere visual inspection. Therefore, graph summarization becomes an effective way to help users extract and understand the underlying information.
The SNAP operation is to summarize the input graph by grouping nodes based on user-selected node attributes and relationships which, as the author mentioned, is similar to OLAP-style aggregations [73][89]. The k-SNAP operation allows users to provide the k value to cluster the graph into k subgraphs [73][89]. It achieves the drill-gown or roll-up operation by increasing and decreasing k. However, the graph OLAP performs the aggregation and OLAP along the dimensions defined upon the graphs.
2.4.2
Graph OLAP
Much research work [17][18][61] has been devoted to put graphs in a multi-dimensio-nal and multi-level OLAP framework. In [17][18], graph OLAP is classified into two sub cases: informational OLAP and topological OLAP , where the informational OLAP has been mainly discussed. Intuitively, the informational OLAP works on a set of snapshot graphs. For instance, in academia, the publications in each year can be considered as a snapshot graph which consists of authors and papers and their relationships etc. The informational OLAP is to aggregate the publication networks in each year into an ag-gregate network. Note that the agag-gregate network contains the same number of objects
29
as in each snapshot. In other words, it is like overlaying multiple pieces of information, remaining the objects whose interactions are being looked at.
In contrast to informational OLAP, the topological OLAP operates on nodes and edges within an individual graph [61]. It groups the objects into a super object based on specific dimensions. For instance, in the publication network, the authors from the same institution may be grouped together to generalized the network. Therefore, the aggregate network contains less number of objects. The authors have introduced the concepts of conducting the OLAP operations like roll-up, drill-down and slice/dice based on different graph OLAP sub cases.
The existing works provided a high level discussion of building a graph OLAP frame-work and graph OLAP operations on graphs. However, no specific graph cube models and cube materialization algorithms are provided.
2.4.3
Graph Cube on Multidimensional Networks
Subsequently, Zhao et al. proposed a Graph Cube model for multidimensional net-works [94]. The Graph Cube model is designed on the netnet-works where each vertex con-tains a set of multidimensional attributes but the edges are identical without attaching any attributes.
Givennattributes attached with each vertex, graph cube generates2ncuboids each of
which is an aggregate graph based on specific dimensional attributes. Besides the cuboid query, the authors also provide a new set of queries which are defined as crossboid query which crosses multiple multidimensional spaces of the network.
However, the graph cube model is highly restricted to the multidimensional networks where the edge does not contain any attributes. In the real world, a lot of information networks are attributed graphs where both the vertex and edge contain attributes. Build-ing a data warehousBuild-ing model based on the attributed graphs are more challengBuild-ing and
important.
On the other hand, normally, the information network are large where the algorithm designed on the single machine is not able to provide acceptable performance. However, non of the existing works have provided any parallel and distributed solutions on graph OLAP.
Therefore, we are motivated to design a new and more general graph cube model based on the attributed graphs, and develop scalable, effective and efficient parallel and distributed graph OLAP techniques in order to meet the requirements of large-scale graphs in real applications.
CHAPTER 3
COMBINATORIAL STATISTICAL
ANALYSIS
3.1
Overview
In this chapter, we address the problem of building parallel solutions for one compu-tation extensive analysis, combinatorial statistical analysis (CSA). CSA has been widely used to find the significant correlations that are typically measured by statistical methods among different objects. Intuitively, CSA evaluates the significance of the associations between a combination of objects by adopting the statistical methods, such as χ2 test.
For illustration, we address the problem by taking the epistasis discovery as an example, where the CSA has been widely adopted. Although we have chosen epistasis discov-ery for demonstration, our solution is not specific to just this domain, and should apply broadly to all the CSA applications.
In this work, we propose a framework for efficient COmbinatorial Statistical
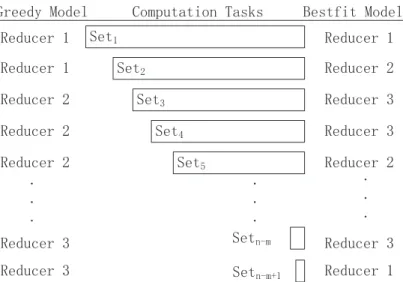
sis systems MapReduce(MR)-based Cloud platforms (COSAC). COSAC addresses the CSA problem in two phases: 1) Distribution Phase: We develop and compare different task distribution schemes to enumerate the large number of combinations to the process-ing units in terms of balancprocess-ing the load. Given a total number of n objects, in order to find the associations among any m objects, there are total C(n, m)combinations to evaluate. The scheme partitions the enumerated combinations into n-m+1 sets, each with a different number of combinations. These sets of tasks are then distributed to the processing units to balance the number of combinations across the units. 2) Statistical Analysis Phase: Each node has to evaluate the statistical significance of the combina-tions allocated to it. We develop an optimization to salvage the common computacombina-tions between the various combinations and provide a technique called Integer Representation and Bitmap Indexing (IRBI) to speed up the statistical testing. Such two phases have solved the two key challenges in CSA including balancing the load to each processing units in a distributed environment and conducting an efficient statistics testing.
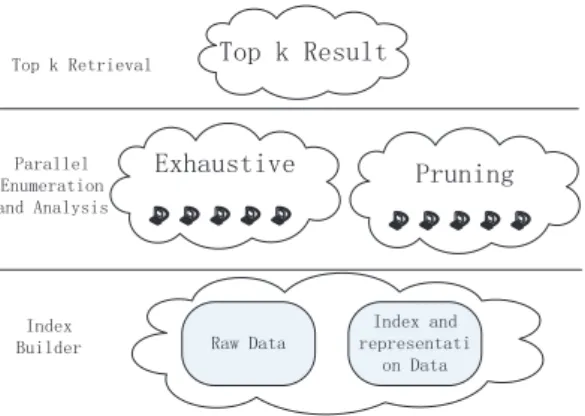
The COSAC framework includes three layers. The first layer is the index builder layer which is used to preprocess the raw data to facilitate efficient data processing. The second one is the analysis layers for parallel combination enumeration and sta-tistical analysis. Two analysis schemes have been proposed, Exhaustive Testing and
Semi-ExhaustiveTesting. The Exhaustive Testingsupports exhaustive evaluation of the statistics significance of all the combinations without losing any significant result. The
Semi-Exhaustive can be used to analyze part of the combinations to prune the compu-tation spaces. The third layer is the top-k retrieval layer that is designed to help users to further retrieve the top-k most significant results from the large volume of analysis results data.
Based on COSAC, we have designed and compared various flexible object combina-tion enumeracombina-tion schemes with regard to load balancing and scalability for large scale
33
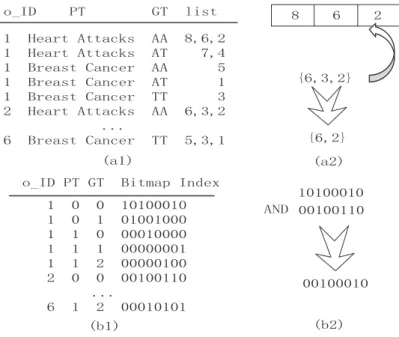
of datasets using the MR paradigm. The enumeration of combinatorial objects takes an important role in computer science and engineering. We also propose the techniques to use the integers to represent the long string raw data and adopt Bitmap index to index each object on the samples. Thus, we can conduct the analysis only based on the rep-resentation data and index data. Both of these two optimizations are memory-efficient, CPU-efficient and contribute the efficient statistical testing. Furthermore, we study how to salvage the computation for a sharing optimization with significant performance sav-ings, instead of conducting the testing for each combination independently. Extensive experimental evaluations have been conducted and the results indicate that our frame-work is computationally scalable, efficient and practical.
The rest of this chapter is organized as follows. In the next section, we provide some preliminaries about epistasis discovery. In section 3.3, we provide the main architecture of our proposed framework. Section 3.4 introduces our approach for preprocessing the raw data and how to make efficient statistical testings using our transformed data within one combination. Section 3.5 presents the task distribution models. In Section 3.6, we describe the strategy of combination enumeration with sharing optimization for the given task in each processing unit. Section 3.7 reports the experimental results. Finally, we summarize this work in Section 3.8.
3.2
Preliminaries
In this section, we first review some preliminaries on epistasis discovery.
In genome-wide association study (GWAS), there are two types of data - genotype data that codes the genetic information of each individual like SNPs and phenotype data that measures the quantitative traits for an individual such as diseases. Epistasis dis-covery aims at discovering significant correlation between the SNPs and phenotypes